GRAPH - BASED HIGH RESOLUTION SATELLITE IMAGE SEGMENTATION FOR
OBJECT RECOGNITION
K. Ravali a, *, M.V.Ravi Kumar b, K. Venugopala Rao b
a
Department of Computer Science & Engineering, Sreenidhi Institute of Science and Technology, Hyderabad, India, [email protected]
b
National Remote Sensing Centre, ISRO, Department of Space, Balanagar, Hyderabad, India, (ravikumar_mv, venu_koppaka)@nrsc.gov.in
Commission VI, WG VI/4
KEY WORDS: High Resolution, segmentation, classification, graph, computer vision, Mahalanobis.
ABSTRACT:
Object based image processing and analysis is challenging research in very high resolution satellite utilisation. Commonly ei ther pixel based classification or visual interpretation is used to recognize and delineate land cover categories. The pixel based classification techniques use rich spectral content of satellite images and fail to utilise spatial relations. To overcome th is drawback, traditional time consuming visual interpretation methods are being used operational ly for preparation of thematic maps. This paper addresses computational vision principles to object level image segmentation. In this study, computer vision algo rithms are developed to define the boundary between two object regions and segmentation by representing image as graph. Image is represented as a graph G (V, E), where nodes belong to pixels and, edges (E) connect nodes belonging to neighbouring pixels. The transformed Mahalanobis distance has been used to define a weight function for partition of graph into components such that each component represents the region of land category. This implies that edges between two vertices in the same component have relatively low weights and edges between vertices in different components should have higher weights. The derived segments are categorised to different land cover using supervised classification.
The paper presents the experimental results on real world multi-spectral remote sensing images of different landscapes such as Urban, agriculture and mixed land cover. Graph construction done in C program and list the run time for both graph construction and segmentation calculation on dual core Intel i7 system with 16 GB RAM, running 64bit window 7.
accurate geospatial information required for earth resource management, disaster management, urban management and climate applications. Commonly used image classification algorithms, based on the spectral value of pixels are unsuccessful for extraction of object level information from VHRS data (Rego and Koch, 2003). The traditional statistical image classifications algorithms fail to define desired object and its spatial extension for delineation. Several operational large scale mapping projects
executes work by time
consuming manual interpretation and digitization techniques for extraction of large scale geospatial information from VHRS data. It is estimated about 16 man hours per sq.km is required for extraction large scale (1:5,000 scale) geospatial data extraction from VHRS data.
2. GRAPH BASED IMAGE SEGMENTATION
The problem of VHRS image segmentation to achieve object level group is still remain a challenge for remote sensing data
image processing. In computer vision algorithms, image can be represented as a graph. A G(V,E) undirected graph can be generated from a image, where nodes belongs to pixels and edges (E) connect nodes belonging to neighbouring pixels. Form the image of size Width (W) and Height (H), the number of nodes n = WH and edges m = (W(H-1) + (W-1)H. There is number of graph based image segmentation algorithms are published in computer vision literature. The segmentation method proposed by Zahan1971 based on the minimum spanning tree (MST) of the graph. This method was proposed to cluster points as well as image. The segmentation criteria are weighted threshold to spilt into multiple regions. In this work, graph based image segmentation algorithm developed by Pedro F. Felzenszwalb, Daniel P. Huttenlocher, 2004 has been implemented for object level segmentation of VHRS data.
3. IMPLEMENTATION
The landscape satellite images been used for image segmentation using Pedro F. Felzenszwalb, Daniel P.Huttenlocher, 2004 graph-based image segmentation algorithm.
3.1 Experimental Results
Different satellite images ranging from medium resolution IRS LISS-IV to very high resolution satellite images have used for image segmentation experiments. In this method Gaussian filter would be used smooth image to remove noise or artifacts before computing graph edge weights. In this different Gaussian
value 0.2; 0.4; 0.6 and 0.8 are used to understand dependence on grouping the segments. The value k is used to compute the threshold function. For example in this experiments k = 400 has been used in all cases.Medium Resolution Satellite Image
Figure 1 (a) IRS LISS –IV FCC image (Agriculture filed in Haryana)
Figure 1 (b) Segmentation with
Figure 1 (d) Segmentation with
Figure 1 (e) Segmentation with
The segmentation results with
as shown in Figure 1 (d) are encouraging with clarity on crops fields and bunds.Experiment-2
(http://www.dhigras.com/solutions/agriculture/croptypema ppingandyieldestimates)
Figure 2 (a) VHRS image of Crop Pattern
Figure 2 (b) Segmentation with
Figure 2 (c) Segmentation with
Figure 2 (c) Segmentation with
Figure 2 (d) Segmentation with
The segmentation results with
as shown in Figure 2 (d) exhibits good grouping of crop and fellow agricultural fields.Very High Resolution Images (Source: http://www.florianpucher.com/download.html)
Experiment-1
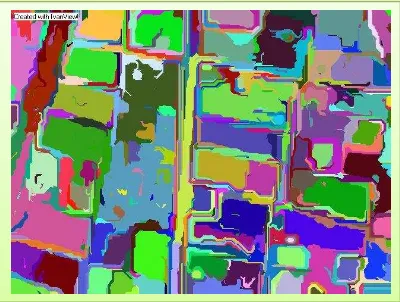
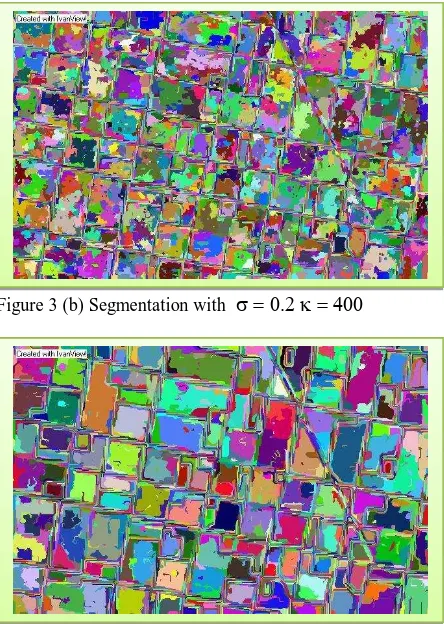
Figure 3 (a) Land-carpet VHRS image
Figure 3 (b) Segmentation with
Figure 3 (c) Segmentation with
The International Archives of the Photogrammetry, Remote Sensing and Spatial Information Sciences, Volume XL-8, 2014Figure 3 (d) Segmentation with
Figure 3 (e) Segmentation with
The segmentation results with
as shown in Figure 3(d) exhibits good grouping of fields. The higher
value based segmentation results over grouping of objects. This is because the filed objects are large and smooth.Experiment-3
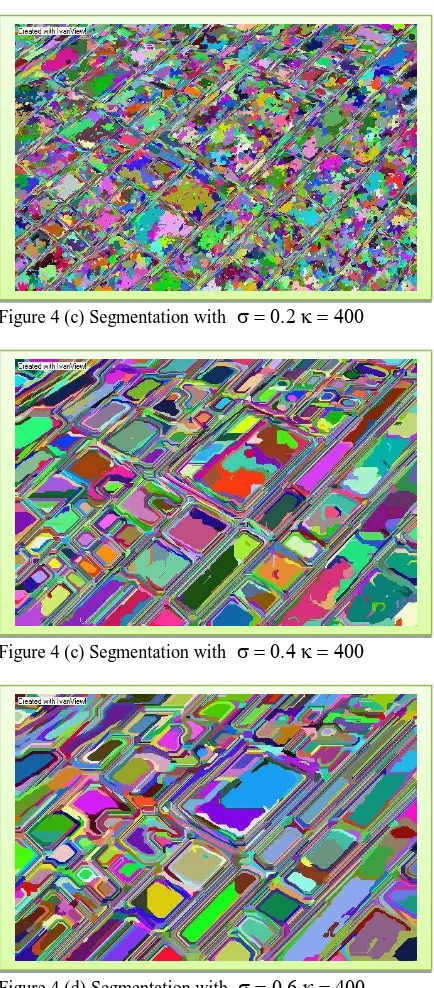
Figure 4 (a) VHRS image of Crop Pattern
Figure 4 (c) Segmentation with
Figure 4 (c) Segmentation with
Figure 4 (d) Segmentation with
The segmentation results with
as shown in Figure d(c) exhibits good grouping of fields. The results are comparable Figure 3(d).4. CONCLUSIONS
As alternative to traditional statistical image clustering, in this graph based very high resolution satellite image segmentation has been experimented. The results are encouraging and exhibited object level grouping. It important to note optimum
and
values are dependent on the image spatial resolution, spectral values and type landscape. Graph based image segmentation can be first step for development automatic object recognition and large scale mapping.ACKNOWLEDGEMENTS
The authors are grateful to the Dr. V. K. Dadhwal, Director NRSC and P G Diwakar, Dy. Director NRSC and providing support for carrying this work in NRSC, ISRO, Hyderabad.
REFERENCES
Rego, F., and Koch, B., (2003) Automatic classification of land cover with high resolution data of the Rio de Janeiro city.
Felzenszwalb, P.F., and Huttenlocher, D.P., 2004, Efficient graph-based image segmentation, International Journal of Computer Vision, Volume 59 Issue 2, September, Pages 167 – 181.