Resistance modelling of ammonia exchange over oilseed rape
Eiko Nemitz
a,b,∗, Mark A. Sutton
a, Jan K. Schjoerring
c,
Søren Husted
c, G. Paul Wyers
daCentre for Ecology and Hydrology (CEH), Edinburgh Research Station, Bush Estate, Penicuik, Midlothian EH26 0QB, UK bUniversity of Manchester Institute of Science and Technology (UMIST), PO Box 88, Manchester M60 1QD, UK cDepartment of Agricultural Sciences, Plant Nutrition Laboratory and Centre for Ecology and Environment, Royal Veterinary and
Agricultural University (RVAU), Thorvaldsensvej 40, 1871 Frederiksberg C, Copenhagen, Denmark
dNetherlands Energy Foundation (ECN), Petten ZG1755, Netherlands
Received 1 February 1999; received in revised form 19 May 2000; accepted 20 June 2000
Abstract
Ammonia (NH3) surface/atmosphere exchange is bi-directional and as such resistance models must include canopy
concen-trations. An existing single layer model that describes the exchange in terms of adsorption to leaf cuticles and bi-directional transport through leaf stomata, which is governed by a stomatal compensation point (χs), is applied here to NH3exchange
over oilseed rape and compared with measured fluxes. For the first time the model is tested using values ofχsbased on the
apoplastic ratio [NH4+]/pH (Γs) measured directly in the field. Strong NH3emission from decomposing leaf litter at the
ground and the likelihood of high [NH4+] in the siliques complicate the exchange pattern with oilseed rape and limit the
application of the original model. This is therefore extended by: (a) the inclusion of a litter layer (2-layer model), with an emission potential (Γl), (b) additionally dividing the plant canopy into a foliage- and a silique-layer (3-layer model) and (c)
considering the relative humidity (h) dependency ofΓl. The 2-layer model is able to predict night-time emission, but daytime
emission is estimated to originate from the litter layer, which is in contradiction to the NH3sources and sinks derived for
this canopy. The 3-layer model using a constant value ofΓlrequires an emission potential for the siliques of about 1300,
which is consistent with bioassay estimates. Together with a parameterization ofΓlthat increases withhthis model indicates
that during daytime emission originates from the siliques, in agreement with the source/sink analysis. It is concluded that the leaf stomata were an effective NH3 sink, whereas the leaf litter dominates night-time emissions and the silique-layer
(probably) daytime emissions. Although the 2-layer model reproduces the net exchange, the 3-layer model appears to be the mechanistically more accurate description. © 2000 Elsevier Science B.V. All rights reserved.
Keywords:Ammonia fluxes;Brassica napus; Resistance analogue; Multi-layer models; Compensation point
∗Corresponding author. Present address: Centre for Ecology
and Hydrology (CEH), Edinburgh Research Station, Bush Estate, Penicuik, Midlothian EH26 0QB, UK. Tel.:+44-131-445-4343; fax:+44-131-445-3943.
E-mail address:[email protected] (E. Nemitz).
1. Introduction
With the recognition of the adverse effects of atmo-spheric ammonia (NH3) as a contributor to acidifica-tion and ecosystem eutrophicaacidifica-tion (e.g. Van Breemen and Van Dijk, 1988; Pearson and Stewart, 1993), it has become important to estimate the magnitude of the surface/atmosphere exchange of NH3. Since the 0168-1923/00/$ – see front matter © 2000 Elsevier Science B.V. All rights reserved.
costs of continuous measurements of NH3 exchange with ecosystems permits measurements to be made at only a few sites and for limited periods, it is neces-sary to parameterize the surface interaction of NH3. A key goal of model development is the derivation of net fluxes from single height concentration fields. Over the past 20 years, many parameterizations of the deposition of atmospheric pollutants have been de-veloped (e.g. Hicks et al., 1987; Fowler et al., 1989; Wesley, 1989; Erisman et al., 1994; Walmsley and Wesley, 1996), which are now frequently used, in at least simplified form, in atmospheric transport and de-position models (Asman and Van Jaarsveld, 1992; Bar-rett and Berge, 1996; Sorteberg and Hov, 1996).
Unlike some other gases, such as ozone, sul-phur dioxide or nitric acid, NH3 can be both emit-ted by plants and soils as well as deposiemit-ted. This bi-directional behaviour is not accounted for in most resistance models, the applicability of which for NH3is therefore limited to certain conditions. More advanced models are necessary (i) to estimate cor-rectly the magnitude of NH3emission from fertilized agricultural surfaces, (ii) to estimate the net surface interaction in atmospheric transport models and (iii) for the assessment of the exceedance of critical loads of nitrogen, especially for sensitive ecosystems. Am-monia emission from plants has often been identified to originate from ammonium in the leaf apoplast ([NH4+]), leading to a compensation point acting through stomata (Farquhar et al., 1980). A single layer resistance model that accounts for simultaneous stomatal emission of NH3 and recapture by leaf sur-faces was presented by Sutton and Fowler (1993). The application of this model has so far been restricted by the limited availability of direct measurements of apoplastic [NH4+] and pH.
As part of the EU ‘EXAMINE’ project, a field campaign was conducted over oilseed rape near North Berwick, southeast Scotland, during which both the net flux of NH3 with the atmosphere and stomatal compensation points were measured independently (Sutton et al., 2000a). This dataset therefore provides the unique possibility for the assessment of existing bi-directional models, as well as for improvement of the mechanistic description of NH3 exchange. The analysis of the NH3 sources and sinks in this rape canopy demonstrated that decomposing plant litter at the soil surface provided a second major source in this
canopy, in additional to stomatal emission (Nemitz et al., 2000a). While this emission was recaptured by the plant foliage during daytime, it appears to have escaped the canopy during some nights.
The single-layer canopy compensation point model for NH3 has been shown to work well for agricul-tural and forest vegetation in which adsorption and desorption processes take place at a common height, and where soil processes can be ignored (Sutton and Fowler, 1993; Sutton et al., 1995, 1998). However, the oilseed rape canopy provides an example showing that multiple sources and sinks of NH3can be found in certain canopies. These sources and sinks can be allocated to certain heights within the canopy and dif-fer in their controlling physiological and meteorologi-cal parameters. As with the evaporation from a sparse crop, which may originate from both the foliage and the soil (Shuttleworth and Wallace, 1985), such pro-cesses can only be dealt with in multi-layer modelling approaches.
For the oilseed rape canopy, novel multi-layer ap-proaches and new parameterizations of NH3exchange are developed here (i) to reproduce emission that orig-inates from different heights at different times of the day, (ii) to quantify component fluxes for the different plant parts and (iii) to develop and test a mechanistic understanding of the exchange process of ammonia with oilseed rape.
In parameterizing the surface/atmosphere exchange of NH3, two opposing interests are distinguishable. On one hand, a deeper mechanistic understanding can re-sult in increasingly complex scientific models, which require a large number of input parameters. Against this may be set the principle that parametrizations de-veloped for use in operational regional scale atmo-spheric transport and deposition models should be easy to calculate and based on as few variables as possible. This paper presents models of increasing complexity, including NH3from fallen leaf litter and siliques (rape seed cases), but also considers the gain in accuracy vs. simplicity and applicability.
2. Theory: existing single-layer resistance models of NH333exchange
By analogy to electrical resistances, a flux (Fχ) of
between two heights (z1 andz2) and impeded by the atmospheric resistances between these heights (R(z1, z2); e.g. Monteith and Unsworth, 1990):
Fχ = −
χ (z2)−χ (z1) R(z1, z2)
. (1)
In this paper, an uppercaseRis used for resistances de-fined on a canopy area basis, and a lowercaserrefers to leaf area based resistances. While two atmospheric resistances, i.e. the aerodynamic resistance,Ra(z), and the quasi-laminar bulk resistance,Rb(e.g. Sutton et al., 1993), always contribute to the total exchange re-sistance (Rt), the parameterization of the canopy in-teraction depends on the tracer under consideration. The canopy exchange may be modelled as a network of parallel and serial resistances and in a single- or multi-layer approach (e.g. Baldocchi et al., 1987).
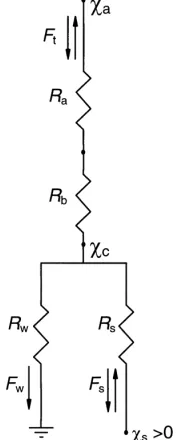
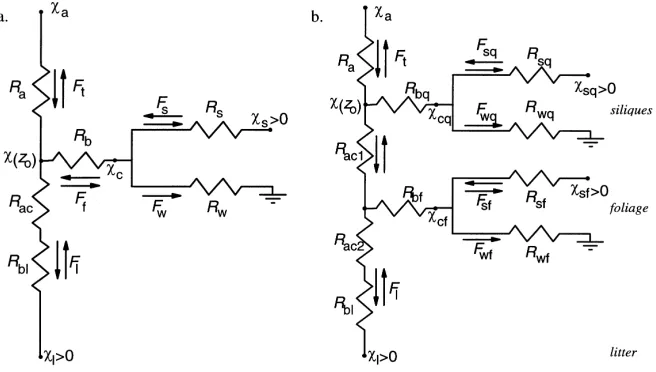
In general, plant foliage offers at least two par-allel pathways of NH3 exchange: in addition to bi-directional exchange through stomata, there can be adsorption of NH3 by dew and thin water films on leaf cuticles, which accounts for night-time deposi-tion that is often observed despite stomatal closure (Sutton and Fowler, 1993; Sutton et al., 1995). The analysis of Sutton and Fowler (1993), accounting for these two pathways (Fig. 1), represents an approach referred to here as a single-layer canopy compensa-tion point model (χs–Rwmodel).
The stomatal exchange flux (Fs) is governed by the relative magnitude of the canopy concentration (χc) and the gas concentration in the sub-stomatal cavity (χs), which is expected to be in equilibrium with the [NH4+] in the leaf apoplast governed by temperature (T) and pH (Farquhar et al., 1980). Hereχsrepresents the stomatal compensation point, leading to stomatal emission for χc < χs and deposition for χc > χs. Stomatal exchange is the dominant pathway under warm and dry conditions, such as in controlled envi-ronment studies, where conditions are kept constant over long periods so that the loadings of leaf cuticles equilibrate with air concentrations. In these conditions theχs–Rwmodel is reduced to a stomatal compensa-tion point model, often used to describe bi-direccompensa-tional fluxes of CO2 and evapotranspiration with vegeta-tion. As with CO2transfer and evapotranspiration, the stomatal resistance (Rs) depends on leaf morphology, leaf area index (Ls), photosynthetically active radiation (PAR), temperature (T), and can also be influenced by
Fig. 1. The single-layer canopy compensation point (χc) resis-tance model (χs–Rwmodel) allows for simultaneous bi-directional ammonia transfer through leaf stomata (controlled by the stom-atal resistance,Rs, and the stomatal compensation point,χs) and deposition to leaf cuticles (controlled by the cuticular resistance
Rw). Also shown are the net flux (Ft) as well as the component fluxes through stomata (Fs) and to the cuticle (Fw).RaandRbare the atmospheric and the boundary-layer resistance, respectively.
relative humidity (h) and drought closure due to water stress (e.g. Jarvis, 1976).
The cuticular desorption flux (Fw) is governed by the cuticular resistance (Rw) andχc. At night-time,Rs is large and the model is reduced to a model similar to theRc-model used for tracers which are only deposited and for which the surface concentration is thought to be zero, such as HNO3and O3. Usually the NH3gas concentration at the surface of the cuticle is assumed to be negligible (Wesley, 1989). Rw is expected to change with leaf wetness, which in return depends on h. The magnitude of χc is the result of the two competing pathways and may be calculated as (Sutton and Fowler, 1993; Sutton et al., 1998):
χc= χa(Ra(z)+Rb) −1+χ
sRs−1 (Ra(z)+Rb)−1+Rs−1+Rw−1
. (2)
The net flux (Ft) is given by
Ft= −
χa−χc Ra(z)+Rb
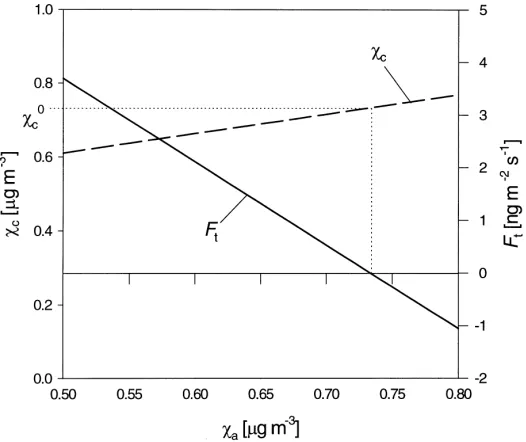
Fig. 2. The dependence of the canopy compensation point (χc) and the net flux (Ft) on the air concentration (χa) for constant values of the total atmospheric resistance (Ra+Rb =30 s m−1), cuticular resistanceR
w =100 s m−1, stomatal resistance R
s =50 s m−1 and stomatal compensation pointχs=1.1mg m−3. The true canopy compensation point (χ
c0) is the value forχc atFt=0. where χc is here termed a ‘canopy compensation
point’, although unlike the stomatal compensation point, it is not only a function of the physiological state of the canopy but depends also on χa (Fig. 2). Strictly, the true canopy compensation point (χc0) denotes the mean concentrations when all emission and deposition processes within the canopy balance in such a way that the net flux vanishes (Sutton et al., 1998). For the model of Fig. 1 this is the case when stomatal emission is balanced by cuticular adsorption. Nevertheless,χcremains the central term in resolving the net effect of within-canopy component emission and deposition fluxes (Eq. (2)).
As a further modification of this single-layer model, Sutton et al. (1998) treated cuticular adsorp-tion/desorption fluxes of NH3in a dynamic approach as an electric capacitor with a surface charge (χd) which may be released when water layers evaporate in the morning. Flechard et al. (1999) predictedχdby modelling the full leaf surface chemistry. The present study, however, concentrates on multi-layer modelling and is restricted to resistance calculations that change only with micrometeorological conditions, but not according to the emission/deposition history of the canopy.
3. Summary of the measurement results at North Berwick
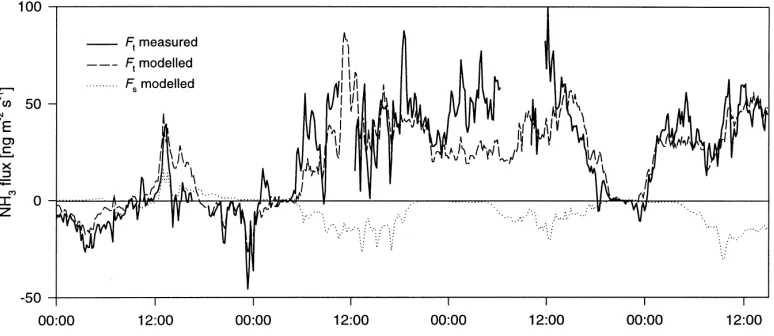
An overview over the measurements carried out dur-ing the North Berwick campaign (6–27 June 1995) was given by Sutton et al. (2000a). The NH3net exchange flux, measured with the aerodynamic gradient tech-nique using a three-point continuous denuder analyser, was presented by Sutton et al. (2000b). These measure-ments show the diurnal cycle typical for agricultural canopies with emission of up to 150 ng m−2s−1 dur-ing the day, consistent with stomatal emissions. How-ever, as exemplified in Fig. 3, night-time emission was also observed which indicated a source in addition to leaf tissues, sinceRs is very large during night. One possible non-stomatal source is the evaporation of wa-ter layers on leaf cuticles (Sutton et al., 1998). How-ever, this would not be able to explain the persistence of these emissions, nor the positive relationship to the relative humidity (h) in the canopy, e.g. nights from 11 to 12, and from 12 to 13 June (see also Fig. 9b).
Fig. 3. Example results of the application of the 1-layerχs–Rw model to measurement data from North Berwick for 10–13 June 1995. The measured flux (Ft) is shown together with the modelled fluxes for a measured apoplastic ratio [NH4+]/[H+] (Γs) of 390 and an arbitrary value ofΓs=1200. Also shown is the component stomatal flux (Fs) forΓs=1200. The flux to the leaf cuticle (Fw) is given as the difference betweenFt(Γs=1200) andFs.
application of an inverse Lagrangian technique (ILT) to infer the vertical distribution of sources and sinks in the canopy showed that during the day the ground level emission was recaptured at mid canopy (Nemitz et al., 2000a). With a mid-canopy flux close to zero the source/sink analysis predicted daytime NH3net emis-sion to originate from the top of the canopy, where the siliques (seed cases) are located. However, dur-ing night there was a strong dependency of the sign of the net flux on the value of the friction velocity (u∗) (Fig. 4). This suggests that, during high turbu-lence conditions, the ground level leaf litter emission
Fig. 4. The ratio of the number of observed nocturnal NH3 emis-sions (10 min values) to total observations for different classes of
u∗(20:00–4:30 GMT).
reported by Nemitz et al. (2000a) penetrated through the canopy, whereas it was captured by the canopy for small values ofu∗. Likely reasons are (i) that the turbu-lent resistance within the canopy (Rac), and hence the time-scale for the transport, decreases with increasing u∗, (ii) that high turbulence is often associated with lower h and less dewfall (Monteith and Unsworth, 1990), reducing recapture within the canopy, and (iii) that an increased NH3flux through the canopy as a re-sult of (i) and (ii) leads to saturation of the water layers. Although rather uncertain in this respect, the ILT esti-mated an average leaf litter emission of 32 ng m−2s−1 with peaks of up to 150 ng m−2s−1, while indepen-dent measurements with a soil chamber ranged from 10 to 50 ng m−2s−1.
found to be two to five times higher than those of the foliage of the same plants (Husted et al., 2000). Direct daytime measurements of bulk tissue [NH4+] and pH of the litter leaves by the same authors showed a high temporal and spatial variability. Estimated pH values of leaf litter ranged from 5.1 to 5.4 and [NH4+] from 5.0 to 56.5 mM, probably due to differences in de-composition stage and humidity. These variations are reflected in the value of the ratio [NH4+]/[H+] of the litter (Γl).
In the following sections, the single-layer χs–Rw model is used as the basis for the development of more detailed models including exchange with leaf litter and siliques, capable of reproducing these mea-surements. Both the original model and the extended models are then applied to the NH3 fluxes measured over oilseed rape.
4. Model development
4.1. Parameterizations for the single-layerχs–Rw model
4.1.1. Stomatal resistance
In the present study, daytime values of Rs were found from the micrometeorological measurements of water vapour transfer (Sutton et al., 2000b). A light response function that was fitted to these values al-lowsRs to be estimated for periods of measurement uncertainty at dawn and dusk. The measurements im-plicitly include secondary effects of water stress and h (Jarvis, 1976), and it was found that Rs could be adequately parameterized for the measurements here solely by the global radiation (RRRs) as
Sutton and Fowler (1993) suggested a simple parametrization for the h-response of Rw, the shape of which Sutton et al. (1995) compared with adsorp-tion data of NH3to glass and leaf surfaces (Van Hove et al., 1989): have recently re-interpreted their values of NH3 ad-sorption to calculate an effective water-film thickness on leaf scale (MH2O,eff), which they describe by
whereα2 equals 0.56 kPa, Dis the vapour pressure deficit in kPa and MH2O,eff is given in mm. The re-sulting values for highhseem large (e.g.MH2O,eff = 96mm forT =15◦C andh =90%), compared with figures obtained from weighing leaves at differenth (8–20mm) as well as the typical thickness of the leaf cuticle of 0.5–15mm. The authors conclude that with increasinghthe cuticle becomes gradually more per-meable, resulting in the extracellular fluid becoming partially available for pollutant uptake.
Adema and Heeres (1995) measured the uptake con-stant (k+) of NH3 at a gas/liquid interface that can be identified with Rw−1 for different values of pH and water-film thickness.k+was found to be strongly correlated with pH over the range of typical environ-mental conditions (4.0 < pH < 8.0) at a constant water-layer thickness of 4600mm:
Rw=k+−1=(−0.00316 pH+0.0293)−1s m−1.(7) In contrast, no obvious relationship could be found with water-layer thickness in a range of 4–4600mm. However, the artificial water layers contained T-Pol detergent to ensure continuous films, whereas on hy-drophobic waxy cuticles water layers may be dis-continuous (Cape, 1996). Despite the new estimates of Eqs. (5) and (7), it remains unclear how the pH changes with the adsorption of NH3and other gases as SO2 and to what degree leaves are covered with water films at differenth. The work of Van Hove and Adema (1996) suggests that the water-layer thickness would be more closely related toDrather thanh. The parametrization
4.1.3. Stomatal compensation point
The NH3gas-phase concentration in the sub-stomatal cavities, or stomatal compensation point (χs), is re-lated to the pH and [NH4+] concentration in the apoplast by the Henry and dissociation equilibria for NH3and NH4+(Sutton et al., 1994; modified): χs= 161500
T exp
−10380 T
[NH
4+]
[H+] (9)
at 1 atm, where T is the absolute temperature in K and concentrations are in mol l−1. From Eq. (9), the compensation point can be divided into aT-dependent part and the dimensionless emission potential (termed hereΓs), which is the ratio of [NH4+] to [H+] in the leaf apoplast. At North Berwick,Γs was experimen-tally determined by extraction of the apoplastic liquid in the field during the period 9–12 June (Section 3).
4.2. Two-layer foliage–litter model (χs–Rw–χlmodel)
The leaf litter emission (Fl) can be included into the compensation point model as demonstrated in Fig. 5a, similar to the 2-layer model presented by Shuttleworth and Wallace (1985) to simulate
evap-Fig. 5. Resistance diagrams of extended canopy compensation point models applied to describe NH3 exchange over oilseed rape. (a) A 2-layer ‘foliage–litter model’ treats litter leaves at the soil surface with the emission potential (χl) as a further emission source, with diffusion through the canopy constrained by within-canopy atmospheric and boudary-layer resistance, Rac and Rb1, respectively. (b) A 3-layer ‘foliage–litter–silique model’ additionally divides the canopy into two layers for the siliques (subscript q) and foliage (subscript f), respectively. Other resistances are as given in Fig. 1.
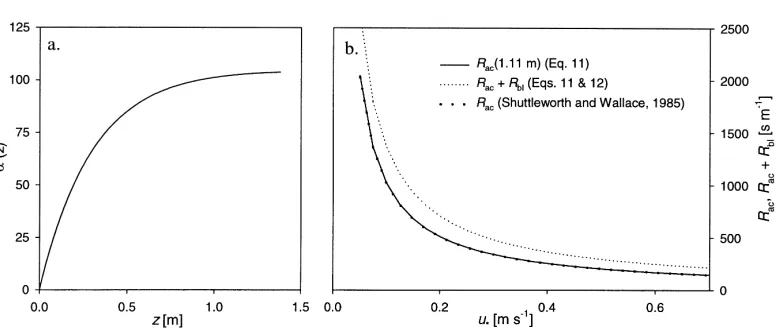
oration from sparse crop. Adding a fourth potential (χl) to the resistance network greatly complicates the solution compared with the χc–Rw model (Eq. (2)), and the solving procedure is therefore outlined in Appendix A. The turbulent resistance in the canopy (Rac) may be parameterized by (Raupach, 1989):
Rac(z1, z2)=
Z z2
z1
KH−1(z)dz, KH=TLσw2, (10) where z1 and z2 are the heights above the ground between which Rac is to be calculated and KH(z) is the eddy diffusivity. TL and σw are the Lagrangian time-scale and the standard deviation of the vertical wind component, respectively, and can be parame-terized byu∗, according to the characteristics of the canopy. Whilst a parameterization ofσwwas obtained from direct measurements (Nemitz et al., 2000a),TL was parameterized using the formulation by Raupach (1989). Using these expressions, Eq. (10) results in a simple dependency ofRaconu∗:
Rac(0, z)= α(z) u∗
. (11)
Fig. 6. Parametrization of within-canopy turbulent atmospheric resistance (Rac) and quasi-laminar boundary layer resistance (Rb1) for the ground surface litter layer. (a) Parametrization of the constantαused in Eq. (11) as a function of height (z). (b) Partitioning of the total atmospheric in-canopy resistance intoRac (1.11 m) andRb1 for different values ofu∗according to Eqs. (11) and (12), compared with an
alternative description ofRac(Shuttleworth and Wallace, 1985), using an exponential decay parameter ofn=4.
as the zero-plane displacement,d =1.1 m)αequates to 102.3. The resulting values of Rac, derived from the measurements at North Berwick, agree very well with the parameterization of Shuttleworth and Wallace (1985) if a decay constant (n) of 4 is used in their expression (Fig. 6b). However, these authors neglected the contribution of the boundary layer resistance (Rb1) which is here calculated according to Schuepp (1977):
Rb1−1= ku∗g Sc−ln(δ0/zl)
, (12)
where k is the von Kármán constant (0.41) and Sc the Schmitt number for NH3. δ0 the distance above ground where molecular diffusivity (Dχ) equals the
eddy diffusivity (Dχ ∼= ku∗gδ0), and zl is the up-per height of the logarithmic wind profile that forms above the ground and of which u∗g/ k is the slope.
Since the wind profile was not measured this close to the surface, rough estimates of u∗g and zl are based on data presented by Schuepp (1977). Here the val-ues u∗g = u(1.68 m)/20 and z1 = 0.1 m are used. u(1.68 m) is the wind speed at the lowest height above the canopy (canopy height: hc = 1.38 m), at which measurements were carried out continuously. On an average,Rb1contributed 30% to the total atmospheric in-canopy resistance (Fig. 6b).
The NH3 gas concentration at the surface of the fallen leaf litter (χl) is calculated as the gaseous NH3
concentration in equilibrium with [NH4+] and pH of the water in the litter leaves, by analogy to Eq. (9). As discussed by Nemitz et al. (2000a),χl is affected by the liquid water content of the litter leaves, tempera-ture, previous emission as well as mineralization and nitrification rates. Because of the high variability in measuredΓl, this was set to an arbitrary value, that led to a reasonable agreement between the modelled and the measured flux for each whole 24-h period. In an ef-fort to simplify the estimation ofΓl, it was found that the fitted Γl could be approximated by one of three values in the range 3000–13 000 which was broadly similar to the range of available measurements. For 6 and 14 June values had to be chosen which were greater than the measured values. ForΓs a leaf area index (Ls) weighted average of the measured values was applied where available, while the initial and final values were used for other periods. The values derived from this exercise are presented in Fig. 7.
The equilibrium gas concentration (χl) was cal-culated using Eq. (9) with an average temperature (Tave) of the temperatures at z′
0 (T (z′0)) and the soil (Tsoil),z′
Fig. 7. Time series of the values of the ratioΓ =[NH4+]/[H+] of both living (Γs) and litter (Γl) leaves as measured and as used for the foliage–litter-model for 6–26 June 1995. The measured values ofΓswere used between June 9 and 15 and the first and last measured values were applied beyond this period.Γl was only measured on three occasions, showed high scatter (error bars indicate standard deviations) and is highly uncertain (see text).Γl was therefore set to one of the three values (3000, 6000 or 13 000) to fit the measured flux.
compared with T (0.06 m) = 0.61T (z′
0) + 4.10, R2=0.94,N =93.
4.3. Three-layer model distinguishing different foliage layers((χs–Rw)2–χl model)
The importance of the silique layer as a further source can be assessed indirectly through the improve-ment of the model performance after inclusion of a further layer (Fig. 5b). Whilst bulk resistances can be used for models treating the canopy as a ‘big leaf’, splitting up the canopy into different layers requires the calculation of the different resistances on a leaf area basis. The total surface area index (Ls) of the siliques was estimated to be 3.2 (Gammelvind et al., 1996), whereas the double sidedLs of the leaves was measured as 4.3 (Nemitz et al., 2000a). ForBrassica napus, Jensen et al. (1996) reported adaxial and abax-ial leaf stomatal densities of 112 and 125 mm−2, re-spectively, together with a stomatal density of the siliques of 58 mm−2. From direct measurements of the stomatal conductances on leaf area basis (gs) at different heights in the oilseed rape canopy at North Berwick leaf area averaged values of gs of 4.3 and 3.5 mm s−1were found for leaves and siliques, respec-tively. On a canopy-scale these values, combined with theLsvalues, suggest a 1.8 times higher conductance of the foliage-layer than of the silique-layer.
There-fore the ‘bulk’ stomatal resistances of the foliage-layer (Rsf) and the silique-layer (Rsq) equate to
Rsf = 2.8
1.8Rs, Rsq=2.8Rs. (13) The values for the resistance to cuticular adsorption imposed by foliage (Rwf) and siliques (Rwq) were cal-culated in a similar way, and the aerodynamic re-sistances within the canopy (Rac1 and Rac2) param-eterized by u∗ according to Eq. (11) and Fig. 6a. The canopy scale boundary-layer resistance of foliage (Rbf) and siliques (Rbq) is calculated as (Baldocchi, 1988; Schuepp, 1993):
Rbf,q= rb Ls
= l
DNH3LsSh
, (14)
nor-malized within-canopy profile ofu(z)/u(1.68 m) pre-sented by Nemitz et al. (2000a).
4.4. Modelling diurnal variability inΓl
In order to investigate the possible effect of diurnal cycles ofΓl, a simple dependence onh is suggested and compared with the measurements:
Γl=Γl,maxexp
−1−h a
, (15)
whereΓl,max is the value forΓl from Fig. 7, neces-sary to obtain the night-time emission under humid conditions and ais a constant, which is obtained by fitting the modelled to the measured flux. This pa-rameterization would clearly fail in the foliage–litter model using the measured values ofΓsf, since neither stomatal emission nor ground litter emission could ac-count for the observed high daytime emission. There-fore the h dependency of Γl was only used in the foliage–litter–silique model.
5. Results: application of resistance models to NH333exchange measurements with oilseed rape 5.1. Single-layer model
The application of theχs–Rw model to an exam-ple period using the measured estimates ofΓs(with a
Fig. 8. Application of the foliage–litter-model (Fig. 5a) to the four day period 10–13 June 1995, covering a variety of meteorological conditions. Measured and modelled net-flux (Ft) are shown together with the modelled exchange through the stomata of the living leaves (Fs).
mean of 390), contrasted with an arbitrarily assumed constant value ofΓs =1200, is shown alongside the measured flux in Fig. 3. For 10 June the model, us-ing the apoplastic estimate ofΓs, reproduces the mea-sured flux fairly closely, whereas hardly any emission is predicted for all other days, during which χs re-mains belowχa. Arbitrarily raisingΓs to a value of 1200 leads to a better fit for some daytime periods (12 and 13 June), but the emission on 10 June is overes-timated. During night-time, when stomata are closed and adsorption to the leaf cuticle is the only other ex-change process described in this model, periods of de-position are accurately dealt with, whereas periods of emission cannot be explained.
5.2. Two-layer model
Fig. 9. The foliage–litter–silique model applied to the example period of Fig. 3 (10–13 June 1995), using experimental values of the foliar [NH4+]/[H+] ratio (Γsf), a value of 1500 for the siliques (Γsq) and for the litter (Γl) according to Eq. (15) witha=30 andΓl,max from Fig. 7. (a) Measured and modelled net flux with the atmosphere (Ft) as well as stomatal from the silique stomata (Fsq) and the litter layer (Fl). (b) Diurnal variability in modelledΓl in relation to the relative humidity measured just above the canopy (h(z=1.68 m)).
whole day. There are several possible mechanistic ex-planations: adsorption of NH3 to water layers (Fw) could be overestimated in this case, because contin-uous adsorption to the leaf cuticle is likely to raise both [NH4+] and pH of the water-layer, resulting in a non-zero concentration at the leaf surfaces. This effect, however, can only be accounted for in dynamic models (e.g.χd, Sutton et al., 1998). As with the 6–9 June, the 10 June could be modelled withΓ1=6000, whereas for the following days, this value had to be increased to 13 000. A possible explanation could be increased microbial activity after the very humid night from 10 to 11 June (see Fig. 9b). In contrast, the apoplastic measurement indicated that Γs was relatively stable over this period. As a consequence, the daytime ex-change through leaf stomata shows emission until 10 June and considerable adsorption afterwards, domi-nated by uptake of NH3 emitted by the leaf litter (Fig. 8).
5.3. Three-layer model
The 3-layer model was applied with values forΓl andΓsffrom Fig. 7 and various constant values ofΓsq to explore the sensitivity to this term. Both the average values and correlation coefficients of the modelled vs. the measured flux are presented in Table 1.
Table 1
Results of applying the foliage–litter–silique model (Fig. 5b) to the period 6–26 June demonstrating the model sensitivity to assumed values of the apoplastic ratio [NH4+]/[H+] in the siliques (Γsq)a
Case Γsq R Ft all data (ng m−2s−1) Ft daytime (ng m−2s−1) Fsq daytime (ng m−2s−1)
Measured flux – 1 15.7 24.9 –
Foliage–litter model – 0.65 13.4 19.8 (Fs= −9.1)
1 500 0.59 9.6 14.1 1.2
2 1000 0.66 13.7 20.2 8.3
3 1260 0.67 15.7 23.8 12.0
4 1500 0.68 17.7 26.4 15.5
5 2000 0.69 21.8 32.5 22.6
6 (h-dependentΓl) 2000 0.62 13.5 22.1 23.3
aOverall mean and daytime mean of measured flux (F
t) are compared with the mean modelled flux and modelled stomatal exchange of the siliques (Fsq). The correlation coefficient (R) is shown for the comparison of overall Ft. The results of the foliage–litter model (Fig. 5a) are presented for comparison including the mean stomatal flux (Fs). Values of Γ for leaves (Γl) and foliage (Γsf) are from Fig. 7, except for case 6, which considers diurnal variability inΓl as a function of relative humidity (h) from Eq. (15).
total emission flux (Ft). In the foliage–litter–silique model, the highΓlvalues of Fig. 7 are still necessary to reproduce the night-time emission measured.
Two likely sources of error can be identified in the model parameterization: firstΓlmight be larger dur-ing night-time than for daytime, and second the trans-fer resistance for the litter emission (Rb1+Rac1) is expected to be over-estimated when free convection contributes to the transport within the canopy during night. In particular,Rac1is based on a parameterization ofσw/u∗that was obtained during daytime conditions. However, night-time emission usually coincided with relatively strong turbulence (see Fig. 4), conditions under which the error associated withRb1andRac1is expected to be similar to the daytime situation. Diur-nal variability inΓlis therefore the most likely expla-nation of these discrepancies, with chamber measure-ments in the field indicating a largerΓl for nocturnal high humidity conditions (Nemitz et al., 2000a).
5.4. Humidity dependence ofΓl
Next, the 3-layer model was applied with a h-dependent Γl according to Eq. (15). Whilst an op-timum value of Γsq of 1260 had been found in the model run using a constantΓl(Table 1), the suppres-sion ofΓlduring dry daytime conditions necessitated the use of a greaterΓsq (2000) in order to reproduce the measured daytime emission. Applying a value of a = 30 yields a correlation coefficient between measured and modelled Ft of R = 0.62, and an
average model flux of 13.5 ng m−2s−1that compares well with the measured value of 15.7 ng m−2s−1 (Ta-ble 1). At the same time the average daytime stomatal emission from the siliques of 23.3 ng m−2s−1 was comparable with the average daytime net emission of 22.1 ng m−2s−1, which would be in agreement with the prediction of the ILT. The application of the foliage–litter–silique model to the example period used for the other models (Figs. 3 and 8) is shown in Fig. 9, with a scatter plot in Fig. 10. The modelled daytime net emission is virtually identical to the emis-sion from the silique layer. Consequently, the litter
emission, which is of the same order of magnitude as predicted by the ILT, is found to be recaptured in the foliage litter (Fig. 9). For this example period, the night-time emission predicted to originate from the litter layer is underestimated, although the inclusion of ah-dependent Γl improves the model fit on other days. A possible explanation is the underestimation of hat the ground surface by the measurement estimate applied just above the canopy (z= 1.68 m). Further uncertainties in Eq. (15) are addressed in Section 7.3.
5.5. Application of the models to the whole measuring period
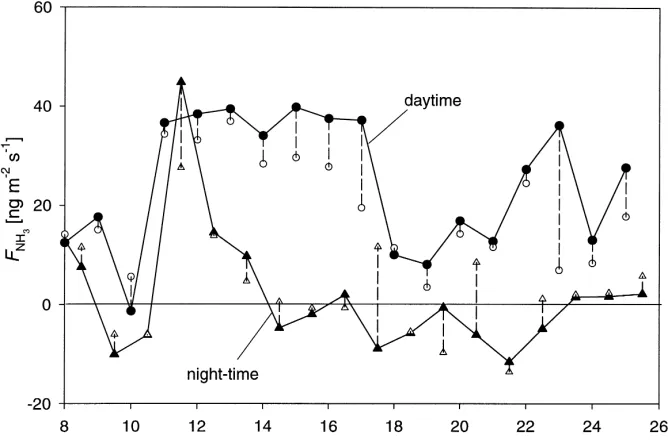
In the past, resistance models describing the bi-directional exchange of NH3 have been mainly compared with measurements for periods of a few days (e.g. Sutton et al., 1995, 1998; Wyers and Erisman, 1998). Application to longer periods is necessary to assess the adequacy of mechanistic model descriptions more rigorously (Plantaz, 1998; Flechard et al., 1999). Here both the foliage–litter and the foliage–litter–silique model were applied to the whole of the data set. Fig. 11 shows the time-series
Fig. 11. Time series of averaged fluxes as measured (full symbols) and predicted by the foliage–litter model (Fig. 5a) (open symbols) for daytime (04:30–20:00 GMT) and night-time (20:00–4:30 GMT) periods for 8–26 June 1995. The model is based on theΓ values of Fig. 7, and other resistances from Eqs. (5), (9), (12) and (13).
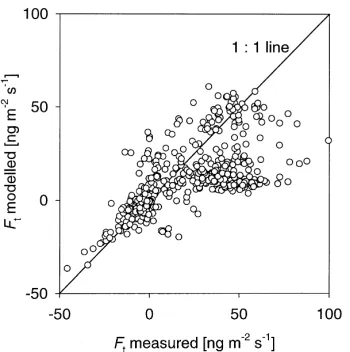
Fig. 12. Comparison of (a) the daily net exchange flux (Ft) and (b) the standard deviation (σF) of daily measured and modelled net NH3flux from 10 min values using the foliage–litter model. The 1:1 relationships (solid lines) and the linear regressions (dotted lines) are also shown.
Table 2
Contribution of different component exchange fluxes to net NH3 exchange fluxes (Ft) over oilseed rape as predicted by the foliage–litter and the foliage–litter–silique modelsa
Measured Foliage–litter model constantΓl Foliage–litter–silique modelh-dependentΓl
All Day Night All Day Night All Day Night
n 2081 1316 765 2214 1414 800 2214 1414 800
Ft 15.7 24.9 1.4 13.4 19.8 2.1 13.5 22.1 −2.8
Fs −5.8 −9.1 −0.1 12.8 18.9 1.0
Fsf −2.9 −4.4 −0.0
Fsq 15.7 23.3 1.1
Fw −6.4 −4.0 −10.7 −8.9 −6.2 −14.0
Fwf −2.6 −1.5 −4.8
Fwq −6.4 −4.8 −9.2
Fl 25.6 32.8 12.9 9.7 9.4 10.1
χa 1.07 1.21 0.85
χ(z0) 1.17 1.43 0.71 1.01 1.29 0.52
χc,χcf 0.91 1.19 0.43 0.95 1.18 0.62
χcq 1.11 1.55 0.36
χs,χsf 0.58 0.73 0.30 0.60 0.75 0.31
χsq 4.09 5.10 2.10
χl 12.22 14.00 8.82 5.87 5.13 7.31
aThe foliage–litter–silique model was run withΓ
Table 3
Sensitivity analysis for the 3-layer model: a single parameter is changed within the bounds specified in brackets, while all other parameters are kept constanta
Modified value Γsqconstant (2270) Γsqfitted forFt(model)=Ft(measured)
R(Fmeasured vs.Fmodel)
MeanFt (ng m−2s−1)
Fsq/Ft (daytime)
Best fitΓsq R(Fmeasured vs.Fmodel)
Fsq/Ft (daytime)
Unmodified model 0.62 15.7 (=Ft measured) 1.07 2270 0.62 1.07
Ft measured (∓25%) 0.62/0.62 15.7/15.7 1.07/1.07 1785/2755 0.61/0.63 1.04/1.09
χa measured (∓25%) 0.65/0.59 18.6/12.9 0.99/1.17 1920/2619 0.65/0.60 0.96/1.17
Γsf (∓25%) 0.62/0.63 15.2/16.2 1.10/1.04 2330/2209 0.62/0.63 1.10/1.03
Γsq(∓25%) 0.61/0.63 11.1/20.3 1.03/1.09 N/A N/A N/A
Γl,max(∓25%) 0.60/0.64 14.1/17.4 1.16/0.99 2476/2063 0.61/0.64 1.16/0.97
Rac+Rb1 (∓50%) 0.66/0.61 21.3/14.0 0.86/1.16 1553/2482 0.63/0.61 0.73/1.15
Rsf ∓50% 0.61/0.63 14.9/16.2 1.12/1.04 2370/2212 0.61/0.63 1.13/1.03
Rsq ∓50% 0.62/0.63 29.9/12.4 1.12/1.04 1474/3065 0.60/0.63 1.08/1.06
T (z′
0) ∓25% 0.56/0.62 7.1/30.4 1.10/1.05 4112/1221 0.63/0.61 1.14/0.96 aThe sensitivity to each parameter is assessed (a) by applying the model with a constant value of the silique [NH
4+]/[H+] ratio (Γsq=2270), and (b) by choosing a new value ofΓsq to fit the predicted net exchange flux to the measured average. The correlation coefficient (R) and the net flux (Ft) provide a means to test the sensitivity of the model performance, while the ratio of silique flux to total flux (Fsq/Ft) is indicative of the partitioning of the exchange between plant parts.T (z′0)is the temperature of the mean canopy height in
◦C, all other parameters are defined in Fig. 5b.
Although Figs. 11 and 12 show the comparison of the measurements with the foliage–litter model, these could equally be shown for the foliage–litter–silique model. While the latter model is considered to be a more realistic mechanistic representation of the ex-change process, the comparison shows that the simpler foliage–litter model is adequate to predict the main features of net fluxes. A comparison of the overall performance of the two models is shown in Table 2. This shows the mean component fluxes through dif-ferent plant parts as predicted by (a) the foliage–litter model and (b) the foliage–litter–silique model with h-dependentΓl. The measured net-flux (Ft) is slightly underestimated by both models. However, the aver-ages do not cover exactly the same periods: short gaps (of up to 2 h) in theχadata were interpolated and still used as model input, although measured fluxes could not be calculated. By contrast, for a few periods the flux could be measured, but there are parameters miss-ing, which are essential for the model application.
Whereas the foliage–litter model predicts deposi-tion to the leaf stomata (Fs) of −9.1 ng m−2s−1 for daytime, the inclusion of a silique-layer into the model suggests that the deposition to the leaf stomata of −4.4 ng m−2s−1 is more than balanced by the emis-sion from the silique stomata of 23.3 ng m−2s−1. At night-time stomata are, as expected, inactive, with
small fluxes being induced by some dusk/dawn ef-fects. Surprisingly, the suppression ofΓl during dry daytime conditions as a consequence of Eq. (15) leads to the litter emission flux (Fl) being on an average the same during day and night (about 10 ng m−2s−1); the increased turbulence at daytime, favouring the ground level emission coming through the canopy, and in-creasedTare exactly compensated for by the smaller daytime value ofΓl. IfΓlis kept constant over the day, as in the foliage–litter model, the night-time emission is only 40% of its daytime value. Both models sug-gest that the night-time leaf litter emission is roughly balanced by deposition to leaf water-layers (Fw), with the ratio of the deposition to siliques (Fwq) and leaves (Fwf) in the foliage–litter–silique model being 2:1. The leaf litter emission is mainly captured by the lower leaves, whereas atmospheric deposition takes place to the aerodynamically more exposed siliques.
6. Sensitivity and error analysis
impact of the uncertainty in the main parameters on (i) the stability of the prediction of the net exchange flux (Ft) and (ii) the partitioning of the net flux into com-ponent fluxes. Of interest are here the effects of errors in the emission potentials (Γsf,Γsq andΓl) and the resistances (Rsf, Rsq and total in-canopy resistance, Rac +Rb1), and in particular in the parameters that have been derived from measurements (χa, Ft and T (z′
0)). Sutton et al. (2000b) estimated errors for the individual 10 min values ofχaandFt as 25 and 50%, respectively, while the error of the average should be much smaller. Parameters were varied over a range of typically ∓25% of their original values, and the results were calculated (i) for a constantΓsq =2270 and (ii) by adjustingΓsq for each modification to re-produce the measured net flux (Table 3). Apart from the response to changes inT (z′
0), relative effects on Ftand the ratioFsq/Ftwere always much smaller than the relative change in the parameter investigated, in-dicating that the model is very robust in predicting net emissions and partitioning the flux. Major uncertain-ties inT (z′
0)can be ruled out as heatfluxes were mea-sured simultaneously with several instruments (Sutton et al., 2000b). The contribution of the litter emis-sion to the net emisemis-sion increased most sensitively with increasingΓlas well as with decreasingχaand Rac+Rb1, but variations were within 20%. The mod-ification of a single parameter never led to a marked change with implications for the mechanistic interpre-tation of the results, although it is evident that a 50% uncertainty is associated with the emission potentials (Γl,maxandΓsq) that were derived through fit to the measurements.
7. Discussion
Theχs–Rw model proposed by Sutton and Fowler (1993) has previously been successfully applied to NH3 exchange over wheat, barley, pasture, forest as well as moorland (Sutton and Fowler, 1993; Sutton et al., 1995, 1998; Plantaz, 1998; Wyers and Eris-man, 1998; Flechard et al., 1999). In all these studies the apoplastic concentrations had to be fitted or taken from other studies. At North Berwick, independent direct measurements of apoplastic [NH4+] and pH were carried out by bioassay in the field to enable a more rigorous model assessment.
The NH3 exchange over oilseed rape, however, proved to be more complex than over cereal crops. In addition to the stomata, decomposing litter leaves at the ground surface formed a second major source, which was not controlled by stomatal opening and cannot be dealt with in a 1-layer ‘big leaf’ model; hence the poor model fit of Fig. 3. Emission from leaf stomata is regulated by Γs, the canopy temperature dependent Henry and solubility equilibria (Eq. (9)), as well as the light dependence of Rs. In contrast, emission from the leaf litter depends on Γl, the ground level temperature and the turbulence within the canopy. Whilst Γs was found to be reasonably stable, presumably due to the regulation by the living plant,Γlshowed a large variability and is difficult to measure or predict reliably. The χs–Rw model fails to reproduce the measured flux, because for most of the time the values ofχs are lower thanχa, leading to deposition to the leaves.
For oilseed rape the extraction procedure of the apoplast and the determination of [NH4+] and pH are reasonably well established (Husted and Schjoerring, 1995; Husted et al., 2000) and it is therefore unlikely thatΓswas considerably underestimated. Even when theχs–Rw model was applied with increased values ofΓs (Fig. 3), it overestimated the emission of some days, while at other periods it could not account for a great part of the emission, in particular when stomata were closed at night. Uncertainties in the parametriza-tion of Rs cannot account for flux reversal and can therefore be ruled out as a major uncertainty. The ef-fects of three independent model amendments have been examined: (a) the inclusion of a litter layer (Γl), (b) the inclusion of a silique layer (Γsq) and (c) the effect of ah-dependency ofΓl.
7.1. Leaf litter emission of NH3 and the magnitude ofΓl
measured flux (Fig. 11) are encouraging. The value of Γ1 =13 000 necessary for 9–16 June is nevertheless greater than the largest values estimated from initial bulk tissue measurements. A further uncertainty in the parameterization of the leaf litter emission are the resistancesRacandRb1, both of which might be over-estimated in nights with low turbulence, when free convection can be significant. As supported by the sensitivity analysis (Table 3), a reduction ofRac+Rb1 results in larger average fluxes. However, a systemati-cally differentRac+Rb1would have led to a different choice ofΓl, which was set to an arbitrary value that provided a good model fit to the measured values of Ft over a long time period. Therefore, uncertainties inRac+Rbaffect only the choice ofΓl and not the magnitude of the predicted litter emission flux.
The large value ofΓlrequired for the foliage–litter model results in a large litter flux, a considerable part of which is taken up by the stomata of the foliage-layer (Fig. 8), while the remainder is pre-dicted to escape the canopy and contribute to the measured net emission. This is in contradiction to the source/sink analysis by Nemitz et al. (2000a), which indicated that all NH3emitted by the leaf litter during daytime was re-captured within the lower part of the canopy, with all daytime emission originating from the top of the canopy.
7.2. Ammonia emission from siliques
With the experimental leaf stomatal compensation points (χsf) being smaller than the ambient air con-centration (χa) in the field, the NH3emission from the top layer of the canopy seen in the inverse Lagrangian analysis must have originated from the siliques. The 3-layer model including the silique layer (Fig. 5b) showed good agreement at daytime between measured and modelled flux forΓsq =1260 (Table 1). Unfortu-nately, apoplastic [NH4+] and pH could not be mea-sured for the siliques, but bulk tissue [NH4+] con-centrations measured for different rape plants showed elevated values, typically 2–5 times larger than for rape leaves (Husted et al., 2000). Assuming the same ratio of bulk tissue to apoplastic Γ as observed for leaves, the value of Γsq of 1000–1500 necessary to obtain the measured flux (Table 1) is consistent with the mean value for leaves ofΓsf =390 derived from the data of Husted et al. (2000). With aΓsq of 1260
the foliage–litter–silique model using a constant value ofΓlpredicts half of the daytime net emission to orig-inate from the siliques, whereas the other half results from leaf litter emission penetrating the canopy. Hence the results of the inverse Lagrangian source/sink anal-ysis are only partly reproduced by this 3-layer model.
7.3. Uncertainties and humidity dependence of rape leaf litter NH3emissions
For live leaves the site of NH3 exchange between air and plant tissue is well defined. Living leaves ex-change NH3via the leaf apoplast in the sub-stomatal cavities, which, for oilseed rape, shows a [NH4+] con-centration of typically 18 of the bulk tissue concentra-tion (Husted and Schjoerring, 1996). As the structure of the litter leaves breaks down during the decompo-sition process, it is difficult to identify the leaf com-partments in contact with ambient air and their values of pH and [NH4+]. These values could have differed significantly from the bulk tissue concentrations mea-sured by Husted et al. (2000). Especially at onset of decomposition of organic matter pH values may be locally elevated (Freney et al., 1981) and more de-tailed pH measurements on leaf litter of oilseed rape plants grown in growth cabinets have shown consid-erably higher pH values of 5.6–7 (compared with the bulk values of 5.1–5.4 in this study) at the leaf sur-face (Husted et al., 2000). The emission potential of the leaf litter in terms of the solubility equilibrium could therefore have been significantly higher than es-timated from bulk tissue measurements and values of Γ1 =13 000 as used for the foliage–litter model are quite reasonable.
measure-Fig. 13. NH3 emission from decomposing B. napus leaves at different values of relative humidities as measured with a dynamic chamber under controlled conditions. Preliminary results using a constant temperature of 21.5◦C. The linear regression (solid line)
and 95% limits (dotted lines) are shown together with a best fit line using the relative humidity (h) dependence of Eq. (15), with a constanta=30 (dashed line).
ments clearly show increased litter emissions at ele-vatedh. Since at North Berwick measurements ofΓl were only carried out during daytime, it is likely that night-time values exceeded the measured values.
The fitted values forΓl in Fig. 7 were sufficiently large to cause the night-time emissions observed, but may present overestimates during daytime when Γl decreased with decreasing h. An initial h-dependent formulation of Γl (Eq. (15)) was successfully em-ployed resulting in the prediction of (on an average) the correct night-time emission at the same time as allowing all daytime net emission to originate from the silique stomata (Fig. 9, Table 2). The validity of theh-dependence fitted to the field measurements (Eq. (15)) may be assessed by the preliminary labora-tory results Fig. 13. The sameh dependency may be applied to the chamber flux as in Eq. (15). Theh re-sponse curve according to Eq. (15) anda =30 was re-scaled for a value ofΓl,maxmatching the different type of oilseed rape and the chamber condition. The close fit of the model to the measurement data shown in Fig. 13 provides independent support of the previ-ously used value ofa≈30.
Nemitz et al. (2000a) discuss the temporal vari-ability of Γl and present first results obtained with a dynamic model that predictsΓl as a result of the
changing volume of the leaf tissue water as well as the competing processes of nitrification, mineraliza-tion and NH3 emission. The values ofχl that would be in equilibrium with this modelled estimate ofΓl agrees with the air concentrations measured 0.05 m above the ground much more closely than when using a constant value ofΓl. Clearly, more controlled mea-surements are needed to develop a sound mechanis-tic understanding of the processes governingΓl, and eventually to provide parameterizations which could be used in generalized models.
7.4. Chemical conversions within the plant canopy
Chemical conversions, such as the reaction of NH3 with nitric acid (HNO3) and hydrochloric acid (HCl) or the evaporation of the associated ammonium salts (NH4NO3 and NH4Cl, respectively), can potentially provide sources and sinks of NH3within the canopy, which are not accounted for in resistance modelling. Nemitz et al. (2000b) investigated the surface ex-change of these additional species and estimated the importance of chemical conversions at North Berwick. It was concluded that, although the aerosol concentration was estimated too low to cause signifi-cant gas-to-particle conversion above the canopy, the much lower turbulence within the canopy may have provided enough time for chemical conversions to occur. This would have provided an additional NH3 sink within the canopy, which Nemitz et al. (2000b) estimate to be small with an absolute upper limit of 25% of the NH3flux measured.
8. Conclusions
governed by χs. Using the apoplastic estimates of foliar χs the measured net emission is substantially underestimated by the models and night-time emis-sion is not accounted for at all. In order to explain the measured net fluxes required either (a) litter emis-sions and/or (b) silique emisemis-sions. This finding has important consequences for both transport modelling and emission estimates. Ammonia volatilization from decomposing plant parts may be responsible for in-creases in atmospheric concentrations of NH3 some-times observed in autumn (e.g. Horváth and Sutton, 1998). More work is currently needed to quantify litter emission and to relate these to meteorological param-eters such as relative humidity (h) and temperature.
It can be concluded that for the NH3 fluxes mea-sured above the oilseed rape at North Berwick: (a) live leaves were a net sink as leaf compensation points were smaller than air concentrations; (b) daytime net emissions of NH3 were expected to be dominated by siliques; (c) emissions from decomposing litter leaves may have contributed to daytime net emissions, but certainly dominated any night-time emissions due to increased relative humidities and high stomatal resis-tances; (d) night-time net NH3emissions occurred dur-ing periods of increased atmospheric turbulence, when the ground surface NH3 emissions could escape the canopy; (e) during calm night-time periods, very high relative humidities may have promoted increased lit-ter emission, but this was generally recaptured by the overlaying canopy, allowing net NH3deposition to the canopy.
A foliage–litter–silique resistance model (Fig. 5b) with an h-dependent emission potential from the lit-ter leaves may be used to quantify each of these ef-fects and predict net fluxes. Nevertheless, although not fully consistent with the inverse Lagrangian analysis of fluxes within the canopy, a simpler foliage–litter model can be applied to model net fluxes above the canopy satisfactorily. While the 3-layer model provides the better mechanistic representation of the exchange pro-cess, it may be concluded that the 2-layer foliage–litter model provides a simplified generalized approach for application to atmospheric transport models.
Acknowledgements
The authors are grateful for financial support through the EU projects ‘EXAMINE’
(EV5V-CT94-0426) and ‘GRAMINAE’ (CT98-0722) as well as from the UK Department of the Environment (con-tracts EPG 1/3/28 and 1/3/94). We are also indebted to Mr. J. Grant-Suttie for access to his field as well as to our colleagues at CEH Edinburgh, in-cluding Ms. C. Milford, Dr. K.J. Hargreaves, Mr. F. Harvey and Dr. P.W. Hill for help with the experiments.
Appendix A. Mathematical solution of the foliage–litter model
Networks of atmospheric resistances are solved by analogy to electrical circuit networks. The governing equations are Eq. (1) and the first Kirchhoff law, which states that the net flux at each junction point equals the sum of the component fluxes. In the case of the foliage–litter model (Fig. 5a), the values of the con-centrationsχa,χs andχl and of all resistances are prescribed, whereas the fluxes (Ft,Fs,Fw,Ff,Fl) and the concentrationsχcandχ(z0) form seven unknowns. These can be determined from the solution of an equal number of independent linear relationships, which can be identified as
χc= then be calculated using Eqs. (A.1)–(A.7). The param-eters of the 3-layer foliage–litter–silique model can be solved similarly by solving 13 governing equations.
References
Adema, E.H., Heeres, P., 1995. Dry deposition of sulphur dioxide and ammonia on wet surfaces and the surface oxidation kinetics of bisulphite. Atmos. Environ. 29, 1091–1103.
Asman, W.A.H., Van Jaarsveld, J.A., 1992. A variable-resolution transport model applied for NHx for Europe. Atmos. Environ. 26, 445–464.
Baldocchi, D., 1988. A multi-layer model for estimating sulfur dioxide deposition to a deciduous oak forest canopy. Atmos. Environ. 22, 869–884.
Baldocchi, D.D., Hicks, B.B., Camara, P., 1987. A canopy stomatal resistance model for gaseous deposition to vegetated surfaces. Atmos. Environ. 21, 91–101.
Barrett, K., Berge, E., 1996. Transboundary air pollution in Europe. Part 1. Estimated dispersion of acidifying agents and of near surface ozone. EMEP/MSC-W Report 1/96. Norwegian Meteorological Institute, Blindern, Norway.
Cape, J.N., 1996. Surface wetness and pollutant deposition. In: Kerstiens, G. (Ed.), Plant Cuticles: An Integrated Functional Approach.bios Scientific Publishers, Oxford, UK, 337 pp. Erisman, J.W., Van Pul, A., Wyers, P., 1994. Parameterization
of surface resistance for the quantification of atmospheric deposition of acidifying pollutants and ozone. Atmos. Environ. 28, 2595–2607.
Farquhar, G.D., Firth, P.M., Wetselaar, R., Weir, B., 1980. On the gaseous exchange of ammonia between leaves and the environment: determination of the ammonia compensation point. Plant Physiol. 66, 710–714.
Flechard, C.R., Fowler, D., Sutton, M.A., Cape, J.N., 1999. A dynamic model of bi-directional ammonia exchange between semi-natural vegetation and the atmosphere. Quart. J. R. Meteorol. Soc. 125, 2611–2641.
Fowler, D., Cape, J.N., Unsworth, M.H., 1989. Deposition of atmospheric pollutants on forest. Phil. Trans. R. Soc. London B 324, 247–265.
Freney, J.R., Simpson, J.R., Denmead, O.T., 1981. Ammonia volatilization. In: Clark, F.E., Sinhu, U. (Eds.), Terrestrial Nitrogen Cycles. Ecol. Bull. 33, 291–302.
Gammelvind, L.H., Schjoerring, J.K., Mogensen, V.O., Jensen, C.R., Bock, J.G.H., 1996. Photosynthesis in leaves and siliques of winter oilseed rape (Brassica napus L.). Plant Soil 186, 227–236.
Hicks, B.B., Baldocchi, D.D., Meyers, T.P., Hosker Jr., R.P., Matt, D.R., 1987. A preliminary multiple resistance routine for deriving dry deposition velocities from measured quantities. Water Air Soil Pollut. 36, 311–330.
Horváth, L., Sutton, M.A., 1998. Long-term record of ammonia and ammonium concentrations at K-puszta, Hungary. Atmos. Environ. 32 (3), 339–344.
Husted, S., Schjoerring, J.K., 1995. Apoplastic pH and ammonium concentrations in leaves ofBrassica napusL. Plant Physiol. 109, 1453–1460.
Husted, S., Schjoerring, J.K., 1996. Ammonia flux between oilseed rape plants and the atmosphere in response to changes in leaf temperature, light intensity and air humidity. Plant Physiol. 112, 67–74.
Husted, S., Schjoerring, J.K., Nielsen, K.H., Nemitz, E., Sutton, M.A., 2000. Stomatal compensation points for ammonia in oilseed rape plants under field conditions. Agric. For. Meteorol. 105, 371–383.
Jarvis, P.G., 1976. The interpretation of the variations in leaf water potential and stomatal conductance found in canopies in the field. Phil. Trans. R. Soc. London B 273, 593–610.
Jensen, C.R., Morgensen, V.O., Mortensen, G., Andersen, M.N., Schjoerring, J.K., Thage, J.H., Koribidis, J., 1996. Leaf photosynthesis and drought adaptation in field-grown oilseed rape (Brassica napusL.). Aust. J. Plant Physiol. 23, 631–644. Monteith, J.L., Unsworth, M.H., 1990. Principles of Environmental
Physics, 2nd Edition. Arnold Press, London, 291 pp. Nemitz, E., Sutton, M.A., Gut, A., San José, R., Husted, S.,
Schjoerring, J.K., 2000a. Sources and sinks of ammonia within an oilseed rape canopy. Agric. For. Meteorol. 105, 385–404. Nemitz, E., Sutton, M.A., Wyers, G.P., Otjes, R.P., Schjoerring,
J.K., Gallagher, M.W., Parrington, J., Fowler, D., Choularton, T.W., 2000b. Surface/atmosphere exchange and chemical interactions of gases and aerosol over oilseed rape. Agric. For. Meteorol. 105, 427–445.
Pearson, J., Stewart, G.R., 1993. The deposition of atmospheric ammonia and its effect on plants (Tansley Review No. 56). New Phytologist 125, 283–305.
Plantaz, M.A.H.G., 1998. Surface/atmosphere exchange of ammonia over grazed pasture. Ph.D. Thesis. Agricultural University, Wageningen, the Netherlands, 199 pp.
Raupach, M.R., 1989. Applying Lagrangian fluid mechanics to infer scalar source distributions from concentration profiles in plant canopies. Agric. For. Meteorol. 47, 85–108.
Schuepp, P.H., 1977. Turbulent transfer at the ground: on verification of a simple predictive model. Boundary-Layer Meteorol. 12, 171–186.
Schuepp, P.H., 1993. Leaf boundary layers (Transley Review No. 59). New Phytol. 125, 477–507.
Shuttleworth, W.J., Wallace, J.S., 1985. Evaporation from sparse crop — an energy combination theory. Quart. J. R. Meteorol. Soc. 111 (469), 839–855.
Sorteberg, A., Hov, Ø., 1996. Two parameterizations of the dry deposition exchange for SO2 and NH3 in a numerical model. Atmos. Environ. 30, 1823–1840.
the WMO Conference on the Measurement and Modelling of Atmospheric Composition Changes Including Pollution Transport. Sofia, Bulgaria, October 4–8, 1993. WMO/GAW 91. WMO, Geneva, pp. 179–182.
Sutton, M.A., Fowler, D., Moncrieff, J.B., 1993. The exchange of atmospheric ammonia with vegetated surfaces. I. Unfertilized vegetation. Quart. J. R. Meteorol. Soc. 119, 1023–1045. Sutton, M.A., Asman, W.A.H., Schjoerring, J.K., 1994. Dry
deposition of reduced nitrogen. Tellus 46B, 255–273. Sutton, M.A., Schjoerring, J.K., Wyers, G.P.,
1995. Plant–atmosphere exchange of ammonia. Phil. Trans. R. Soc. London, Ser. A 351, 261–278.
Sutton, M.A., Burkhardt, J.K., Guerin, D., Nemitz, E., Fowler, D., 1998. Development of resistance models to describe measurements of bi-directional ammonia surface atmosphere exchange. Atmos. Environ. 32 (3), 473–480.
Sutton, M.A., Nemitz, E., Fowler, D., Wyers, G.P., Otjes, R.P., Schjoerring, J.K., Husted, S., Nielsen, K.H., San José, R., Moreno, J., Gallagher, M.W., Gut, A., 2000a. Fluxes of ammonia over oilseed rape: overview of the EXAMINE experiment. Agric. For. Meteorol. 105, 327–349.
Sutton, M.A., Nemitz, E., Fowler, D., San José, R., Moreno, J., Wyers, G.P., 2000b. Micrometeorological measurements of
ammonia fluxes over oilseed rape during two vegetation periods. Agric. For. Meteorol. 105, 351–369.
Van Breemen, N., Van Dijk, H.F.G., 1988. Ecosystem effects of atmospheric deposition of nitrogen in the Netherlands. Environ. Pollut. 54, 249–274.
Van Hove, L.W.A., Adema, E.H., 1996. The effective thickness of water films on leaves (Short communication). Atmos. Environ. 30, 2933–2936.
Van Hove, L.W.A., Adema, E.H., Vredenberg, W.J., Pieters, G.A., 1989. A study of the adsorption of NH3 and SO2 on leaf surfaces. Atmos. Environ. 23, 1479–1486.
Walmsley, J.L., Wesley, M.L., 1996. Technical note. Modification of coded parameterizations of surface resistances to gaseous dry deposition. Atmos. Environ. 30, 1181–1188.
Wesley, M.L., 1989. Parameterization of surface resistances to gaseous dry deposition in regional-scale numerical models. Atmos. Environ. 23, 1293–1304.
Wyers, G.P., Erisman, J.W., 1998. Ammonia exchange over coniferous forest. Atmos. Environ. 32 (3), 441–451.
![Fig. 3. Example results of the application of the 1-layer χs–Rw model to measurement data from North Berwick for 10–13 June 1995.The measured flux (Ft) is shown together with the modelled fluxes for a measured apoplastic ratio [NH4+]/[H+] (Γ s) of 390 and an](https://thumb-ap.123doks.com/thumbv2/123dok/3167786.1387312/5.612.74.286.449.602/example-application-measurement-berwick-measured-modelled-measured-apoplastic.webp)
![Fig. 7. Time series of the values of the ratio Γ = [NH4+]/[H+] of both living (Γ s) and litter (Γ l) leaves as measured and as used for thefoliage–litter-model for 6–26 June 1995](https://thumb-ap.123doks.com/thumbv2/123dok/3167786.1387312/9.612.146.452.65.237/series-values-living-litter-leaves-measured-thefoliage-litter.webp)
![Fig. 9. The foliage–litter–silique model applied to the example period of Fig. 3 (10–13 June 1995), using experimental values of the foliar[NH4+]/[H+] ratio (Γ sf), a value of 1500 for the siliques (Γ sq) and for the litter (Γ l) according to Eq](https://thumb-ap.123doks.com/thumbv2/123dok/3167786.1387312/11.612.121.481.66.329/foliage-litter-silique-applied-example-experimental-siliques-according.webp)