AUTOMATIC ORIENTATION OF IMAGE SEQUENCES IN CULTURAL HERITAGE
S. Del Pizzo a , S. Troisi a
a
University of Naples “Parthenope”, Dept- of Applied Science, 80143 Naples, Italy - (silvio.delpizzo,
salvatore.troisi)@uniparthenope.it
COMMISSION V, WG V/4
KEY WORDS: Automation, Orientation, Matching
ABSTRACT: The modeling and the three-dimensional reconstruction of objects, structures or sites of interest assume an important role in the field of cultural heritage. Making copies of virtual objects is very significant for their consultation, storage, disclosure and restoration. Nowadays the modeling of a free-form object can be attained both by laser-scanning and by digital photogrammetry. With the use of the last methodology dense point clouds can be obtained through elaborate process steps. The purpose of this study is to provide input to the automation of some phases of these processes. Recent advances in the Structure from Motion community have greatly extended the feature matching and triangulation capabilities to enable significantly larger datasets to be used for the reconstruction of the relative orientation of the cameras and, consequently, of the artefacts.
In this paper a methodology to automatically orient a set of images is presented, such methodology makes use of algorithms for feature extraction coming from computer vision community and allows to easily recognize a large amount of homologous points on a set of images in a completely automatic way.
The above said methodology has been adopted for the automatic orienting of some sequences of images relative to several interesting sites from the perspective of cultural heritage.
1. INTRODUCTION
The introduction of digital 3D modeling in the Cultural Heritage field gives to users the possibility to use 3D models as highly effective and intuitive means of communication as well as interface to share and visualize information collected in databases can be used for virtual tours, for digital storage, or as an aid to restoration operations.
It is well known that the reconstruction and three-dimensional modeling may be achieved by either active optical sensors, such as laser scanner, or by using the image-based modeling techniques (mainly photogrammetry and computer vision) that are generally preferred in cases of low-budget project.
The active sensors speed up the modeling process by directly delivering 3D information in form of unstructured point clouds by means of range measurements. On the other hand, the use of passive sensors allows to obtain, at the conclusion of the survey, a set of digital images that will be elaborated in a post-processing phase to obtain three-dimensional measurements on the model, whose generation does not appear to be trivial, especially in terrestrial photogrammetry, where the optical axes can be, in most of case, convergent.
Although active sensors enable the measurement and modeling in a short time they have limitations such as cost, size, portability; moreover, the three-dimensional modeling in the field of cultural heritage is often performed by image-based techniques becuase with translucent materials, such as some types of marble, the active sensors do not respond adequately (Guidi et al, 2010). On the other hand image-based modeling techniques are applicable also with low-cost digital camera, that are space-saving and transportable.
One of the basic steps that allows the transition from 2D measurements (on images) to 3D measurements (on the model) is the orientation of the images.
The accuracy of the orientation parameters affects the reliability of the model; the reconstruction of images exterior orientation
is performed by identifying an adequate number of tie-points well distributed in the areas of overlapping images.
The use of coded targets that are applied on the object or in the neighbourhood allows the automatic or semi-automatic identification of tie-points with a sub-pixel accuracy. In the cases where coded targets can not be used the recognition of the tie-points is entrusted entirely to the operator; this operation is very costly in terms of work, especially when the number of images is conspicuous.
Recent advances in the Structure from Motion promote the application of some methodologies to extract a comfortable number of tie-points automatically, with no targets, but using the texture of the object; this is made possible by the use of extraction algorithms known as a blob-detectors that recognize homologous (matching) points in a pair of images that depict the same scene. The use of a robust algorithm is indispensable to identify any false match (outlier) and to estimate the epipolar geometry (Zuliani, 2006).
The extraction of tie-points is performed by using computers-vision algorithms, while the classical and robust photogrammetric algorithm of Bundle Block Adjustment is used for the estimation of cameras exterior orientations.
The procedure for the extraction of tie-points has been implemented in a software called AutOrIm (Automatic Orienting Images) which provides the opportunity to export the tie-points to some well-known photogrammetric software to take advantage of their robust bundle adjustment algorithms to establish the orientation parameters of the images.
The knowledge of such orientation parameters allow the determination of dense cloud of points, by using software such as PMVS2, CLORAMA, or modules NGATE and ATE of SOCET SET suite, that use multi-image matching algorithms (Barazzetti et al. 2010, Menna et al. 2007, Remondino et al. 2006).
2. DESCRIPTION OF THE PROPOSED METHODOLOGY
2.1 Prerequisite
A photographic lens, especially those ones used in the amateur cameras, is far different from the ideal perspective centre, so the image produced on the sensor appears deformed compared to the ideal pinhole camera; it is therefore necessary to know a priori the values of such distortion.
Before (and/or after) any photogrammetric survey is essential the determination of the coefficients of polynomials that shape distortions caused by lens, through a process known as camera calibration (Brown 1971, Remondino et al. 2006)..
The knowledge of the calibration parameters (interior orientation) permits to produce images without distortion called ideal (Figure 1) which meet more or less faithfully to the model of the pinhole camera; otherwise it is possible take into account the distortion coefficients and interior orientation parameters in the Bundle Block Adjustment.
In the case of the parameters of interior orientation are unknown they can be estimated using a calibration on the job, if the placement of the tie-points automatically extracted, their number and multiplicity are adequate.
Figure 1. On the left the original image belonging to the Piazza Navona datasets, on the right the idealized image.
2.2 AutOrIm approach
The methodology developed in AutOrIm can be summarized as follows:
• Choice of the images and type of block;
• Extraction of specific features from images and matching operations;
• Determination of outliers;
• Labeling and reduction of tie-points;
• Export of tie-points in PhotoModeler commercial software. The software was implemented almost entirely in MATLAB environment; the export of tie-points and relative label in Photomodeler have been employed by using the interprocess communication protocol, known as DDE.
2.2.1 Selection of images and type of block
Features extraction algorithms are able to recognize a set of correspondences in a pair of images, therefore it becomes necessary to determine the pairs of images owing overlaps. The image dataset to be imported into the software can be ordered or not. Usually, in the design phase of a photogrammetric survey the number and the sequence of images are determined in order to have a network configuration that allow accurate three-dimensional reconstruction, but in the case of unexpected obstacles or obstructions is not possible to faithfully fulfill the plan.
When the user is able to distinguish the configuration of the block of images he can, with the help of a GUI, manually
rebuild the order of the sequence they were taken during the survey.
If the images are not ordered and the user can not reconstruct an ordered sequence, he can use a tool, called Autograph, that is present in AutOrIm.
The pairs of images needed for three-dimensional reconstruction can be represented by a graph whose vertices are the images and the edges are the pairs.
When the sequence of images is ordered, the graph takes a particular form; the images will be paired with consecutive triplets. The edges of the graph connect two consecutive images and the alternate ones as well. The figure 2 shows two possible graphs that are formed when the ordered sets of images is closed (a) and open (b). In the first case only 2n pairs will be produced, 2n-3 in the second.
(a) (b) Figure 2. The vertices of the graph (red circles) are the n images, the
edges (arcs in blue) shows the pair that subsist between the images: (a) closed graph, (b) open graph.
Autograph is an algorithm designed to automatically determine the scheme of the image sequence, in fact, when the unordered sequence of images is given as input it allows to obtain the graph of the output pairing (Figure 3 a) and the overlapping area existing between each pair of images (Figure 3 b).
(a)
(b)
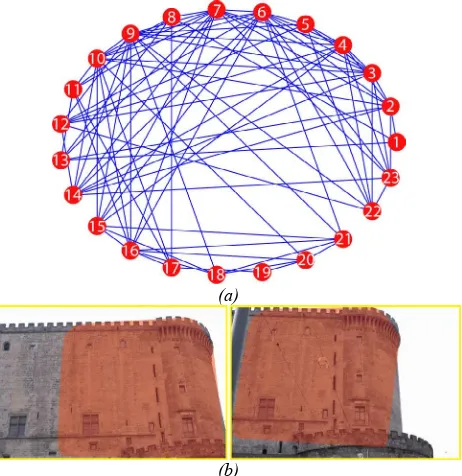
Figure 3. In (a) the graph built with Autograph, (b) shows an example of overlapping areas.
Autograph uses all possible pairs for the images suitably downsampled and determines the fundamental matrix for all pairs: in this way areas of approximated overlap on which perform the matching between the original images can be determined.
Of course, not all pairs have overlap, or some pairs may have negligible overlaps. The decision relative to which pairs of images may be used is performed on the base of the percentage of overlapping area and of the number of keypoints: these two parameters are hence stored.
The pairs are then sorted by the value of the product of the number of keypoints for the percentage of overlap: all the pairs that have a value below a certain threshold (Fig. 4) (selected by the user) will be excluded from successive analysis.
Figure 4 – Only 132 of 253 pair exceed the threshold.
Autograph implements, for low resolution images, all of the following steps.
2.2.2 Extraction of specific features from images and matching operations
The recent development of algorithms for feature extraction classified as blob detectors or region detector consent to extract from a generic image specific features called keypoints and a vector of descriptors associated with them, which express the trend of the gradient in the surrounding area (Brown et. al, 2007; Bay et al., 2006)..
The descriptors allow to automatically determine a set of correspondences between a pair of images even when the epipolar geometry is unknown.
In Autorim the determination of keypoints was performed with the SIFT (Scale Invariant Feature Transform) algorithm (Lowe, 2004).
The available free version of SIFT code does not permit the direct processing of high-resolution images.
The problem can be solved in two ways: by applying the SIFT code for the images resampled to a lower resolution, or by splitting the original image into portions and processing each partition.
In the approach proposed in this paper the splitting option is preferred and applied, for two main reasons: the sum of computation time on the portions is much smaller than a single process on the entire image, while the number of keypoints extracted is only slightly lower (Del Pizzo et al., 2011).
Homologous points are found by comparing the descriptors of the extracted keypoints for the two images of the pair and by subjecting the found matches to a significance test.
The computational complexity of this approach is very high O(n2). To get a better performance from computational point of view more efficient algorithms can be used to search for the nearest neighbor (Muja and Lowe, 2009).
The kd-tree algorithm has shown excellent performance and has therefore been used extensively by many research groups, (Barazzetti et al, 2010; Farenzena et al., 2009).
Alternatively, we can reduce the number of keypoints to be compared by taking into account only those ones that fall within the area of overlap between the pair of images. This area is automatically determined by Autograph, that allows to extend it by setting up a buffer in pixels.
The matching operations are carried out between the matching pairs in the adjacency matrix of the graph identified in the first phase of the algorithm.
2.2.3 Determination of outliers
Within the set of formed correspondences some mismatches can be still present. The identification of these mismatch is performed using a series of robust estimators of the fundamental matrix as the Least Median Square, the RANSAC, the MSAC (Fischler et al., 1981; Torr et al., 2000; Zuliani 2006).
The fundamental matrix expresses the classical coplanarity condition existing in the relative orientation between two images (Mikhail et al. 2001).
Robust estimators consent to identify any pair of points which do not comply the used geometric model, classifying them as outliers, as a consequence the remaining set of correspondences is used to estimate the best epipolar geometry (Hartley et al. 2004 ).
2.2.4 Labelling and reduction of tie-points
So far only the pairs of images have been considered, but the final model will be built with the entire set of images.
So the next step is the concatenation of the pairs of images according to the scheme imposed by the graph in order to obtain a single block.
Through an algorithm developed for the labeling, it is possible to concatenate all the pairs formed; a series of checks on the assigned label consents to propagate the featured match even to images between which no comparison was made, thereby increasing the repeatability of the extracted tie-points.
The large number of points extracted by the SIFT operator, can produce a huge number of tie-points on the images; such circumstance could make hard the bundle block adjustment process. Moreover some software, such as PhotoModeler, can not handle huge amounts of points, it is therefore necessary to reduce their number.
The removal of part of the tie-points is a very delicate operation because it can influence the accuracy of the Bundle; two different strategies have been implemented:
1) The first strategy, rougher, involves cutting the match, after the phase of outliers determination, to a given numerosity for each pair, removing the matches classified as weak. 2) The second strategy, more refined, involves cutting the
match depending on the multiplicity of the points, intended as the number of images in which the point appears, encouraging the points have a greater multiplicity.
The second approach is preferred to the first one, in fact the use of points with multiplicity greater than two can detect, through the use of robust bundle adjustment algorithm, some mismatches that can be still present. As robust estimators work International Archives of the Photogrammetry, Remote Sensing and Spatial Information Sciences, Volume XXXVIII-5/W16, 2011
on pairs of images, it can happen, that an outliers will not be rejected. These cases often manifest themselves when repetitive elements of the texture occur along the epipolar line.
2.2.5 Export of extracted tie-points in PhotoModeler
All tie-points found are organized into tables that are associated with the images, they can be exported to an ascii file or, through the DDE communication protocol, in Phomodeler environment (Giersch, 2001). Through this communication protocol is possible, in addition to the export of the tie-points, also provide other instructions, such as, for example, the interior orientation parameter or the start to the bundle process.
3. EXPERIMENTS AND RESULTS
The developed algorithms have been tested with several datasets of images. The artifact surveyed are different for typology: there are either building and free-form objects. For every dataset are shown the achieved results: it is analyzed the exterior orientation and the statistical parameters on the 3D computed points. For some dataset the availability of the ground control points consents to estimate the reliability of the proposed approach and algorithm.
Some datasets are taken from the website
http://cvlab.epfl.ch/~strecha/multiview/knownInternalsMVS.html
(Strecha et al., 2008).
3.1 Fountain -K6
This dataset is composed by six images, acquired with a digital camera Canon D60, the approximate information relative to the camera parameters were taken from the website (www.dpreview.com). The number of tie-points and their disposition permitted to use the self-calibration algorithm. The figure 6 shows the results of Bundle process, that produced 1356 3D points with a maximum residual of 0.78 pixel.
Figure 5: The Fountain-K6 image dataset.
Figure 6: Result for Fountain-K6 image dataset orientation.
Fountain-K6 dataset
n° images 3D points RMS (px) σ0
6 1356 0.126 0.151
Table 1: Statistical results for Fountain-K6 image dataset.
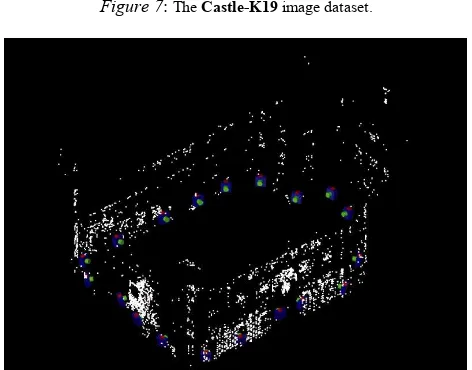
3.2 Castle-K19
This dataset is composed by nineteen images (figure 7), acquired with Canon D60, it was used the same camera parameters found from self-calibration performed with the Fountain-K6 images. The images are ordered and the strip is closed. The results achieved are shown in the figure 8 and in the table 2.
Figure 7: The Castle-K19 image dataset.
Figure 8: Result for Castle-K19 image dataset orientation.
Castle-K19 dataset
n° images 3D points RMS (px) σ0
19 3115 0.277 0.288 Table 2: Statistical results for Castle-K19 image dataset.
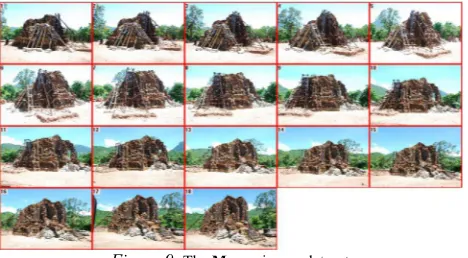
3.3 Myson
The data set of images was acquired with a calibrated Nikon D80 camera (10Mpx), and consists of a sequence of 18 ordered images (figure 9).
The availability of some control points permits to establish the absolute orientation of the model and the accuracy of the 3D coordinates.
Figure 10 shows the orientation result, in the table 3 some statistical data and the residuals on GCPs are reported. The maximum residual on the set of GCPs used is evidenced, it is smaller than one cm.
Figure 9: The Myson image dataset.
Figure 10: Result for Myson image dataset orientation.
Myson dataset n°
images 3D points RMS (px) σ0
18 6955 0.265 0.333
GCP Residual X (m)
Residual Y (m)
Residual Z (m)
32 0,0023 0,0005 0,0016
33 0,0033 0,0028 0,0012
34 0,0030 0,0089 0,0015
36 0,0002 0,0008 0,0001
42 0,0000 0,0000 0,0000
43 0,0004 0,0055 0,0011
44 0,0037 0,0072 0,0003
45 0,0005 0,0005 0,0010
Table 3: Statistical results for Myson image dataset.
These first three datasets are characterized by a small number of images, and easy strip configurations.
3.4 Piazza Navona
This dataset present a large number of ordered images (92), that form a closed strip. The images was acquired with the compact camera Samsung ST45. Since the resolution is very high (12Mpx), the keypoints extraction’s phase has been longer than the other set. A first test was performed using the Autograph algorithm but the results were not satisfactory: the pairs automatically selected in the graph are not able to orient the entire sequence because many repetitive elements are present in the images.
Therefore a significant number of tie-points have been extracted for pairs of images that have a not true overlap.
An example is shown in Figure 11 where the images have a very small overlapping area but the algorithm recognizes 19 matches and a not negligible percentage for the overlap between the two images.
The matches for such 19 points produce a fundamental matrix completely wrong that affect the result of the Bundle Block Adjustment process for the entire image dataset.
Figure 11: The repetitive texture can produce false matches and a not real overlapping area.
The second test was carried out considering the dataset as ordered and closed. The results are shown in figure 12 and in table 4. In figure 13 the result of orientation can be seen superimposed to an image derived from Google Earth, the 3D points are colored in red, the cameras in blue.
Figure 12: Result for Piazza Navona image dataset orientation.
Piazza Navona dataset
n° images 3D points RMS (px) σ0
92 2922 0.429 0.417 Table 4: Statistical results for Piazza Navona image dataset.
Figure 13: Result for Piazza Navona dataset orientation on a Google Earth image, the 3D points are colored in red, the cameras in blue.
3.5 Ospina Dolmen
Many local historians write that the area of Salento was once very rich in prehistoric evidences, such as dolmens and menhirs.
Neglect, anthropic expansion and vandalism have been such that today only a few megalithic monuments are visited. International Archives of the Photogrammetry, Remote Sensing and Spatial Information Sciences, Volume XXXVIII-5/W16, 2011
Despite the ongoing census Dolmen "Ospina" was discovered by the Superintendence of Cultural Heritage only in recent ‘60s. Located on the edge of a dry stone wall of a farm in "Li Specchi" in the town of Racale (LE).
These monuments were erected at the end of the Bronze Age, in particular the Dolmen "Ospina" has a quadrangular shape, it was erected for funerary purposes (Cortese, 2010). In past years the Dolmen was the subject of vandalism that have reduced the cover plate in several pieces.
The photogrammetric survey of this ancient monument, was performed by using 51 ordered images taken with a compact Canon PowerShot A550 camera.
The presence of a particular texture on the calcareous stones of the dolmen (figure 14 a) led to a huge number of keypoints extracted from SIFT algorithm (figure 14 b), so the matching operations required a very long time (about 1 hour per pair).
(a) (b) Figure 14: (a) shows an image of the Ospina Dolmen, (b) the SIFT
keypoints on the same image.
In figure 14b it can be noted the effect of the splitting on the images: some of the keypoints have been missed along the subdivision lines.
In figure 15 the tie-points having multiplicity four or greater are reported.
Figure 15: Tie-points with multiplicity four on the first image of the datset.
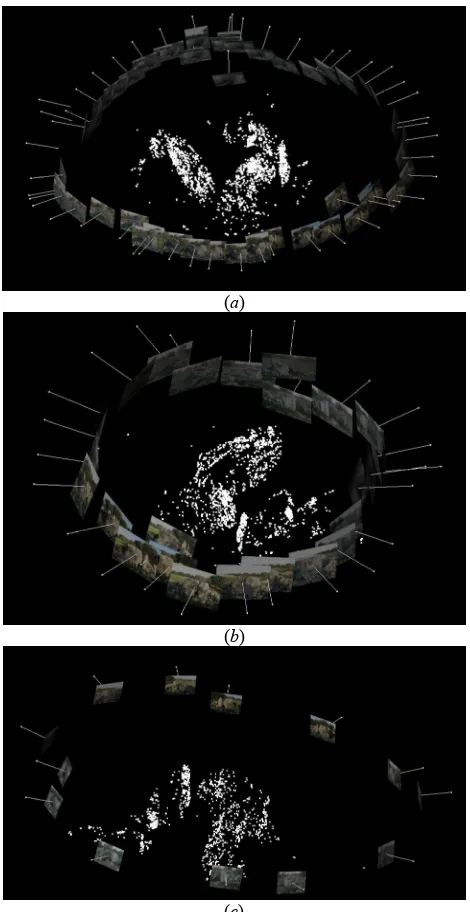
The automatic orienting has been performed on the entire dataset (figure 16a), but we also tested the effect on the quality of the orientation by using a number of images reduced of 50% (figure 16b) and even of 75% (figure 16c). The statistical results are reported in table 5.
Ospina Dolmen dataset
n° images 3D points RMS (px) σ0
51 2773 0.299 0.260
26 2257 0.215 0.212
13 1127 0.175 0.247
Table 5: Statistical results for the three Dolmen image datasets.
(a)
(b)
(c)
Figure 16: Result for Ospina Dolmen image datasets orientation.
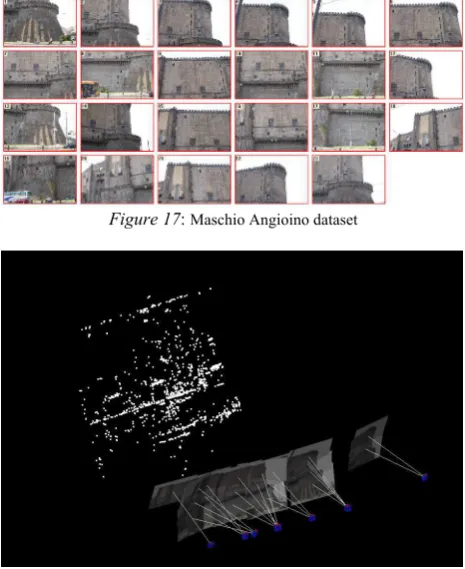
3.6 Maschio Angioino
The well-known Castle of Maschio Angioino in Naples has been used as subject of a photogrammetric survey to analyze the performances of the Autograph algorithm. The dataset is composed by 23 unordered images taken with a Nikon D100 calibrated camera (figure 17). The Autograph tool performed all the matches between the 253 pairs of images; only 132 pairs exceeded the selected threshold (figure 4).
To reduce the number of tie-points to export in Photomodeler only those ones with a multiplicity 4 or greater were selected. Table 6 and figure 18 show respectively the statistical results for the image dataset and the relative 3D view.
Maschio Angioino dataset
n° images 3D points RMS (px) σ0
23 1263 0.239 0.193 Table 6: Statistical results for Maschio Angioino dataset.
Figure 17: Maschio Angioino dataset
Figure 18: Results for Maschio Angioino dataset orientation
4. CONCLUSION
The procedure described in this paper consents to orient different dataset of images in a completely automatically way. The integration of techniques and algorithms of computer vision and photogrammetry proves to be an effective tool for automatic image-based three-dimensional reconstruction. The recent algorithms developed in the field of Computer Vision allow the determination of a large number of keypoints in an image and of an equally large number of matches between a pair of images. The successive use of robust estimators, as the RANSAC or the MSAC, consent to recognize the possible outliers still existing in the matching dataset previously determined and to estimate the best epipolar geometry for the pair of images.
Although the fundamental matrix filter does an excellent job of removing false matches, in some cases, they occur which are consistent with the estimated fundamental matrix of the image pair. These cases often manifest themselves when repetitive elements of the texture occur along the epipolar line.
Through the use of robust bundle adjustment algorithms the matches found enable to determine the orientation of the images, and to identify any remaining outliers.
To facilitate the identification of such mismatches it is advisable to use tie-points that have an high multiplicity. In this way the decreasing of the total number of tie-points for the entire image dataset is obtained: this is a further advantage when the Bundle Adjustment process is performed by software that show some limitations in memory management.
The software AutOrIm presented in this work can use either ordered or unordered dataset of images. In particular, the use of the tool Autograph allows not only to automatically determine the graph of correspondences, but can increase the possibility to achieve tie-points with high multiplicity and, at the same time, to decrease the computation time.
The use of a communication protocol called DDE (Dynamic Data Exchange) make possible to establish a communication
between the MATLAB programming environment, in which the procedure for determination of the tie-points was implemented, and the Photomodeler commercial software where the Bundle Adjustment process can be performed.
5. REFERENCES
References from Journals:
Bay H., Tuytelaars T. and Van Gool L., (2006). "SURF: Speeded Up Robust Features". Proceedings of the 9th European Conference on Computer Vision, Springer LNCS volume 3951, part 1. pp. 404–417.
Brown, D.C., 1971. Close-Range Camera Calibration, Photogrammetric Engineering, Vol.37, No. 8, pp.855-866.
Brown M., Lowe D.G., 2007. Automatic panoramic image stitching using invariant features. International Journal of Computer Vision, 74, 1, pp. 59-73.
Del Pizzo S., Troisi S., 2011 (in press). Estrazione di punti omologhi per l’orientamento automatico di sequenze di immagini. Bollettino della Società Italiana Di Fotogrammetria e Topografia.
Fischler M. A. and Bolles R. C., 1981. Random Sample Consensus: A Paradigm for Model Fitting with Applications to Image Analysis and Automated Cartography . Comunication of the ACM, 24(6), pp. 381-395.
Lowe D. G., 2004. Distinctive image features from scale-invariant keypoints, International Journal of Computer Vision, 60, (2), pp. 91-110.
Remondino, F., Fraser, C.S., 2006. Digital camera calibration methods: consideration and comparisons. International Archives of Photogrammetry, Remote Sensing and Spatial Information Sciences, Vol. XXXVI, part 5, pp. 266-272.
References from Books:
Cortese S., 2010. Nei borghi dei Tolomei. Formazione e caratteristiche dei centri antichi di Racale, Alliste e Felline, CRSEC Le/46 Casarano.
Guidi G., Russo M., 2010. Beraldin J.A., Acquisizione 3D e modellazione poligonale, McGraw-Hill, Milano, pp. 152-157.
Hartley R., Zisserman A., 2004. Multiple View Geometry, Cambridge, pp. 279-291.
Mikhail E.M., Bethel J.S.,McGlone J.C., 2001. Introduction to modern Photogrammetry, John Wiley & Sons, Inc., pp. 99-101.
References from Other Literature:
Barazzetti L., Remondino F., Scaioni M., 2010. Automation in 3D reconstruction: results on different kinds of close-range blocksIAPRSSIS, Vol. 38, Part 5, Newcastle u. Tyne, UK pp. 55-61.
Farenzena, M., Fusiello, A., Gherardi, R., 2009. Structure and Motion pipeline on a hierchical cluster tree. Proc. of IEEE 3DIM Conference, Kyoto, Japan.
Giersch L.R.M., 2001. Pathfinder Photogrammetry Research for Ultra-Lightweight and Inflatable Space Structures. NASA CR-2001-211244 pp 40-41.
Menna F., Troisi S., 2007. Photogrammetric 3D modelling of a boat’s hull. Proceedings of the Optical 3D Measurement Techniques VIII, vol. II, Zurich, pp. 347-354.
Muja, M. and Lowe, D., 2009. Fast approximate nearest neighbours with automatic algorithm configuration. International Conference on Computer Vision Theory and Applications (VISAPP’09).
Remondino, F, Zhang, L., 2006, Surface Reconstruction Algorithms for Detailed Close-Range Object Modelling, ISPRS Commission III Symposium, IAPRS&SIS, Vol. XXXVI, Part 3, pp. 117-123.
Strecha C., Von Hansen W., Van Gool L., Fua P., Thoennessen, U., 2008. On Benchmarking Camera Calibration and Multi-View Stereo for High Resolution Imagery, CVPR.
Torr P. H. S. and Zisserman A., MLESAC: A New Robust Estimator with Application to Estimating Image Geometry, Computer Vision and Image Understanding, 2000.
Zuliani M., 2006. Computation Methods for Automatic Image Registration. Ph.D. Thesis in Electrical and Computer Engineering, University of California.
This work was supported by funds MIUR - PRIN prot. 200755X7BB-003