CLOUD BASED WEB 3D GIS Taiwan PLATFORM
Whey-Fone Tsai a, *, Jo-Yu Chang b, Sheng Yun Yan c, Bo Chen d
a
National Center for High-performance Computing, Hsinchu 30076, Taiwan, [email protected] b National Center for High-performance Computing, Hsinchu 30076, Taiwan, [email protected]
c National Space Organization, Hsinchu 30076, Taiwan, [email protected] d
National Space Organization, Hsinchu 30076, Taiwan, [email protected]
Commission VI
KEY WORDS: Cloud Service, 3D GIS, Data Warehouse, Virtual Machine
ABSTRACT:
This article presents the status of the web 3D GIS platform, which has been developed in the National Applied Research Laboratories. The purpose is to develop a global earth observation 3D GIS platform for applications to disaster monitoring and assessment in Taiwan. For quick response to preliminary and detailed assessment after a natural disaster occurs, the web 3D GIS platform is useful to access, transfer, integrate, display and analyze the multi-scale huge data following the international OGC standard. The framework of cloud service for data warehousing management and efficiency enhancement using VMWare is illustrated in this article.
* Corresponding author.
1. INTRODUCTION
Typhoons have frequently invaded Taiwan and caused floods, landslides, and inundations. Therefore, it is very essential to acquire the high-resolution spatial imagery and terrain data soon after a disaster event that will be helpful for decision support to disaster response and relief. Based on the need, the National Applied Research Laboratories’ (NARL) has conducted a project, entitled “Development of global earth observation 3D GIS platform for applications to disaster monitoring and assessment in Taiwan.” (Tsai, 2011) The core technologies in the platform include remote sensing technology, advanced 3D visualization, data warehouse, grid and cloud computing, and disaster reduction technology along with the vision of the advanced Cyberinfrastructure for global earth observation. In more detailed description, the kernels of the platform comprises of (1) the integration of multi-scale global earth observations: including the large-scale Formosat-2 satellite observation, the meso-scale airborne observation, and high-resolution small-scale, in-situ 3D photography; (2) the development of advanced 3D GIS display systems: including the passive large projection system, the active middle-size projection system, and personal 3D display system for displaying high-definition 3D terrain; (3) the development of Web 3D GIS platform: to access, transfer, integrate, display and analyze the multi-scale observation data following the OGC international standard; and (4) the development of a near real-time pipeline and semi-automation procedure image processing and fast releasing for disaster decision support. The above developed technologies and methodologies have been implemented in the 2009 Typhoon Morakot and the 2010 Typhoon Fanapi affected disaster sites for information decision support in both preliminary and detailed assessment stages. Thousands of multi-scale images in disaster sites were taken and processed, and composed through the platform to provide a deep insight into the scenario interpretation, comparison, deployment evaluation and recovery planning. The platform can be also linked with end-user disaster prevention database, analyzed models, real-time monitoring
sensors and collaborative communication system to constitute a comprehensive decision support information system to support typhoon and flood disaster prevention operation mission. The multi-scale image capturing and 3D GIS platform have been proven very useful in the typhoon and flood events for disaster reduction and recovery, as well as for scientific research and social education.
In this article, we will focus on illustration of the Web 3D GIS platform, especially the management of the huge geospatial data and cloud service features.
2. DEVELOPMENT OF WEB 3D GIS TAIWAN
The web 3D GIS platform has been developed to access, transfer, integrate, display and analyze the multi-scale huge data following the international OGC (OGC, 2011) standard. The web 3D GIS platform has been developed based on the NASA World Wind system (NASA, 2011), for leveraging high resolution remote sensing imagery and applications to environmental monitoring and disaster mitigation. World Wind is an open source 3D interactive world viewer, was created by NASA's Learning Technologies project, and released in mid-2004. World Wind allows any user to zoom from outer space into any place on Earth. World Wind uses satellite imagery and elevation data to allow users to experience earth terrain in visually rich 3D, just as if they were really there. Navigation is automated with single clicks of a mouse as well as the ability to type in any location and automatically zoom into it. World Wind was designed to run on recent PC hardware with 3D acceleration. Usually, people may be curious about the difference of World Wind and Google Earth. At their basic the two applications are different in philosophy and really do seem to have divergent target audiences. Google Earth is a vehicle to location based services in 3D, whose primary target is the general public. World Wind is the scientist’s and student’s programmer tool whose plug-in architecture means in the long run it could have more features as it is easy to add plug-ins and customized to fit its user exactly.
International Archives of the Photogrammetry, Remote Sensing and Spatial Information Sciences, Volume XXXVIII-6/W27, 2011 ISPRS Taipei 2011 Workshop, 4-6 October 2011, Taipei, Taiwan
The web 3D GIS platform for Taiwan (Figure 1) is developed by modification of World Wind system which encompasses multi-scale images incorporated with data warehouse/fusion and high-performance visualization technologies, attempts to implement a near real-time and semi-automation image processing procedures coupled with Formosat-2 image processing, and links with end-user disaster prevention database, analyzed model and assessment methods for decision support to disaster assessment and scenario identification.
Figure 1. The web-based 3D GIS Taiwan platform
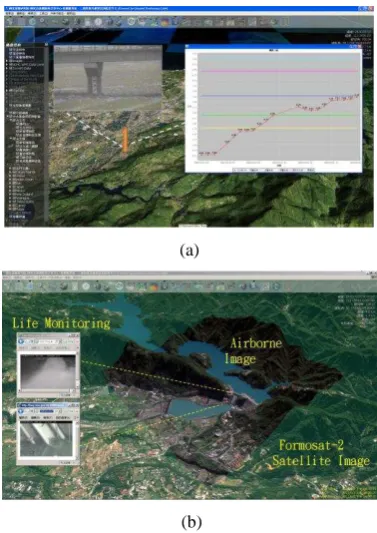
The web 3D GIS platform Taiwan can be synchronized and seamlessly linked with multiple disaster information and other supporting platform for assessment and display, such as real-time water level monitoring and associated images, as seen in Figure 2(a). Figure 2(b) shows the Shihmen Reservoir spillway area displayed by overlapping the aerial image and Formosat-2 satellite image. Meantime, the real-time monitoring cameras, located in downstream of the spillway, provide two life videos for decision support.
(a)
(b)
Figure 2. Web 3D GIS platform intergates multi information
So far there have many typhoon-induced disaster applications using the web 3D GIS Taiwan platform for practical decision-making. Figure 3(a) shows the overlapping of aerial and satellite images in Shiaolin village, allowing viewed and analyzed in the web 3D GIS platform. Figure 3(b) is the overlapping of aerial and satellite images though the web 3D platform in Jiaxian village after encountering 6.4 earthquake event. Figure 4 show another application of landslide accident in National Highway near Keelung section occurred in April 2010. The web 3D GIS platform shows the differences before and after the disaster to provide government agencies for the follow-up disaster relief, exploration and research.
(a) (b)
Figure 3. Disaster applications on web 3D GIS platform
(a) Before disaster (b)After disaster
Figure 4. Application of Web 3D GIS on landslide analysis
3. DATA WAREHOUSING AND CLOUD SERVICE
The web 3D GIS Taiwan platform has linked with the back-end data warehouse, and can quickly provide the user over the network through a variety of applications, directly interfacing and access to the platform of cloud services. The service contents may include the WMS service layer data, WFS Web Feature Service of the electronic map, the control data points, and the terrain elevation data. Through the service framework, it can publish image with instant notification of information. The published images can be integrated in the web 3D GIS platform for analysis and comparison, as a support for decision-making basis.
Figure 5. Web map service structure International Archives of the Photogrammetry, Remote Sensing and Spatial Information Sciences, Volume XXXVIII-6/W27, 2011
ISPRS Taipei 2011 Workshop, 4-6 October 2011, Taipei, Taiwan
For the current map service has been released in a standardized manner over the OGC WMS, as shown in Figure 5, according to customer demand. The WMS can preserve security on the data storage systems following the organized processing structure listed in Figure 5. While the overall cloud service architecture is shown in Figure 6. The proposed infrastructure of the complete cloud service provides a general application platform to interface with all the necessary services and information, and the establishment of standards related applications template, in order to facilitate internal and external promotion and service to academia, government, industry and research.
Figure 6. Data warehousing and cloud service
Figure 7 sketches the detailed deployment of clous framework thorugh “virtualization” by installing cloud middleware. The idea of virtulization is to improve the efficiency and availability of IT resources and applications, and to eliminate the old “one server, one application” model and run multiple virtual machines on each physical machine. Here, we adopt commercial virtulization middleware VMWare vSphere5 for administarion of client service (VMware, 2011a); and adopt open source Virtual Machine ESXi5 hypervisor middleware(VMware, 2011b). The hypervisor architecture of VMware vSphere plays a critical role in the management of the virtual infrastructure. Figure 7 shows there are three nodes installed Vmware ESXi5 hypervisor. After installed, each node can provide WMS/WFS and terrain service. Each service can provide 30 client users. Therefore, the service efficiency becomes double. Through virtualization, it can further double up and provides four different kinds of service, and even more.
Figure 7. Framework of VMWare deployment
4. APPLICATION TO IMAGE PROCESSING SUPPORT
Moreover, consideration of fast linkage to disaster information support node, the supply chain system of Formosat-2 (NSPO, 2011) satellite image is designed a pipeline processing. Immediately after disaster occurs, in the urgent stage NSPO applies multi-band parallel image processing system (Figure 8) to deliver level 1A and level 2 images. Meantime, NSPO continues to work on ortho-image processing acceleration and deliver through web 3D GIS Taiwan platform following the WMS mechanism to release the linkage to clients. Figure 9 shows the west band image and cab be stitched into the 3D GIS Taiwan platform.
All the clients after receiving the notification of WMS service can access data server and via web 3D GIS platform to integrate, display and analyse. Since the data warehouse is cloud enabling, therefore it can provide multiple OGC WMS services simultaneously, as shown in Figure 10.
Figure 8. Formosat-2 satellite takes five bands of image
Figure 9. West band image stitched into 3D GIS platform
Figure 10. Publishing image for multiple WMS users International Archives of the Photogrammetry, Remote Sensing and Spatial Information Sciences, Volume XXXVIII-6/W27, 2011
ISPRS Taipei 2011 Workshop, 4-6 October 2011, Taipei, Taiwan
5. CONCLUDING REMARKS
The web 3D GIS platform has been developed and proven useful to access, transfer, integrate, display and analyse the huge geospatial data. Virtualization plays important role in improving the efficiency and availability of IT resources and applications, and to eliminate the old “one server, one application” model and run multiple virtual machines on each physical machine. In the example of Formosat-2 image processing acceleration and subsequent notification of MWS service to multiple clients and access to the cloud server, the cloud based web 3D GIS platform has been demonstrated its capability on data management and relevant service.
REFERENCES
Tsai, W. F., 2011. Development of global earth observation 3D GIS platform for applications to disaster monitoring and assessment in Taiwan. Governmental Technology Project Report, NARL Report No.:99-1903-05-05-17.
NSPO, 2011. Formosat-2 satellite.
http://www.nspo.org.tw/2008e/projects/project2/intro.htm (accessed 14 Sep. 2011)
NASA, 2011. World Wind.
http://worldwind.arc.nasa.gov/index.html (accessed 14 Sep. 2011)
Tsai, W. F., Chen, B., and Chang, J. R., 2010. Development of Cloud Platform for Supporting the Near Real-time Three-dimensional Geographical Information Communications. National Land Information System Communication Journal, No. 74, pp. 39-51.
OGC, 2011. Standard and Specification. http://www.opengeospatial.org/standards (accessed 14 Sep. 2011)
VMware, 2011a. Worldwide. Center. http://www.vmware.com/worldwide.html (accessed 14 Sep. 2011)
VMware, 2011b. ESXi and ESX Info Center. http://www.vmware.com/products/vsphere/esxi-and-esx/overview.html (accessed 14 Sep. 2011)
International Archives of the Photogrammetry, Remote Sensing and Spatial Information Sciences, Volume XXXVIII-6/W27, 2011 ISPRS Taipei 2011 Workshop, 4-6 October 2011, Taipei, Taiwan