A SIMULATED REAL-TIME SEVERE WEATHER NOWCASTING
C.-Y. Liu a,b *, S. A. Ackerman b
a
CSRSR, National Central University, 300 Zhongda Rd, Zhongli City, Taoyuan, 32001, Taiwan
bSpace Science and Engineering Center, University of Wisconsin-Madison, 1225 W. Dayton St., Madison 53706, USA
KEY WORDS: Severe weather nowcasting, McIDAS,
ABSTRACT:
An upper-level undergraduate course entitled “Radar and Satellite Meteorology” has offered for the past five years at the Department of Atmospheric and Oceanic Sciences, University of Wisconsin-Madison. This course has two components, one is the lectures on remote sensing theory, and the other is laboratory exercises that involve the investigation of archived radar and satellite data. One of the most popular laboratory exercises, according to the students’ feedback, is the simulated real-time severe weather nowcasting in the computer-equipped classroom. The students are experienced a severe weather outbreak and placed in a real-time operational decision-making environment. Archived Level-II and Level-III Next-generation Radar (NEXRAD) data is viewed with either the freely available Integrated Data Viewer (IDV) or McIDAS software packages. The “bundling” feature of these software packages allows the instructor to pre-package radar data (e.g., reflectivity, storm-relative Doppler velocity) and feed it to the students every four to five minutes, simulating the delay between radar volume scans. Teams of students are required to monitor the evolution of the situation and issue severe weather warnings based on radar analysis skills developed in lecture and previous labs. Documented storm reports are also integrated into the lab to assist – or sometimes detract from – the students' warning decisions, and the classroom clock is even adjusted to correspond with the time of the events. This exercise provides students with a unique operational experience that is often missing from the undergraduate curriculum. Its inherent portability and flexibility allows instructors to adapt it to any historical severe weather event, making it appropriate for courses in mesoscale and synoptic meteorology in addition to remote sensing.
* Corresponding author: Dr. Chian-Yi Liu, Center for Space and Remote Sensing Research, National Central University, 300 Zhongda Rd, Zhongli City, Taoyuan 32001, Taiwan. E-mail: [email protected]
1. INTRODUCTION
The Department of Atmospheric and Oceanic Sciences, University of Wisconsin-Madison has offered an upper-level undergraduate elective course entitled “Radar and Satellite Meteorology” for the past five years. This course is comprised of two main components – a 50-minute lecture section that convenes twice a week and a computer laboratory section that meets once a week for 110 minutes. The class is held in a classroom outfitted with 15 computer workstations. Maximum enrollment in the class is 24 students. Lecture time is largely dedicated to providing the theoretical foundation for meteorological remote sensing, while the extended computer laboratory session allows dedicated time to deeply explore lecture topics through hands-on analysis of actual remotely-sensed data. These lab exercises range from basic interpretation of radar and satellite data to more extensive case studies that demand a rigorous quantitative approach to data analysis.
By far the most popular lab is one that attempts to simulate the experience of working in a weather forecast office during a local severe weather event. Teams of students are called upon to issue watches and warnings for a geographic area based on their analysis of archived radar data in a simulated real-time environment. This places students in a real-time operational decision-making mode and satisfies a common student desire for more so-called “real-world” exercises in the meteorological classroom, while reinforcing their knowledge of severe weather radar signatures acquired during lecture.
This paper will provide a detailed summary of the exercise as it is currently used in the classroom. The data and software utilized in this lab exercise are described in section 2. Section 3 outlines the lab set-up and logistics, while section 4 discusses assessment and post-lab activities. Concluding remarks are provided in Section 5.
2. DATA AND SOFTWARE
This classroom exercise is currently administered using the McIDAS-V (Achtor et al. 2008) software packages; earlier incarnations used the Integrated Data Viewer (IDV). McIDAS-V is a free, open-source software package produced by the Space Science and Engineering Center at the University of Wisconsin-Madison. It is designed to enable the analysis of meteorological data from a variety of data sources through the use of a simple graphical interface. It can be downloaded from
the McIDAS-V homepage at: http://www.ssec.wisc.edu/mcidas/software/v . A key feature of
McIDAS-V is bundling, in which multiple datasets can be saved together in one file; this activity makes ample use of that feature.
Ideally, this exercise would be undertaken in a true real-time setting with the students monitoring a severe weather event during class time. However, the likelihood of a severe weather event taking place during the time set aside for such an activity International Archives of the Photogrammetry, Remote Sensing and Spatial Information Sciences, Volume XXXVIII-6/W27, 2011
ISPRS Taipei 2011 Workshop, 4-6 October 2011, Taipei, Taiwan
is quite small. Instead, archived radar data from the operational NEXRAD network was obtained from the National Climatic Data Center (NCDC). Currently, the Level-II reflectivity and base velocity and Level-III storm relative velocity fields are used in this exercise. Data is limited to the lowest elevation angle. Previous iterations used the full Level-II volume scan, but the substantially larger files meant that students had to spend more time loading data instead of analyzing it and they rarely looked at any level other than the lowest. Bundles containing the previous one hour of radar data were generated for every four minute time step and saved in a directory that could only be accessed by the instructor.
3. LOGISTICS AND ADMINISTRATION
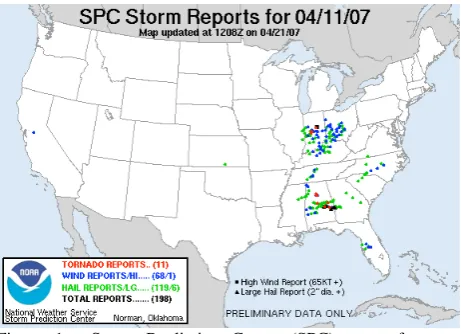
Before the day of the lab, the case had to be selected and the bundles had to be generated. Case selection proved to be a surprisingly difficult task. Several criteria were identified as being necessary for a case to be used in this activity. First, since it was desired that students have experience nowcasting for the different types of severe weather, the right case had to have storm reports that included tornadoes, large hail, and damaging winds. Second, since the prognostic nature of the activity necessitated that students not have any prior experience with the event to avoid “forecasting” from memory. While the first iteration of this lab used the 18 August 2005 tornado that passed within 20 km of the UW-Madison campus, it was decided that subsequent runs be spatially and temporally separated from the students’ college careers. Third, it was desired that the event occur over a region served by only one radar in order to reduce the amount of data that had to be loaded. Finally, the event had to run its course (or at least move out of the target area) within ninety minutes in order to fit within the confines of the scheduled duration of the lab. After sorting through several months of storm reports, a case that met these criteria was found: the severe weather outbreak over central Indiana on 11 April 2007, when several small supercells developed in Indiana ahead of a cold front. A map of storm reports from that day is shown in Figure 1. As is evident from the map, storm reports of all three types were prevalent in central Indiana on that day.
Students were divided into teams of four. Each group was charged with issuing warnings for counties within the Indianapolis National Weather Service county warning area. Each warning was supposed to include the nature of the threat, expiration time, and towns in immediate danger. Students were not required to designate specific tasks for each individual, but most groups tended to delegate recording their warnings to one individual. At the start of the lab, each group was given a road map of the region denoting the cities, towns, and counties; the most recent surface map; the latest upper air charts from the standard levels; and the latest sounding from the two nearest locations. The groups were given ten minutes to assimilate all of this data and discuss their operational plans.
In order to maintain the illusion of a real-time event, the clock on the classroom wall was changed to represent the time of the event. The clock then served as the governing timepiece for the activity.
Figure 1. Storm Prediction Center (SPC) map of severe weather reports for the 11 April 2007 case selected for this activity. Note the presence of numerous reports of all three types in central Indiana, the target location for this lab.
When the virtual time of the latest radar volume scan was reached, the corresponding bundle was moved out of the private directory and into the classroom working directory. The availability of the most recent data was announced and the students could then load the bundle and investigate the most recent changes. Storm reports, obtained from the NCDC Storm Data publication, were read aloud at the appropriate times and updated surface maps were distributed at their virtual time of validity.
4. ASSESSMENT
At the end of the laboratory session, students were asked to submit a copy of their warnings for review while retaining a copy for themselves that they could use to write their lab report. For this report, they were asked to give an overview of the meteorological situation and discuss their warnings in greater detail and the criteria that they used when issuing them. For tornado warnings, students issued warnings based on identification of a vortex couplet in the storm-relative velocity data. Hail warnings were typically issued because the reflectivity was greater than 55 dBZ. Both of these warning types tended to be issued in a proactive manner. Wind warnings tended to be issued reactively; they would issue warnings after a storm report was received. This behavior is likely due to the fact that signatures for large hail and tornadoes were discussed in class, but no tools for diagnosing wind events were presented.
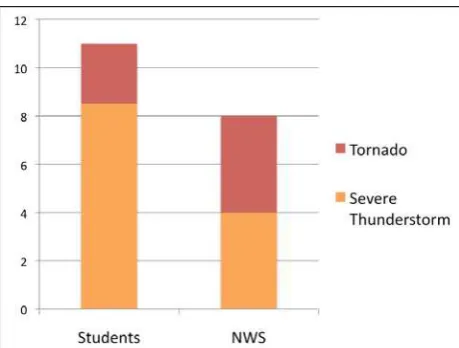
Students were graded on their own merits for the quality and justification for the warnings they issued, and as such were not graded against the National Weather Service’s own record. The students were surprised to find that each group issued many more warnings than the professionals, as shown in Figure 2. The students also issued longer warnings than the NWS, at 43 minutes versus 34 minutes.
International Archives of the Photogrammetry, Remote Sensing and Spatial Information Sciences, Volume XXXVIII-6/W27, 2011 ISPRS Taipei 2011 Workshop, 4-6 October 2011, Taipei, Taiwan
Figure 2. Average number of warnings issued by student groups compared to the number issued by the National Weather Service from 2100 to 2240 UTC on 11 April. Tornado warnings are indicated in red, while severe thunderstorm warnings are shown in orange.
5. CONCLUDING REMARKS AND FUTURE PLANS
The exercise presented here provides a unique operational experience to the students, and its inherent portability and flexibility, coupled with the free software and access to data, allows instructors at all institutions to adapt it to any historical severe Some avenues for enhancing this lab remain open. One option would be to form a liaison with the local National Weather Service office to have them observe the activity and provide feedback on what could be done to make the experience more authentic. As the National Weather Service transitions to the second generation of the Advanced Weather Interactive Processing System (AWIPS), it may be possible to integrate that software package into the classroom as well.
REFERENCES
Actor, T. T. Rink, T. Whittaker, D. Parker, and D. Santek, 2008: McIDAS-V: A Powerful Data Analysis and Visualiztion Tool for Multi and Hyperspectral Environmental Satellite Data. Proceedings, SPIE 7085, 708509, DOI:10.1117/12.795223.
International Archives of the Photogrammetry, Remote Sensing and Spatial Information Sciences, Volume XXXVIII-6/W27, 2011 ISPRS Taipei 2011 Workshop, 4-6 October 2011, Taipei, Taiwan