v-SIPAL – A VIRTUAL LABORATORY FOR
SATELLITE IMAGE PROCESSING AND ANALYSIS
Krishna Mohan Buddhiraju1* , Laxminarayana Eeti2 and Krishna Kumar Tiwari3 1
Associate Professor, Centre of Studies in Resources Engineering, Indian Institute of Technology Bombay Powai, Mumbai 400076, India; Tel: +91-22-2576-7684
Email: [email protected]
2
Research Assistant, Centre of Studies in Resources Engineering, Indian Institute of Technology Bombay Powai, Mumbai 400076, India; Tel: +91-22-2576-4676
Email: [email protected]
3
Master’s Student, Centre of Studies in Resources Engineering, Indian Institute of Technology Bombay Powai, Mumbai 400076, India; Tel: +91-22-2576-4676
Email: [email protected]
Commission VI, WG VI/4
KEY WORDS: Virtual Laboratory, Satellite Image Processing, Web-based learning
ABSTRACT:
In this paper a virtual laboratory for the Satellite Image Processing and Analysis (v-SIPAL) being developed at the Indian Institute of Technology Bombay is described. v-SIPAL comprises a set of experiments that are normally carried out by students learning digital processing and analysis of satellite images using commercial software. Currently, the experiments that are available on the server include Image Viewer, Image Contrast Enhancement, Image Smoothing, Edge Enhancement, Principal Component Transform, Texture Analysis by Co-occurrence Matrix method, Image Indices, Color Coordinate Transforms, Fourier Analysis, Mathematical Morphology, Unsupervised Image Classification, Supervised Image Classification and Accuracy Assessment. The virtual laboratory includes a theory module for each option of every experiment, a description of the procedure to perform each experiment, the menu to choose and perform the experiment, a module on interpretation of results when performed with a given image and pre-specified options, bibliography, links to useful internet resources and user-feedback. The user can upload his/her own images for performing the experiments and can also reuse outputs of one experiment in another experiment where applicable. Some of the other experiments currently under development include georeferencing of images, data fusion, feature evaluation by divergence andJ-M distance, image compression, wavelet image analysis and change detection. Additions to the theory module include self-assessment quizzes, audio-video clips on selected concepts, and a discussion of elements of visual image interpretation. V-SIPAL is at the satge of internal evaluation within IIT Bombay and will soon be open to selected educational institutions in India for evaluation.
1. INTRODUCTION
1.1 Virtual Laboratories
Around the world it is seen in many countries that some of the institutions are considered premier due to extensive funding from government and industry, quality faculty members in large numbers and well equipped laboratories for the students to gain hands-on experience with state-of-the-art hardware and software. The quality of teaching and research, and laboratory facilities at other institutions would be a few notches below those of the premier institutions. In order to reduce the gap between these groups of institutions, Government of India launched two major programmes called Virtual Laboratories and Technology Enhanced Learning. Through these programmes students get access to videos of lectures delivered at the Indian Institutes of Technology and course materials as well as web-enabled virtual laboratories using which experiments are performed as if they are done in the laboratory itself. At the user’s end all that is needed is an internet browser to actually perform these experiments. As part of this programme, a virtual laboratory is being developed at the Centre of Studies in Resources Engineering (CSRE), Indian Institute of Technology Bombay, India for satellite image
processing and analysis (v-SIPAL) that enables the student to perform the same kind of image processing experiments that are typically done in a satellite image analysis laboratory using commercial software. The coming sections discuss the structure and modules in this virtual laboratory.
2. ARCHITECTURE OF THE VIRTUAL LAB
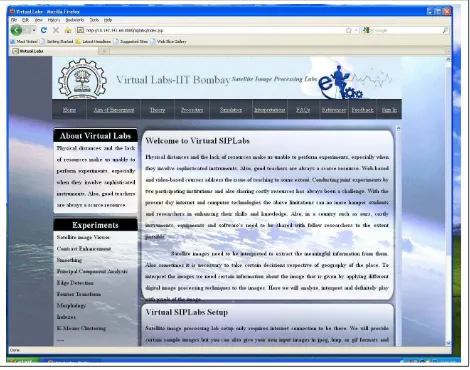
The architecture of the virtual lab and the front-end are shown in Figure 1. As can be seen, the user can see the list of experiments available, read the theoretical underpinnings, the procedure to perform the experiment, the link to the experiment (under the link simulation), the interpretation of the results with selected inputs, Frequently Asked Questions (FAQ’s), links to literature (under thelink References), and user feedback. Each user has to register first time and use the lab each time through his/her own sign in so that even if many users perform simultaneously the same experiment with the same input files, generating outputs with the same names there will be no conflict since separate work space will be created for each user.
In order to understand the outputs of any experiment, a first time student of remote sensing and satellite image processing should be
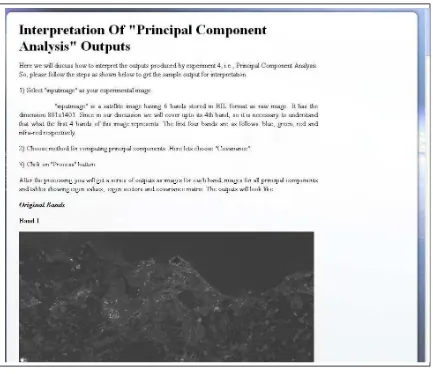
provided the interpretation of the results of the experiment. In this virtual laboratory, this is achieved by providing a set of sample images, and a set of pre-defined inputs for each experiment with which the student is expected to obtain identical outputs that are shown in the interpretation module. The explanation of the results here helps the student to gain better understanding of the experiment itself and relate better to the theoretical background provided in the accompanying theory module. This is shown in Figure 4.
Figure 1. Front-end of the Virtual Lab
2.1 Theory
Each experiment is based on clearly spelt out theoretical principles that can be found in textbooks like Richards and Jia (2006), Jensen (2005) and Gonzalez and Woods (2009). The theory module contains the theoretical background for each experiment in the form of technical notes. Audio-video clips are also included explaining selected concepts in detail. This module is particularly important for users who are not current students but want to refresh their background and also get a hands-on experience in satellite image processing. While the virtual laboratory here is entirely based on image processing using software, there are other virtual laboratories that are based on controlling physical hardware using remote access provided to the student through internet (see Srivastava et al., 2011). Ozturk (2011) describes a system for integrated circuit design using a simulator to provide experience based learning for the
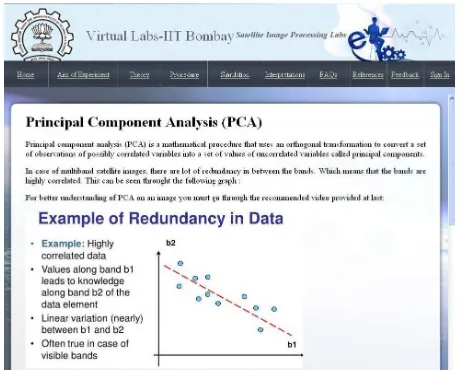
student. Goodwin et al. (2011) developed virtual laboratories where they emulate physical systems through software and present an interface to the student to get access to various components of the systems. Figure 2 shows the theory page for the Principal Component Analysis experiment.
2.2 The Experiment
The actual experiment is implemented using Matlab and compiled into an executable that reads the relevant inputs for the experiment for a file. Using a html user-interface the user is
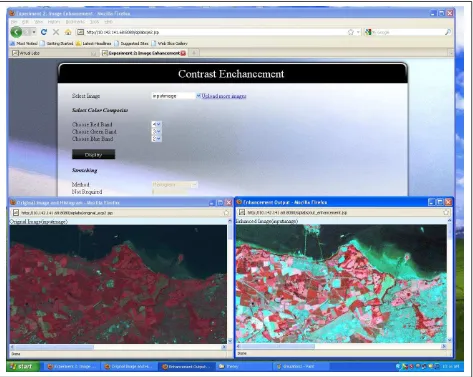
prompted to provide relevant inputs to the experiment, such as the input file name, any user specifiable parameters for that experiment (e.g., value of sigma, lower and upper thresholds for Canny edge detector). The result is displayed on the user’s monitor that can be saved onto the user’s computer through right click and save option through the browser. All files are saved on the server for subsequent use. The advantage here is that the size of the lab can grow incrementally by adding new experiments as and when they are ready, without disturbing the existing set. Further, any experiment can be replaced by a functionally richer version. For illustration, the image viewer experiment is shown in Figure 3 where the user can compose a color composite, view the histogram, read out pixel values at a given cursor location, operations that are typically done in the first time interaction with a remotely sensed image. The user can also extract a subimage from the displayed image and carry out the experiments with that one.
Figure 2. Example of theoretical principles for the Principal Component Analysis experiment
2.3 Interpretation
In order to understand the outputs of any experiment, a first time student of remote sensing and satellite image processing should be provided the interpretation of the results of the experiment. In this virtual laboratory, this is achieved by providing a set of sample images, and a set of pre-defined inputs for each experiment with which the student is expected to obtain identical outputs that are shown in the interpretation module. The explanation of the results here helps the student to gain better understanding of the experiment itself and relate better to the theoretical background provided in the accompanying theory module. This is shown in Figure 4.
3. FUNCTIONALITY
The virtual lab being developed here is functionally rich, not only in terms of the experiments but also in terms of the number of options under each experiment. For instance, in the case of contrast enhancement experiment, the user can learn the working of linear, logarithmic, exponential, standard deviation and histogram equalization methods of contrast manipulation. Likewise, the smoothing experiment allows the user to understand the principles of simple arithmetic averaging, averaging with user specified weights, shift variant filtering
using sigma filter, Lee filter, nonlinear smoothing using median filter, and so on. A systematic study of the theory, experiment and interpretation would enable the student to get a sound understanding of the working of the satellite image processing and analysis methods that form this virtual laboratory. In addition to the experiment, the student can avail the self-assessment quizzes built into the virtual lab by choosing a question paper that is of multiple-choice type. This option takes on the role of the viva-voce examination that typically accompanies any laboratory course where a student is tested after each experiment or after every ‘n’ experiments, determined by the instructor. The size of the question paper will be optional. Essentially a bank of questions are prepared from which the user will be randomly presented ‘n’ questions by the system. Based on the experiments completed, the student will get a question paper where the questions will be pertaining to those experiments. With time, the size of the question bank can grow significantly, and each time the student can get a question paper that has reduced overlap with a previous question paper. This option is under development at this time, and is expected to be incorporated into the system in the next few weeks. International Archives of the Photogrammetry, Remote Sensing and Spatial Information Sciences, Volume XXXVIII-6/W27, 2011
Figure 3. Contrast Enhancement Experiment
4. EVALUATION OF THE VIRUTAL LABORATORY
This system is currently deployed on a, Intel Xeon server with Windows 2003 server operating system, 8 GB RAM and a Redundant Array of Independent Disks (RAID) 5 configuration with 1.5 TB storage. The system is tested with 20 simultaneous user connections in an intranet connection without any noticeable performance degradation. The number of users is being increased further to note the extent of slowing down of the response. An option is provided to enhance the RAM upto 32 GB to maintain the system performance even under several simultaneous connections. The motherboard has provision for two CPUs, and currently the server is working with one CPU which can be expanded to two CPUs to cater to more users at the same performance level.
5. SUMMARY AND FUTURE PLANS
A virtual laboratory is described to train students and other trainees in the area of satellite image processing and analysis using a set of experiments that are typically encountered in a normal laboratory using commercial remote sensing software. Each experiment has a description of the theory, procedure to perform the experiment, the software, interpretation of the outputs, and evaluation through self-assessment quizzes. At present, the set of experiments planned span a first course in
satellite image processing. A second virtual lab is being planned, that will augment the current one with experiments on advanced aspects of satellite image analysis catering to artificial neural networks, support vector machines, fuzzy logic, genetic algorithms, image compression, data fusion, texture analysis, ensemble classifiers, change detection and object based image segmentation and classification. These will help the advanced users and research students to gain experience in the use of more recent developments in the analysis of satellite images.
ACKNOWLEDGEMENTS
This work is supported by the Ministry of Human Resources Development (MHRD), Government of India under the Virtual Laboratories Mission. The authors wish to acknowledge the students who tested and evaluated the overall system and provided useful feedback to improve the system.
Figure 4. Interpretation Module
REFERENCES
Richards, J. and Jia, X., 2006., Remote sensing digital image analysis, 4th ed., Springer Verlag, Berlin Heidelberg.
Jensen, J.R., 2004., Introductory digital image processing: A remote sensing perspective, 3rd ed., Prentice-Hall. Englewood Cliffs, NJ.
Gonzalez, R.C., and Woods, R.E., 2008, Digital image processing, 3rd ed., Prentice-Hall, Englewood Cliffs, NJ.
Srivastava, S., Sukumar, V., Bhasin, P.S., and Arun Kumar, D., 2011, A laboratory test bed for embedded fuzzy control, IEEE Trans. Education, 54(1), pp. 14-23.
Ozturk, O., 2011, Multicore education through simulation, IEEE Trans. Education, 54(2), pp. 203-209.
Goodwin, G.C., Medioli, A.M., Sher, W., Vlacic, L.B. and Welsh, J.S., IEEE Trans. Education, 54(1), pp. 48-55.