TASK-DEPENDENT BAND-SELECTION OF HYPERSPECTRAL IMAGES
BY PROJECTION-BASED RANDOM FORESTS
R. H¨ansch∗
, O. Hellwich
Dept. of Computer Vision and Remote Sensing, Technische Universit¨at Berlin, Germany (r.haensch, olaf.hellwich)@tu-berlin.de
KEY WORDS:Band selection, classification, hyperspectral images, Random Forests
ABSTRACT:
The automatic classification of land cover types from hyperspectral images is a challenging problem due to (among others) the large amount of spectral bands and their high spatial and spectral correlation. The extraction of meaningful features, that enables a subsequent classifier to distinguish between different land cover classes, is often limited to a subset of all available data dimensions which is found by band selection techniques or other methods of dimensionality reduction. This work applies Projection-Based Random Forests to hyperspectral images, which not only overcome the need of an explicit feature extraction, but also provide mechanisms to automatically select spectral bands that contain original (i.e. non-redundant) as well as highly meaningful information for the given classification task. The proposed method is applied to four challenging hyperspectral datasets and it is shown that the effective number of spectral bands can be considerably limited without loosing too much of classification performance, e.g. a loss of1%accuracy if roughly13% of all available bands are used.
1. INTRODUCTION
The semantic analysis of hyperspectral images is of outmost im-portance in many applications as for example urban planning (Taubenbck et al., 2012) or agriculture surveys (Alcantara et al., 2012), but states on the other hand a hard challenge due to the high dimensionality of the data, the high spatial and spectral cor-relation, the high in-class variation, as well as measurement noise. The high number of spectral bands hinders a direct and exhaus-tive visualization of the image data and makes the usually applied approach of extracting a large set of image features infeasible.
Common approaches to deal with the large number of spectral bands range from (semi-)automatic preselection of bands (e.g. manual rejection of noisy bands), to band-fusion by dimensional-ity reduction (e.g. principal component analysis (Benediktsson et al., 2005)), to more sophisticated band-selection techniques. The work of (Guo et al., 2006) proposes an approach based on infor-mation theory. It uses the mutual inforinfor-mation between the spec-tral signatures of different target variables to select bands that are considered to be of equal information content with respect to the given classification task. In (Tuia et al., 2014) the authors pro-pose an incremental selection of the best features from a large set of possible features. In each iteration new features are gener-ated and only added to an active set, if the overall performance increases. The choice of an efficient classifier as well as enforc-ing sparseness of the active set reduce the computational load. The classification performance increases, if PCA is applied to the spectral bands prior to feature computation.
After reducing the amount of spectral bands, a (mostly prede-fined) set of feature extraction operators is applied to the remain-ing set of channels to further extract meanremain-ingful information. Ex-amples are texture descriptors ((Pacifici et al., 2009)) and mor-phological operators ((Tuia et al., 2009)). Landcover maps tend to be smooth in the sense that neighboring pixels have a high probability to belong to the same class (Schindler, 2012). This spatial context is exploited by the application of spatial image filters. Their output is used (potentially additionally to the origi-nal bands) during further classification steps (Fauvel et al., 2013).
∗Corresponding author
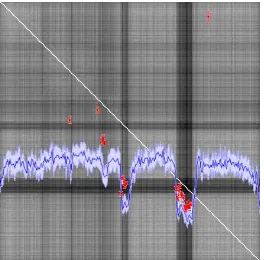
Figure 1: Proposed band selection based on usage frequencies of individual bands in a ProB-RF (red, blue) and correlation be-tween classification maps (grey)
These methods have two major disadvantages:
1. The set of features is defined a priori and heavily depends on expert knowledge. The set of filters might be suboptimal by lacking features important for the classification task while including other, less informative features.
2. The computational load of applying all filters of a large fil-terbank to all (or a reasonably sized subset of) spectral bands is tremendous.
ProB-RFs have been adapted and applied to hyperspectral data in (H¨ansch and Hellwich, 2015), where the authors show the gen-eral applicability to classification tasks from hyperspectral im-ages. The work discussed here focuses on the usage of ProB-RFs for automatic band selection instead of a standalone classification framework. In this context the high efficiency and the built-in fea-ture selection of RFs are of particular interest. The band selection proposed by this work is based on two steps: On the one hand, the correlation of classification maps based on single bands (Figure 1 shows the corresponding correlation matrix in grey) is used to reject redundant bands, i.e. bands that contain information with similar descriptive power as other bands. On the other hand, pro-vide RFs a built-in feature selection that forces the classification to focus on bands with superior information content (with respect to the given classification task). The usage frequency of the indi-vidual bands within the RF (visualized as blue curve in Figure 1) is an interesting insight into the given classification problem and can serve as information source to built more specialized systems.
The proposed approach of band selection, especially regarding correlation-based band rejection, is closely related to band clus-tering (Li et al., 2011). While band clusclus-tering merges only ad-jacent bands in one cluster, the groups as used by the proposed approach do not follow any predefined order. The idea to use cor-relation coefficients to group bands is also investigated in (Zhao et al., 2011). While the authors used the correlation between the data itself, the proposed methods computes the correlation of classification maps. Even if two bands show very distinct features (i.e. correlate less on the data level), the information contained in these bands might still be redundant given a specific classifica-tion task. Other works of band selecclassifica-tion apply methods based on information theory such as mutual information (Martinez-Uso et al., 2006, Bigdeli et al., 2013, Li et al., 2011). The disadvan-tage of these approaches is, that two different methods are used to judge the descriptive power of a band and to actually use it to in-fer the classification decision. In the proposed work the classifier selects meaningful bands by itself. Redundant bands are rejected beforehand, but by classifiers of the same framework which en-sures a higher consistency.
ProB-RFs as used in this work and their implicit feature compu-tation and selection are discussed in Section 2., while Section 3. explains their usage for band selection. The proposed framework is applied to hyperspectral datasets in Section 4.. The experi-mental results show that ProB-RFs not only lead to an accurate probabilistic estimate of the class posterior. They also provide in-formation about which bands have been useful to solve the clas-sification task and which bands do not contain descriptive infor-mation. These bands can be used to develop optimized expert systems to further increase classification performance or lower the computational load.
2. PROJECTION-BASED RANDOM FORESTS As an instance of Ensemble Theory (Dietterich and Fisher, 2000) Random Forests combine the output of many (suboptimal) deci-sion trees to one final system answer. Over the last decade many different tree-based ensemble learning methods have been pro-posed including Randomized Trees (Dietterich and Fisher, 2000), Extremely Randomized Trees (Geurts et al., 2006), Perfect Ran-dom Trees (Cutler and Zhao, 2001), Rotation Forests (Rodriguez et al., 2006), and Projection-Based RFs (ProB-RFs) (H¨ansch, 2014).
The task of pixel-wise labelling is usually solved by computing a feature vector for each pixel, which serves as input to a classi-fier. The features can be as simple as the radiometric information
contained in one pixel alone, or more sophisticated by includ-ing spatial and radiometric information from the neighborhood. Common Random Forests define decision boundaries, which are piecewise constant and parallel to the coordinate axes of the fea-ture space. Instead of treating the provided pixel-wise feafea-ture vectors independently, ProB-RFs analyse the spatial context of images and are therefore especially well suited for image analysis problems. In (H¨ansch, 2014) their classification capabilities have been shown in various image processing tasks with a focus on ob-ject categorization of polarimetric synthetic aperture radar data. Their usage in the work proposed here is based on their adaption to hyperspectral images in (H¨ansch and Hellwich, 2015). Sim-ilar to this work, no preprocessing of the data is performed, in particular no manual band selection or feature extraction. The classifier is directly applied to the hyperspectral images as they are. However, in contrast to (H¨ansch and Hellwich, 2015) this work does not focus on the mere classification performance but rather on how ProB-RFs can be used in order to detect spectral bands that are meaningful for the classification task at hand.
ProB-RFs as used in this work belong to the group of super-vised learning methods, i.e. tree creation and training are based on training data. For each sample of the training data the class label is provided additionally to the spectral information itself. Instead of using the whole dataset, each tree creates its own indi-vidual subset by drawing random samples from the training data (Bagging, (Breiman, 1996)). The process of tree creation can be interpreted as a partitioning procedure of these training samples. Each non-terminal node has two child nodes. Starting from the root node of each tree, each node applies a binary test on every data point of the local subset of the whole dataset, which was propagated to this node by its parent node. Based on the outcome of this binary test, a data point is propagated to either the left or the right child node, respectively.
To exploit the spatial context of images image patches are used instead of single pixels. This allows the classifier to access not only radiometric information of the center pixel (i.e. the pixel under investigation) as well as the radiometric information in its surrounding, but also spatial (e.g. texture) information.
In this work hyperspectral images withBspectral bands are used. No predefined features are computed, but the hyperspectral data is used as it is. ProB-RFs represent each data pointxas a
three-dimensional data cubex∈RB,Nx,Ny, where Nx×Ny is the spatial dimension of the used local neighborhood.
The test functionte:RB,Nx,Ny → {0,1}is not defined in this high-dimensional space directly. All data pointsxare projected
to scalar valuesxˆ∈Rby a projection functionpr:RB,Nx,Ny →R. The projection function selects one spectral bandband applies an operatorop(e.g. average, minimal/maximal value) to one to four regions Ri within the patch (based on the projection typept). The final scalar value is the difference of the operator outputs (see Equation 2).
The spectral-spatial projection represents each high-dimensional data cubex as a single real-valued scalarxˆ. The test function
(Equation 1) becomes a simple threshold operation (i.e.ˆx < θ?) within this one-dimensional space. The test outcome determines whether a data point is propagated to the left or right child node.
There exist several approaches to define the split pointθ, rang-ing from simple uniform samplrang-ing to supervised selection ap-proaches for example based on the probability of misclassifica-tion. This work defines the split point as the median of the set of projected valuesDnˆ t ⊂Rat nodent. It is sufficiently easy to compute and leads to equally sized subsets that are propagated to the child nodes. Given a sufficient tree height, this provides a fine partition of the input space and leads to accurate results.
The created splits rely only on the data itself, but do not depend on the supervision signal provided by the training data. To gener-ate splits that are stronger optimized with respect to the classifi-cation task, each node creates several test functions, i.e. based on different projections (e.g. by selecting different spectral bands). Optimal splits would lead to child nodes, that are of equal size (i.e. contain the same amount of data) and are as pure as possible (i.e. contain samples of as few classes as possible ). While bal-anced splits are ensured by the median-based split function, the impurityI(n)of the child nodes is estimated by the Gini-index (Equation 3) based on the local posterior class distribution of the corresponding sample subset. For each of the possible split can-didates the drop of impurity∆I(θ)from the parentntto the child nodesnt,L/Ris computed by Equation 4, whereCis the set of class labels,P(c|n)is the local class posterior estimate at node n, andPL/Rdenotes the relative size of the child nodes. From all split candidates the one with the largest drop of impurity is selected.
The recursive splitting of the input set is stopped and a termi-nal node (leaf) is created instead of a non-termitermi-nal node, if either the tree has reached a maximal height, all samples belong to the same class, or the number of samples at this node is below a cer-tain threshold. In this case the local class posteriorP(c|nt)is estimated from the samples within this leafntand assigned to it.
A query samplex is propagated through all trees of the forest
during prediction. It falls in exactly one leaf per tree. The final class posterior is estimated as the weighted sum in Equation 5, where the weightwnt depends on the size ofnt(see (H¨ansch, 2014) for details).
RFs offer an interesting method of assessing the strength of the individual base learners, which plays an important role within this work. Since each tree only uses a certain subset of all training samples (bagging), there is a set of samples that have never been used by a tree. These out-of-bag (OOB) samples can be used to estimate an approximation of the generalization error without the need of an additional hold-out set. Each tree uses its own OOB-samples, estimates their class posterior and compares it with the reference signal. The computed error serves as measurement of the strength of each individual tree.
3. AUTOMATIC BAND-SELECTION
While the previous Section 2. briefly explains the principle frame-work of ProB-RFs, this section discusses how the characteristics and mechanisms of ProB-RFs can be used for automatic band se-lection of hyperspectral data. The overall goal is to limit the total number of spectral bands without loosing too much classification accuracy.
This work investigates two possible reasons to decrease the in-fluence of a spectral band on the classifier:
1) The band does not contain information, that is meaningful for the given classification task given the information contained within the other bands. The reason might be, that it does not con-tain any meaningful information at all, as for example very noisy bands, or another band contains similar information but in higher quality as for example with less noise or higher contrast. This case is discussed in Subsection 3.1.
2) Certain spectral bands might be redundant with respect to the classification task. The measurements of hyperspectral images are not completely independent of each other, but the data of two spectrally adjacent bands will correlate to a certain extent. The similarity of the data contained in these bands causes the classi-fication decisions based on them to be correlated as well. Even if the data of two bands is not similar in terms of correlation, the classification results obtained from these bands can still correlate. In both cases, the data contained in one band can not contribute new information to the classification decision, if the data of the other band is already available and used. This case is discussed in Subsection 3.2.
3.1 Descriptive Band Selection
In this work each node of the ProB-RF creates multiple candidate splits and selects the best of these splits based on the drop of im-purity (see Section 2.). The different splits are based on different projections, in particular different spectral bands are used. In this way, each band is tested many times with different spatial pro-jections, whether it can lead to a significant decrease of impurity. A band that is more descriptive than others will be selected more often. A band that does not contain meaningful information with respect to the classification task given the other bands will be less often selected. Thus, the overall frequency with which the nodes of the forest used a specific spectral band is a strong indicator for its descriptive power.
This band selection is carried out during the training procedure of the ProB-RF. It is a direct byproduct of the tree creation pro-cess and does not require any additional calculations.
3.2 Redundant Band Rejection
The built-in feature selection of ProB-RF (as discussed above) is only able to select bands that are descriptive with respect to the classification task, but it cannot detect bands that contain re-dundant information. A straight-forward attempt to detect those bands is to compute the correlation coefficient between the corre-sponding slices of the hyperspectral image cube. However, with respect to the classification task, the image data of two bands can show only small correlation, but are still not able to contribute new information to the classification decision.
trees have access to the same band. Consequently, the prelimi-nary classification decision of each of the homogeneous-feature trees (HFT) depends on one of the spectral bands alone. Af-ter all HFTs have been trained, they are applied to the provided image data and the individual classification maps are compared. The correlation between two of these maps is used as indicator, whether the two corresponding spectral bands are redundant. If the correlation coefficient between two classification maps lies above a specified threshold, only the band is kept, where the cor-responding HFT has the lower OOB-error.
After the redundant bands have been detected and rejected, the subsequent training and application of the final ProB-RF is based on the remaining bands alone.
4. EXPERIMENTS
Four different datasets are used to evaluate the proposed band selection schemes. These datasets cover natural and man-made targets, contain low as well as high-resolution images with differ-ent numbers of spectral bands, and represdiffer-ent classification tasks with different numbers of classes.
4.1 Data
4.1.1 Indian Pines 1992 TheIndian Pines 1992dataset was acquired by the AVIRIS spectrometer over North-western Indi-ana in June 1992. The image data contains145×145pixels with a resolution of20m and contains220spectral bands in the wave-length range400−2500nm. The available ground truth provides labels of16different crop types for10,366pixels. Figure 2a shows an exemplary band of this dataset, which often serves as benchmark due to two major challenges: 1) The number of train-ing samples are unevenly distributed among the classes. 2) Some of the crops are in a very early stage of growth causing a strong mixture between plant and soil signatures. A typical preprocess-ing step for this dataset is the manual removal of bands coverpreprocess-ing the region of water absorption. This preprocessing step is omitted in the current study.
4.1.2 Kennedy Space Center TheKennedy Space Centerdataset shown in Figure 2b is acquired by the AVIRIS sensor over Florida in 1996. Since the images are taken at an altitude of approxi-mately20km, the spatial resolution of this dataset is18m. The ground truth provides labels of13different land cover types.
4.1.3 Pavia Center and Pavia University Both datasets are acquired over Pavia, Italy, by the ROSIS sensor and have a spatial resolution of1.3m.Pavia Centeris a1096×1096pixels large im-age with102spectral bands, whilePavia Universityis610×610 pixels large and consists of103spectral bands. The ground truth provided labels of nine different classes. Figures 2c-2d show a sample band of these datasets, where areas with no information have been removed.
4.2 Label generation and evaluation criteria
The classification performance is measured by the balanced ac-curacy, i.e. the average true positive rate over all classes. In each experiment10% of all labelled samples are randomly selected for testing. The remaining samples are used for training, but ex-cluding those in a3×3neighborhood of the test samples. Each experiment is repeated ten times and the performance averaged.
(a) Indian Pines 1992,145×145px,220
bands,16classes
(b) Kennedy Space Center,512×614px,176bands,13classes
(c) Pavia Center,1096×715px, 102 bands,9classes
(d) Pavia University,610×340px, 103 bands,9classes
(a) Indian Pines
(b) Kennedy Space Center
Figure 3: Usage frequency of spectral bands with exemplary in-formative and noninin-formative bands
4.3 Results
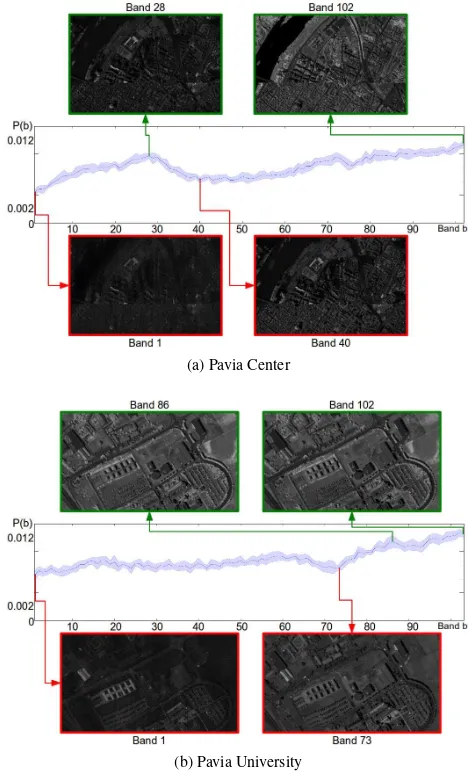
4.3.1 Non-descriptive band removal Additionally to classi-fication maps of high accuracy, the proposed system provides deep insights into the actual classification task, namely which spectral bands are useful and which are not. As discussed in Section 3.1 each node generates many test functions (potentially) based on different spectral bands during tree creation. From this set only the test is selected, which leads to the best split of the data. The frequency with which a band is used by nodes in the forest is a reliable measurement of how informative this band is for the current classification task. Figures 3-4 show the mean and standard deviation of the relative usage frequencies of all bands of the different datasets along with a few exemplary bands. The usage frequency of theIndian Pines 1992dataset in Figure 3a shows clear minimal values for spectral bands that are commonly removed manually in other works ([104−108],[150−163],220), but also at other bands which seem to be less informative. Fur-thermore, there are clear peaks at certain channels, on which the ProB-RF focussed in order to achieve the highest performance. During the experiments with theKennedy Space Centerdataset especially the first bands are used frequently as shown in Fig-ure 3b, while there is a clear trend that channels with higher IDs are less important. For thePavia Centerdataset especially bands at the beginning and center of the spectrum are of less impor-tance, while higher bands are frequently used (Figure 4a).
Al-(a) Pavia Center
(b) Pavia University
Figure 4: Usage frequency of spectral bands with exemplary in-formative and noninin-formative bands
though less dominant, the same effect is visible in Figure 4b for thePavia Universitydataset.
It should be noted, that this information is a direct byproduct of the classification process based on any kind of RFs, that generate multiple tests for split selection. No additional dimensionality re-duction techniques have to be applied beforehand or afterwards. This built-in feature selection allows the classifier to focus on in-formation that is actually important to solve the classification task at hand. It is therefore highly task-dependent. Given the same data but a different classification task, the usage frequency of the individual bands will change if other bands prove to contain de-scriptive information for this task. The obtained information can subsequently be used to built expert systems to further improve the classification performance if necessary.
4.3.2 Classification performance Figure 5 shows the confu-sion matrices obtained by averaging over ten experiments. In each run a single ProB-RF as described in Section 2. is trained and evaluated on the hyperspectral data, where the correspond-ing usage frequencies of the spectral bands are presented in Sec-tion 4.3.1 In all four cases the balanced accuracya(i.e. average true positive rate) is over90%.
(a) Indian Pines
κ= 0.85±0.03 a= 0.92±0.02
(b) Kennedy SC
κ= 0.98±0.01 a= 0.97±0.01
(c) Pavia Center
κ= 0.98±0.00 a= 0.98±0.00
(d) Pavia Uni.
κ= 0.96±0.01 a= 0.97±0.00
Figure 5: Confusion matrices (with blue and red colors corre-sponding to zero and one, respectively),κ-statistic, and balanced accuracyafor different datasets
highly sophisticated method of iterative feature selection based on active sets. The reported performance for theIndian Pines 1992dataset isκ = 0.83±0.02, which is further increased to κ= 0.89±0.03by using PCA to the original bands before fea-ture computation. The processing steps necessary to achieve this performance involve the manual rejection of noisy bands, appli-cation of PCA, enforcing a balanced training set, computation of a large set of features, and a complex iterative feature selection method. As discussed above, ProB-RF are directly applied to the original data and still achieve a performance ofκ= 0.85±0.03.
4.3.3 Redundant band removal Although the built-in fea-ture selection of ProB-RF reliably rejects bands with no descrip-tive power, it cannot detect bands that contain redundant informa-tion with respect to the given classificainforma-tion task. For this goal an additional ProB-RF is generated prior to the creation of the final classifier. This forest consists of as many homogeneous feature trees (HFTs) as there are spectral bands, i.e. trees that have ac-cess to only a single spectral band (see Section 3.2).
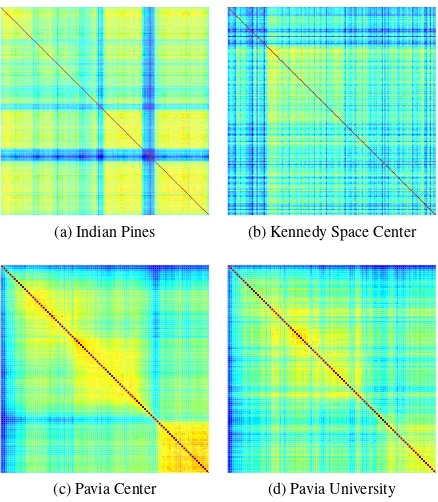
Figure 6 shows the correlation matrices of the spectral bands based on the corresponding HFTs for all four datasets. A high correlation at position(t1, t2)means, that the corresponding HFTs
t1andt2made the same decisions despite having access to two
different bandsb1andb2. The higher the individual strength of
the trees (i.e. low OOB-error), the more correct decisions are made, and the higher is the correlation. Figure 6 shows, that sev-eral bands show low correlation with all other bands. These bands are very likely to contain less information about the given clas-sification task, causing the corresponding HFT to make wrong decisions which (by definition) do not correlate with the (more correct) decisions of other trees.
Also visible in Figure 6 are groups of bands, that have high corre-lation between each other, but low correcorre-lation to bands outside of the group. These bands are considered to contain redundant in-formation with respect to the given classification task. Using the whole group, or only one suitable exemplar of this group will not significantly change the quality of information the ProB-RF has access to solve the classification task. Therefore, these bands can be removed to limit the total amount of bands. Figure 7 shows how many bands remain and how the accuracy of the classifica-tion maps changes, if from a group of bands, that have a pairwise correlation over a given threshold, only the strongest (in terms of OOB-error of the HFT) is used and the others are rejected. If the correlation threshold is low, all bands are considered as redundant and only the strongest band is selected. Although the subsequent classification by a ProB-RF is based on one single spectral band alone, the classification accuracy is still in a reasonable range. When the correlation threshold is increased, less and less bands are considered as redundant, leading to a larger number of bands and an increased classification performance. When the correla-tion threshold is high enough, no bands are considered as redun-dant and all bands are used leading to the highest performance.
(a) Indian Pines (b) Kennedy Space Center
(c) Pavia Center (d) Pavia University
Figure 6: Correlation of bands based on classification maps
(a) Indian Pines (b) Kennedy Space Center
(c) Pavia Center (d) Pavia University
Figure 7: Number of bands (blue) and balanced accuracy (red) for different correlation thresholds)
However, as can be seen in Figure 7, a classification performance close to the top-performance of using all bands can already be achieved with considerably few bands. Using only a single strong band leads to an accuracy of83.8% for theIndian Pines 1992
dataset, which is considerably increased to89.3%by using24 bands. By using all220bands, the further gain in accuracy is only1.3%. The usage of only20out of176bands of theKennedy Space Centerdataset leads to an accuracy of97.3%, which could not be improved by using more bands. For thePavia Centerand
Figure 8: Classification accuracy versus (relative) number of bands
This fact is emphasized in Figure 8, which summarizes the rela-tionship between the number of used bands and the classification accuracy. Although the achieved accuracy is a monotonous func-tion with respect to the number of bands, it increases only slightly if more than a certain number of bands is used. The largest in-crease of accuracy is achieved by using around the20strongest of the available bands. On average, using more than13%of the spectral bands increased the classification accuracy less than1%.
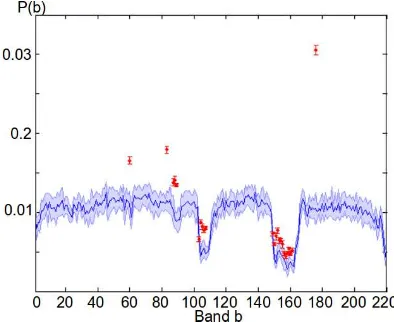
Figure 9: Usage frequency of all (blue) and selected (red) spectral bands
Figure 9 shows again the mean and standard deviation of the relative usage frequency of all bands of theIndian Pines 1992
dataset. Additionally, it shows in red which bands remain after the redundant feature rejection step as well as their relative us-age frequency. The correlation based feature selection only con-siders the relative strength of the bands (i.e. OOB-error of the corresponding HFT) within in a correlating group of bands, but not their absolute strength. Since HFTs based on non-descriptive (e.g. noisy) bands lead to many wrong classification decisions, their semantic maps have by definition a small correlation with others. Consequently, weak bands have a higher probability to survive the band rejection step. This is clearly visible in Fig-ure 9, where the majority of selected bands (in red) are within the deep valleys of the initial usage frequency (in blue). However, the built-in feature selection of ProB-RF ensures, that these weak bands are less used by the final classifier.
The effective number of bands, i.e. the number of bands with a significant usage frequency, is therefore lower than the number of input bands. A final classifier, which might incorporate also more sophisticated features than the bands itself, should be based on these bands alone. They contain original (i.e. non-redundant) as well as highly meaningful information for the given classifica-tion task. If necessary, it might be worth to try to access this in-formation by more complex features. Since the number of bands is considerably limited at this step, an exhaustive application of feature operators is feasible.
5. CONCLUSION AND FUTURE WORK The Prob-RF classifier, that is used in this work, does not rely on a computationally expensive feature extraction step, but does work directly on the hyperspectral images. Nevertheless, it auto-matically computes semantic maps with state-of-the-art accuracy.
The high efficiency, accuracy, and robustness of this classifier is exploited to gain a deeper insight into the classification task. The built-in feature selection capabilities of RFs is used to es-timate how relevant each spectral band is for the given classifi-cation task. The relevance measurement is based on the relative frequency with which a spectral band is used by the nodes of all trees in the forest.
The feature selection of RFs is only able to detect whether a band contains descriptive information with respect to a specific clas-sification task. It is however unable to detect, whether a group of bands contains the same or similar useful information. In or-der to find these sets of bands an additional ProB-RF is created prior to the final classification. This RF contains only trees, that have access to one single band. The correlation of the resulting classification maps of two individual trees serves as measurement whether the information contained in the corresponding bands is redundant.
The experiments show that both approaches increase the classifi-cation accuracy. The number of spectral bands can be consider-ably limited without a significant loss of classification accuracy. On average the usage of only roughly13%of all available bands resulted in a decreased accuracy of less than1%.
Future work will investigate the characteristics of the proposed method further, especially with respect to two effects:
1. The automatic feature selection of RFs becomes more and more random the higher within a tree it is carried out. Most of the “easy” decisions are already made by then and the continued splitting is more and more based on noise or ran-dom fluctuations within the data. This effect should be taken into account, if the relative usage frequency of a band is used to measure its importance for a given classification task.
REFERENCES
Alcantara, C., Kuemmerle, T., Prishchepov, A. V. and Radeloff, V. C., 2012. Mapping abandoned agriculture with multi-temporal
{MODIS}satellite data. Remote Sensing of Environment 124(0), pp. 334 – 347.
Benediktsson, J., Palmason, J. and Sveinsson, J., 2005. Classifi-cation of hyperspectral data from urban areas based on extended morphological profiles. Geoscience and Remote Sensing, IEEE Transactions on 43(3), pp. 480–491.
Bigdeli, B., Samadzadegan, F. and Reinartz, P., 2013. Band grouping versus band clustering in svm ensemble classification of hyperspectral imagery. Photogrammetric Engineering and Re-mote Sensing 79, pp. 523–534.
Breiman, L., 1996. Bagging predictors. In: Machine Learning, pp. 123–140.
Breiman, L., 2001. Random forests. Machine Learning 45(1), pp. 5–32.
Cutler, A. and Zhao, G., 2001. Pert - perfect random tree ensem-bles. In: Computing Science and Statistics.
Dietterich, T. G. and Fisher, D., 2000. An experimental com-parison of three methods for constructing ensembles of decision trees: Bagging, boosting, and randomization. In: Machine Learn-ing, pp. 139–157.
Fauvel, M., Tarabalka, Y., Benediktsson, J., Chanussot, J. and Tilton, J., 2013. Advances in spectral-spatial classification of hy-perspectral images. Proceedings of the IEEE 101(3), pp. 652– 675.
Geurts, P., Ernst, D. and Wehenkel, L., 2006. Extremely random-ized trees. Machine Learning 63(1), pp. 3–42.
Guo, B., Gunn, S., Damper, R. and Nelson, J., 2006. Band selection for hyperspectral image classification using mutual in-formation. Geoscience and Remote Sensing Letters, IEEE 3(4), pp. 522–526.
H¨ansch, R., 2014. Generic object categorization in PolSAR im-ages - and beyond. PhD thesis.
H¨ansch, R. and Hellwich, O., 2015. Feature-independent clas-sification of hyperspectral images by projection-based random forests. In: Whispers 2015 (submitted).
Li, S., Wu, H., Wan, D. and Zhu, J., 2011. An effective feature selection method for hyperspectral image classification based on genetic algorithm and support vector machine. Know.-Based Syst. 24(1), pp. 40–48.
Martinez-Uso, A., Pla, F., Garcia-Sevilla, P. and Sotoca, J., 2006. Automatic band selection in multispectral images using mutual information-based clustering. In: Progress in Pattern Recogni-tion, Image Analysis and Applications, Vol. 4225, pp. 644–654.
Pacifici, F., Chini, M. and Emery, W. J., 2009. A neural net-work approach using multi-scale textural metrics from very high-resolution panchromatic imagery for urban land-use classifica-tion. Remote Sensing of Environment 113(6), pp. 1276 – 1292.
Rodriguez, J. J., Kuncheva, L. I. and Alonso, C. J., 2006. Rotation forest: A new classifier ensemble method. IEEE Transactions on Pattern Analysis and Machine Intelligence 28(10), pp. 1619– 1630.
Schindler, K., 2012. An overview and comparison of smooth labeling methods for land-cover classification. Geoscience and Remote Sensing, IEEE Transactions on 50(11), pp. 4534–4545.
Taubenbck, H., Esch, T., Felbier, A., Wiesner, M., Roth, A. and Dech, S., 2012. Monitoring urbanization in mega cities from space. Remote Sensing of Environment 117(0), pp. 162 – 176. Remote Sensing of Urban Environments.
Tuia, D., Courty, N. and Flamary, R., 2014. A group-lasso active set strategy for multiclass hyperspectral image classification. In: Photogrammetric Computer Vision (PCV).
Tuia, D., Pacifici, F., Kanevski, M. and Emery, W., 2009. Classi-fication of very high spatial resolution imagery using mathemat-ical morphology and support vector machines. Geoscience and Remote Sensing, IEEE Transactions on 47(11), pp. 3866–3879.