3D FEATURE POINT EXTRACTION FROM LIDAR DATA
USING A NEURAL NETWORK
Y. Feng*, A. Schlichting, C. Brenner
Institute of Cartography and Geoinformatics, Leibniz Universität Hannover, Germany - (yu.feng, alexander.schlichting, claus.brenner)@ikg.uni-hannover.de
Commission I, ICWG I/Va
KEY WORDS: 3D feature points extraction, Mobile Mapping System, LiDAR, Neural network
ABSTRACT:
Accurate positioning of vehicles plays an important role in autonomous driving. In our previous research on landmark-based positioning, poles were extracted both from reference data and online sensor data, which were then matched to improve the positioning accuracy of the vehicles. However, there are environments which contain only a limited number of poles. 3D feature points are one of the proper alternatives to be used as landmarks. They can be assumed to be present in the environment, independent of certain object classes. To match the LiDAR data online to another LiDAR derived reference dataset, the extraction of 3D feature points is an essential step. In this paper, we address the problem of 3D feature point extraction from LiDAR datasets. Instead of hand-crafting a 3D feature point extractor, we propose to train it using a neural network. In this approach, a set of candidates for the 3D feature points is firstly detected by the Shi-Tomasi corner detector on the range images of the LiDAR point cloud. Using a back propagation algorithm for the training, the artificial neural network is capable of predicting feature points from these corner candidates. The training considers not only the shape of each corner candidate on 2D range images, but also their 3D features such as the curvature value and surface normal value in z axis, which are calculated directly based on the LiDAR point cloud. Subsequently the extracted feature points on the 2D range images are retrieved in the 3D scene. The 3D feature points extracted by this approach are generally distinctive in the 3D space. Our test shows that the proposed method is capable of providing a sufficient number of repeatable 3D feature points for the matching task. The feature points extracted by this approach have great potential to be used as landmarks for a better localization of vehicles.
* Corresponding author
1. INTRODUCTION
Advanced Driver Assistance Systems (ADAS) are nowadays a popular topic in research and development, aiming at increasing the safety of vehicles. The precise localization of vehicles is essential for a safer driving. The standard Global Navigation Satellite System (GNSS) cannot achieve a sufficient accuracy and availability in many circumstances, e.g., in cities with lots of high buildings and tall trees, because of the multi-path effect of the GNSS, or in tunnels where no GNSS signal can be received.
While currently, mostly self-driving cars are equipped with LiDAR sensors, it is expected that LiDAR will be a standard component of future ADAS systems, used for obstacle detection and environment sensing. The use of these sensors in ADAS will also improve the localization of vehicles. Vehicles can localize themselves in a known environment by measuring the distances to some known landmarks. In Brenner (2010), poles were extracted from the dense 3D point cloud measured by a mobile mapping LiDAR system. Using these extracted poles, a map of landmarks was generated as reference data, and stored in a GIS. The vehicle data was provided by four SICK laser scanners, mounted in pairs of two on rotary units on the vehicle roof. The localisation accuracy of the vehicle was significantly improved by matching the poles detected in vehicle data with the reference data. In Schlichting and Brenner (2014), the vehicle data was measured by an automotive multilayer laser scanner mounted on the front of a vehicle. The poles extracted from the vehicle data were then matched with the reference
data, which consists of the landmarks derived from a dense mobile mapping LiDAR point cloud. This approach has also improved the localization accuracy.
But the number of poles in the environment is sometimes limited. If the poles can be replaced by generic 3D feature points as landmarks, this will greatly enhance the ability to localize vehicles in general environments. To realize this goal, automatic 3D feature point extraction and matching methods between LiDAR datasets are necessary.
The main goal of this paper is to find a proper solution for extracting 3D feature points from LiDAR point clouds. The extracted feature points should be distinctive and repeatable in both datasets. Distinctiveness describes how suitable these points are used for the effective description and the matching between scans. Repeatable means the points should be robust against noise and changes in viewpoint (Tombari, 2013). These two criteria are used later for the evaluation of our approach. Afterwards our approach is also compared to other existing methods of feature point extraction and description, and the influence on registration tasks is analyzed.
The paper is organized as follows. After the introduction, Section 2 addresses related work regarding 3D feature point extraction and point cloud registration. In Section 3, our method to extract 3D feature point using a neural network is proposed. The result and overall test of this method on the mobile The International Archives of the Photogrammetry, Remote Sensing and Spatial Information Sciences, Volume XLI-B1, 2016
mapping LiDAR datasets is given in Section 4. Finally, in Section 5, we conclude and give an outlook on future work.
2. RELATED WORK
The matching between LiDAR datasets using 3D feature points can be simplified as a keypoint-based registration problem. A widely used approach for registration is the Iterative Closest Point (ICP) algorithm (Besl and McKay, 1992). It assigns closest points and estimates the least squares transformation between two scans. Then, the closest point sets are redetermined and the procedure is iterated until the minimum error is achieved (Myronenko et al., 2006). The key to a successful registration with ICP is a good initial guess of the relative transformation, otherwise it will likely converge to a local minimum.
A keypoint-point based registration can reduce the search complexity greatly and provide the required initial transformation. For the feature point extraction methods for 3D point clouds, there are generally two groups of approaches. One extracts feature points directly based on their local neighbourhood in 3D space, such as Intrinsic Shape Signature (ISS) (Zhong, 2009), Key Point Quality (KPQ) (Mian et al., 2010), which usually use the Principal Component Analysis (PCA) of the neighbourhood in 3D space and use a set of intensity image) and retrieves the 3D coordinates based on their range information. The standard 2D feature detection and description methods, such as SIFT (Scale-Invariant Feature Transform) (Lowe, 2004), SURF (Speeded-Up Robust Features) (Bay et al., 2008) and ORB (Oriented FAST and Rotated BRIEF) (Rublee et al., 2011) were used for registration between terrestrial laser scans (Urban and Weinmann, 2015). They extract a large number of feature points but with less distinctiveness and repeatability. Even though RANSAC can be used to remove wrong assignments, the large number of mismatched points would still have negative effects on the registration. A major objective is therefore to get a low number of feature points with a high quality.
3. METHODOLOGY
Instead of handcrafting a model to extract 3D feature points beforehand, we convert the 3D feature extraction into a classification problem. When we look at the range images generated from LiDAR scans, there are certainly some points in our mind, which are thought to be unique and distinctive in their local neighbourhood. For example, the corners of buildings, traffic lights, poles and windows. Our goal is to train a classifier using a small dataset labelled as feature point or non-feature point, using some representative features. Then, the algorithm is expected to learn the characteristics of feature points and extract them for all datasets which were measured in similar scenarios.
To handle this non-linear classification problem with a large number of features, we chose a neural network using back propagation as classifier. As stated in LeCun et al. (1989), the artificial neural network using back propagation has shown a great success in handwritten zip code recognition, which inspires us to exact feature points also with this method. With
the generalization ability of this neural network classifier, more distinctive feature points are expected to be extracted.
Our approach for 3D feature point extraction from LiDAR data consists of five major steps: (i) generating range images, (ii) corner detection on range images, (iii) derivation of training examples, (iv) neural network training using back propagation and (v) prediction for the 3D feature points.
3.1 Generating Range Images
Before generating range images from the LiDAR point cloud, we firstly removed the points on the ground, because these points usually have less distinctiveness in the 3D scene. Then, a range image was generated based on a 3D observation point and a heading angle.
With given horizontal and vertical opening angles, a raster with a certain resolution was computed. The resolution used in our experiments was 0.06° both in horizontal and vertical direction. Afterwards, we calculated the distance between the observation point and all the data points in the point cloud. These distance values were then inserted into each corresponding cell on the raster according to their angular relationship to the observation point. If several data points were found in the same cell, the point nearest to the observation point was chosen.
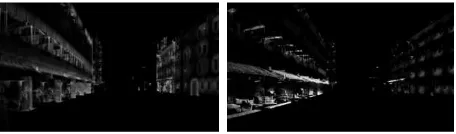
The mobile mapping system recorded the trajectories of the vehicle using a GNSS and an Inertial Measurement Unit (IMU). With these trajectories, a sequence of range images was generated along the driving direction as shown in Figure 1. Since we later used the curvature value and normal vector value as 3D features for the training, we estimated the normals of the point cloud using the implementations in the Point Cloud Library (PCL, 2014) and generated the images for these two 3D features, as shown in Figure 2.
Figure 1. Generated range image
Figure 2. Image of the curvature value (left) and normal vector component in z direction (right)
3.2 Corner Detection
Based on the idea introduced above, we are building a supervised learning algorithm. For the range images, it is The International Archives of the Photogrammetry, Remote Sensing and Spatial Information Sciences, Volume XLI-B1, 2016
impractical and also time consuming to take all the pixels on the
In this case, corner detectors on 2D images are good choices to detect feature point candidates. The Shi-Tomasi corner detector (Shi and Tomasi, 1994), a modification of the Harris corner detector (Harris and Stephens, 1988), shows a good result with representative and dense coverage of the stable corner points in the 2D images. The points are extracted only using eigenvalue decomposition, which makes it fast and robust.
The LiDAR data has the same resolution in general but the range images generated from the observation points on the streets have finer resolution in the near range and coarser resolution in the far range. Thus, there are lots of small holes as well as noisy points to be found in the near range area on the range images. Small holes were removed using morphological closing in image space, and a median filter was applied to reduce noisy points.
3.3 Derivation of Training Examples
Some of the corner points extracted in the range images after morphological closing and median blurring cannot be retrieved directly in the original point cloud. This is because these two operations changed the edge of the objects significantly. To avoid this situation from happening, a table was set up when range images were generated from the 3D point cloud. The table records the correspondence between each pixel in the range image and its corresponding 3D coordinates. When the detected corner point has no pixel value on the original range image, a kd-tree search is used to find the nearest neighbour pixel with value in the local 2D space. If a point with range value is found in the neighbourhood, it replaces the old point. If no nearest point can be found in the local area, this point is discarded. After that, the corresponding 3D point for each 2D feature point can be found with the correspondence table generated beforehand by a simple lookup.
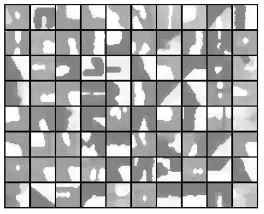
Figure 3. The templates in 32×32 window
With the retrievable candidates detected by the Shi-Tomasi corner detector, as described in Section 3.2, a 32×32 window was centred at each candidate to extract templates, which were later used as training data for the neural network. Figure 3 shows some of the template examples and their grey values at each template indicate the distances to the current observation point. To simplify the training data, the following three modifications were made to facilitate training of the neural network.
First, with the application of an adaptive threshold for each template, the grey scale templates were converted into binary value templates. In this case, we focus on detecting the shape of the candidates and by binarization, the corners at far range and near range look the same for the training algorithm.
Second, to reduce the number of different corners to train, we normalized the window such that if more than 50% of the pixels are occupied, all pixels in the window are inverted.
Figure 4. Rotation of the templates for each 90°, the procedure will pick the orientation in the first line.
Third, each corner was rotated in steps of 90° and the histograms were calculated according to its horizontal and vertical axis as shown in Figure 4. The rotation with a histogram which shows an accumulation of pixels at the upper left side was selected for training. This approach grouped similar templates which have the same shape.
Considering only the shape of each candidate in the local area is not enough. To make the feature point extraction method more robust in 3D space and improve its performance, two additional 3D features were taken into consideration for the neural network training: the local curvature value and normal vector component in z direction.
The curvature calculated from the point cloud indicates the local variation of the surface around a given point. The points at corner regions have higher curvature values than the points lying on planes. The surface normals calculated from the 3D point cloud show generally the vectors orthogonal to the local surface. The normal vector components in x and y direction are determined by the orientation of the streets and buildings. However, a large normal vector component in z normally indicates points which are unique in their neighbourhood, after removing the ground.
Currently, the template of each corner can be interpreted as a 32×32 binary matrix. This was flattened to a 1×1024 vector. By including curvature and z component, the vector was extended to 1×1026. With n labelled training examples, the final input for the neural network was a n×1026 matrix.
Then, all the templates were marked as feature or non-feature. Generally, there are some rules for the selection of feature points. As previously mentioned, the corners of buildings, traffic lights, poles and windows are assumed to be good feature points. The templates with significant rectangle or corner structures were marked with feature points. Others were marked as non-feature points.
3.4 Neural network training using Back Propagation The neural network using back propagation is generally a supervised learning method. It tries to imitate how the neurons exchange information with each other in the brain in a simple way. Each connected nodes in the neural network constitute the simplest representations of the connected neurons in the brain.
In LeCun et al. (1989), an artificial neural network using the backpropagation algorithm was applied to recognize handwritten zip code. It presented good results on recognizing the numbers written in grey value pixels. Inspired by this application, we want to learn “good” landmark points among the ones detected by the Shi-Tomasi corner detector, based on our local feature vector. The algorithm of the neural network consists of two parts. One part is the forward propagation, which is used for prediction, and the other part is the backpropagation which is used for training.
We implemented the neural network algorithm according to Bishop (2006). To minimize the cost function in the backpropagation part, we used a nonlinear conjugate gradient algorithm provided by Scipy (2013).
3.5 Prediction for the 3D feature points
After the training process as described in Section 3.4, the weight parameters between each two neighbouring layers were estimated as two matrixes. With these parameters, the forward propagation algorithm can be used to predict all unlabelled examples only by matrix multiplication and application of the activation function, which makes this approach efficient. With the candidates predicted as feature points in 2D space, their 3D coordinates can then be retrieved using the correspondence table mentioned in Section 3.3.
4. EXPERIMENTAL RESULTS 4.1 Data
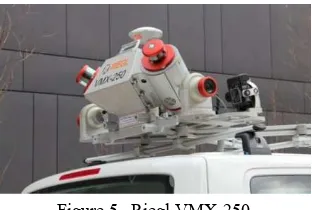
The LiDAR data for our experiments were collected by a Riegl VMX-250 Mobile Mapping System (as shown in Figure 5) in the city centre of Hannover, Germany. The system includes two Riegl VQ-250 laser scanners, which can measure 600.000 points per second (Riegl, 2012). Position and orientation of the system were measured by a GNSS receiver, an IMU and an external Distance Measurement Instrument (DMI). All the data were post-processed using RIEGL software packages and additional software for GNSS/IMU processing to generate the geo-referenced LiDAR point clouds.
Figure 5. Riegl VMX-250
4.2 Experiments
With the idea introduced in Section 3, we realized our approach using a neural network with 3 layers: one input layer with 1026
nodes, one hidden layer with 60 nodes and one output layer with 2 nodes. As we aim at classifying the candidates into feature and non-feature points, the output layer contains only 2 nodes. Using 4985 manually labelled examples, the training of this neural network using back propagation reached an accuracy of 79.59 % with a k-fold cross-validation where k is 10. This accuracy also indicated that this 3 layer structure could cover the complexity of this classification problem. To show an example, we extracted feature points on one of the generated range images as shown in Figure 6. Their corresponding 3D positions were then retrieved by looking up the correspondence table, as shown in Figure 7.
Figure 6. Feature points extracted by our approach on the range image (Candidates detected by Shi-Tomasi corner detector as red points, the selected feature points in green windows)
Figure 7. The extracted feature points, shown in the 3D point cloud
The results above indicate that the 3D feature points extracted by our approach are generally distinctive. The feature points are located at the desired positions, such as the corners of buildings and traffic lights. The repeatability test and the comparison to the currently used feature point extraction methods are conducted in the following two sections.
4.2.1 Test on the identical LiDAR dataset with different trajectories
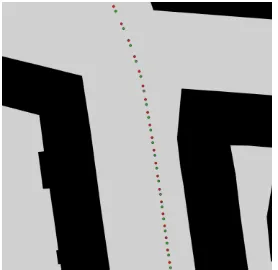
To evaluate the robustness of our approach against changes in location, we generated depth images for two slightly different trajectories, as shown in Figure 8. We applied the well-known detectors SIFT, SURF and FAST (Features from Accelerated Segment Test) on the range images to compare them with our approach. FAST is the feature detector used in ORB.
Figure 8. Trajectories. The reference feature point dataset was generated from the red trajectory, the current feature point dataset from the green trajectory
One of these trajectories was used as reference and all the feature points generated at each position were combined as a 3D feature point reference dataset. Another trajectory was used for checking, and we matched 3D the feature points extracted at each position with the reference dataset. The result was calculated based on a 5 cm threshold. If a point has a neighbour in the reference dataset within this distance, it is considered to be a repeatable point.
In this test, using 2 trajectories, the algorithm may suffer from changes in scale, rotation and perspective. The comparison includes the following three aspects: repeatability (as shown in Figure 9), Root Mean Square (RMS) error (as shown in Figure 10) and the count of feature points (as shown in Figure 11).
Figure 9. Repeatability of the extracted feature points
Figure 10. RMS error of the extracted feature points
Figure 11. Number of the extracted feature points
The average repeatability using SIFT, SURF, FAST and our approach were 44%, 39%, 35% and 49%, respectively. That is, our approach showed a higher reliability than the other detectors in all cases except one, and also on average. In addition, the RMS error is significantly lower. On the other hand, our approach extracts far less feature points, which, however, we see as advantage, since for positioning, we need only three point correspondences, so that a small number of points with a high quality is preferable.
4.2.2 Test between two LiDAR scans
Figure 12. The aligned point cloud using our approach (aligned point cloud in red, reference point cloud in green, both sides of the road)
As a second scan of the same location is available, we conducted the comparison to evaluate its influence on the alignment task. With the range image pairs generated from both LiDAR scans, we applied SIFT, SURF and our approach on these images to extract feature points. For SIFT and SURF, we used the detector and descriptor implementation offered by OpenCV (2014a). For our approach, we used Histogram of Oriented Gradients (HOG) (OpenCV, 2014b) as descriptor. With the keypoints and descriptors, the 2D, good matches were found using the Fast Library for Approximate Nearest Neighbours (FLANN) based matcher (OpenCV, 2014c). Afterwards, the 3D coordinates of the 2D good matches were found based on the correspondence table. Using only these matched 3D corresponding feature point pairs, we estimated the rotation and translation with 6 degrees of freedom. The scale The International Archives of the Photogrammetry, Remote Sensing and Spatial Information Sciences, Volume XLI-B1, 2016
was not taken into consideration (fixed at 1.0), because the point cloud datasets have the correct scale due to the LiDAR measurement principle. Afterwards, we applied this transformation on one of the LiDAR scans and obtained an aligned point cloud. The aligned LiDAR scan, which contains over 5 million points, is shown in Figure 12.
Figure 13. Distance between two LiDAR scans computed by CloudCompare (blue is 0 cm, green 10 cm and red 25 cm)
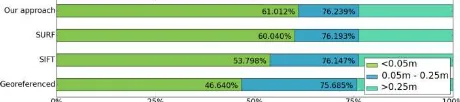
Then, we analysed the behaviour of each method with the following strategy. Although both of the scans were taken at the same area, there are still large differences because of moving pedestrians and vehicles, or the change of curtains behind the windows. After we computed the distance between two point clouds using CloudCompare (CloudCompare, 2015), we obtained the result shown in Figure 13. We can assume that point distances of 0.25 m or more are due to real differences between two laser scans, such as the walls (marked in red), which were not scanned in the other dataset. The goal of the alignment is to maximize the number of points which have close neighbours in the other scan. Therefore, we analyzed the histogram of all point cloud distances as shown in Figure 14 and used this to compare the given methods.
Figure 14. Point cloud alignment comparison between different methods
We set two thresholds: 0.05 m and 0.25 m. The lowest entry in the figure shows that 46.6% of the point distances are within 5 cm, using the initial geo-referenced datasets. With the alignment using 3D feature points extracted with different methods, the number of points which have a distance less than 5 cm is maximized. In the comparison, we found that our approach works slightly better than the other approaches, such as SIFT and SURF.
5. CONCLUSIONS
In this paper, we proposed a 3D feature point extraction method from range images. We firstly generated the range images from LiDAR point clouds by projection of the points. Then, we applied the Shi-Tomasi corner detector on these images to extract 3D feature point candidates. With a manually labelled dataset, we trained a neural network, using a feature vector consisting of local shape, curvature value and normal vector z component. Using the trained neuronal network, we are able to predict 3D feature points for other datasets measured in similar scenarios.
According to our evaluation, our approach produces a smaller number of feature points, which have a higher quality in terms of repeatability and RMS error, compared to SIFT and SURF features. When we used the point correspondences to align two point clouds, our approach showed the best result. The tests indicate that the 3D feature points extracted by our approach have a great potential to be used as landmarks for the localization of vehicles.
In terms of future work, the next step is to test our approach with a proper 3D descriptor. The DOG descriptor we have used so far generally includes only the shape information on the range images. A robust and informative 3D descriptor is expected to improve the alignment between LiDAR scans.
REFERENCES
Bay, H., Ess, A., Tuytelaars, T. and Van Gool, L., 2008. Speeded-up robust features (SURF). Computer Vision and
Image Understanding, 110(3), pp. 346–359.
Besl, P. J. and McKay, N. D., 1992. A method for registration of 3d shapes. IEEE Trans. Pattern Anal. Mach. Intell., 14(2), pp. 239–256.
Bishop, C. M., 2006. Pattern recognition and machine learning. Springer, New York, pp. 225-249.
Brenner, C., 2010: Vehicle localization using landmarks obtained by a LIDAR mobile mapping system, Proceedings of the ISPRS Commission III Symposium on Photogrammetric
Computer Vision and Image Analysis, IAPRS, Vol. XXXVIII,
Part 3A, pp. 139-144.
Brenner, C. and Hofmann, S., 2012. Evaluation of automatically extracted landmarks for future driver assistance systems. In:
Advances in Spatial Data Handling and GIS, pp. 169–181.
CloudCompare, 2015. CloudCompare - Open Source Project http://www.danielgm.net/cc/doc/qCC/CloudCompare%20v2.6.1 %20-%20User%20manual.pdf (1 Apr. 2016).
Harris, C. and Stephens, M., 1988. A combined corner and edge detector. In: Proceedings of the 4th Alvey Vision Conference, pp. 147–151.
LeCun, Y., Boser, B., Denker, J. S., Henderson, D., Howard, R. E., Hubbard, W., and Jackel, L. D., 1989. Backpropagation applied to handwritten zip code recognition. Neural
computation, 1(4), pp. 541–551.
Lowe, D. G., 2004. Distinctive image features from scale-invariant key- points. International Journal of Computer Vision, 60(2), pp. 91–110.
Mian, A., Bennamoun, M., and Owens, R., 2010. On the repeatability and quality of keypoints for local feature-based 3d object retrieval from cluttered scenes. International Journal of
Computer Vision, 89(2-3), pp. 348–361.
Myronenko, A., Song, X., and Carreira-Perpinán, M. A., 2006. Non-rigid point set registration: Coherent point drift. In:
Advances in Neural Information Processing Systems 19, pp.
1009–1016.
OpenCV, 2014a. Feature Detection and Description http://open cv-python-tutroals.readthedocs.org/en/latest/py_tutorials/py_fea The International Archives of the Photogrammetry, Remote Sensing and Spatial Information Sciences, Volume XLI-B1, 2016
ture2d/py_table_of_contents_feature2d/py_table_of_contents_f eature2d.html (1 Apr. 2016).
OpenCV, 2014b. Object Detection – HOGDescriptor http:// docs.opencv.org/2.4/modules/gpu/doc/object_detection.html (1 Apr. 2016).
OpenCV, 2014c. Feature Matching with FLANN http://docs. opencv.org/2.4/doc/tutorials/features2d/feature_flann_matcher/f eature_flann_matcher.html (1 Apr. 2016).
PCL, 2014. Estimating Surface Normals in a PointCloud http://pointclouds.org/documentation/tutorials/normal_estimatio n.php (1 Apr. 2016).
Riegl, 2012. Riegl vmx-250 datasheet http://www.gb-geod ezie.cz/wp-content/uploads/2016/01/DataSheet_Riegl_VMX-250.pdf (1 Apr. 2016).
Rublee, E., Rabaud, V., Konolige, K. and Bradski, G., 2011. ORB: an efficient alternative to SIFT or SURF. In: Proceedings
of the IEEE International Conference on Computer Vision, pp.
2564–2571.
Schlichting, A. and Brenner, C., 2014. Localization using automotive laser scanners and local pattern matching. In:
Intelligent Vehicles Symposium Proceedings, 2014 IEEE, pp.
414–419.
Scipy, 2013. Scipy optimize fmincg http://docs.scipy.org/doc /scipy/reference/generated/scipy.optimize.fmin_cg.html (1 Apr. 2016).
Shi, J. and Tomasi, C., 1994. Good features to track. In: Computer Vision and Pattern Recognition, 1994. Proceedings CVPR’94., 1994 IEEE Computer Society Conference on, pp. 593–600.
Tombari, F., 2013. How does a good feature look like - pcl tutorial at icra 2013 http://www.pointclouds.org/assets/icra2013 /pcl_features_icra13.pdf (1 Apr. 2016).
Urban, S., and Weinmann, M., 2015. Finding a Good Feature Detector-Descriptor Combination for the 2d Keypoint-Based Registration of TLS Point Clouds. ISPRS Annals of Photogrammetry, Remote Sensing and Spatial Information
Sciences, II-3/W5, pp. 121-128.
Zhong, Y., 2009. Intrinsic shape signatures: A shape descriptor for 3d object recognition. In: 2009 IEEE 12th International
Conference on Computer Vision Workshops (ICCV Workshops),
pp. 689–696.