IMAGE QUATY ASSESSMENT FOR VHR REMOTE SENSING IMAGE
CLASSIFICATION
Zhipeng LIa,b , Li SHENa,b Linmei WUa,b
a State-province Joint Engineering Laboratory of Spatial Information Technology for High-speed Railway Safety, Southwest Jiaotong University, Chengdu, 611756 , P.R. China - [email protected], [email protected], [email protected]
b Faculty of Geosciences and Environmental Engineering, Southwest Jiaotong University, Chengdu, 611756 , P.R. China - [email protected], [email protected], [email protected]
Commission VII, WG VII/4
KEY WORDS: Image quality assessment, image texture analysis, Image classification
ABSTRACT:
The data from remote sensing images are widely used for characterizing land use and land cover at present. With the increasing availability of very high resolution (VHR) remote sensing images, the remote sensing image classification becomes more and more important for information extraction. The VHR remote sensing images are rich in details, but high within-class variance as well as low between-class variance make the classification of ground cover a difficult task. What’s more, some related studies show that the quality of VHR remote sensing images also has a great influence on the ability of the automatic image classification. Therefore, the research that how to select the appropriate VHR remote sensing images to meet the application of classification is of great significance. In this context, the factors of VHR remote sensing image classification ability are discussed and some indices are selected for describing the image quality and the image classification ability objectively. Then, we explore the relationship of the indices of image quality and image classification ability under a specific classification framework. The results of the experiments show that these image quality indices are not effective for indicating the image classification ability directly. However, according to the image quality metrics, we can still propose some suggestion for the application of classification.
1. INTRODUCTION
With the increasing availability of high resolution remote sensing images, remote sensing image classification for characterizing land cover and land use has been widely used. Simply speaking, there are two means of classification: manual interpretation and computer classification. However, without enough experience and a long period, manual interpretation is hard for application rapidly and efficiently. At present, remote sensing image classification based on statistical pattern recognition techniques is one of the most often used means of information extraction (Narumalani et al, 2002). As an important way for information extraction, there are a number of challenges that are specific to a given domain. The spectral and spatial information from VHR remote sensing images are rich in great detail, there are still negative factors for image classification ability such as the complexity of the earth's surface, the methods of image classification and so on. One of the most important factors is the quality of the images. For image classification application, the selection of the appropriate remote sensing images has been a huge challenge.
Influenced by the platform, sensors and imaging environment, the ground objects cannot be fully expressed in remote sensing images. Noise and blur also have a negative effect on the image quality for interpretation. Moreover, the VHR images not only have abundant spectral and spatial information, but also have the characteristics that contain diversity of information sources, variable target structure and the interference of complex background (zhao et al, 2003). Therefore, the finer spectral and spatial information of the VHR images may also lead to the difficulty of the image interpretation. In order to get a better classification results, the quality of the VHR remote sensing images should be discussed at first.
Corresponding author
At present, the image quality is described from the perspective of the human eye perception in most of the literature (Wang et al, 2006). The definition of image quality is based on fidelity, perception and aesthetics (Ciocca et al, 2014). Image quality assessment is mainly used for monitoring quality of image-processing systems, benchmarking image-image-processing algorithms and optimizing parameter settings for image-processing systems (He et al, 2014). As for the remote sensing images, image quality assessment is based on the semantic content of images, visual aesthetic and practical application (Chandler et al, 2013). Huang (2014) describes the image quality from an information extraction perspective, and compares it with the traditional method. From the user-oriented perspective, Li (2014) describes image quality assessment by comparing ZY-3 satellite imagery with quick-bird satellite images. However, very few articles show the relationship of the image quality and the information extraction. The above studies motivate us to go further in the exploration of this relationship.
The rest of this paper is structured as follows. Section II presents the factors of classification ability, the index selection for the image quality and the image classification ability of VHR remote sensing images. The experiment result will be shown and analysed in Section III. Finally, we will conclude in Section V.
2. METHODOLOGY
For the sake of exploring the quantitative relationship between the image classification ability and the image quality, some indices should be selected for image quality assessment and classification ability, and the relationship should be discussed under a specific classification framework.
2.1 Index selection for image quality and classification ability
In order to describe the image classification ability and the image quality objectively, appropriate indices should be selected at first.
2.1.1 Selection of the Image quality indices
Remote sensing image quality evaluation can be divided into qualitative and quantitative assessment (Baraldi et al, 2015). The disadvantages of the qualitative evaluation are expensive, time-consuming and subjective. Consequently, the quantitative quality assessment for images is widely used. The way of image quality evaluation includes direct and indirect methods. Direct evaluation refers to the direct measurement methods for the quality of image itself. Indirect evaluation refers to the measurement of image information loss in the process of acquisition, storage and image-processing. Then, the selection of the image quality metrics are discussed in two aspects: satellite image itself and the information loss.
The quality of image itself impacts on the image classification ability. From the perspective of image classification application, spectral and spatial signatures and information extraction ability are taken into account. Spectral statistical metrics include gray histogram, discrete degree of spectrum and so on. These metrics such as average gradient (AG) and standard deviation (SD) can reflect the content and complexity of image information. Big standard deviation or average gradient means big difference between classes in some extend and is good for image classification. As for VHR remote sensing image, the classification methods based on spectrum merely are insufficient. Spatial statistical characteristics such as textures and structures are considered into the image classification algorithm. Spatial statistical metrics are good for texture analysis and improving the classification results, such as angular second moment (ASM), contrast (CON), homogeneity (HOM), entropy (ENT) (Haralick et al, 1973).
The change of the image quality always occurs in the process of image acquisition, storage and image-processing. Particularly, information loss reduces the ability of imagery interpretation in some extent. For example, image resampling happens in the process of geometric correction and image compression. The information lost in the process reduces the classification ability. Affected by platform tremor or the atmospheric environment, remote sensing images suffer from a certain degree of fuzzy and noise. The reduction of the image quality have great influence on the classification application. For this type of negative factors, this study introduces some metrics such as signal-to-noise ratio (PSNR), structural similarity metric (SSIM) of quality evaluation, and so on. This kind of methods need reference images, the main quality indexes includes PSNR and SSIM (Wang et al, 2003).
2.1.2 Selection of the classification ability indices
Influenced by multiple factors, image classification results contain errors inevitably. How to identify the sources of error, minimize errors and ensure the credibility of classification results is the necessary step to use classification thematic map before making decisions and scientific research. Therefore, quantitative indices should be considered to describe the classification ability. Many quantitative descriptions of classification accuracy are discussed in remote sensing field. At present, the evaluation index obtained from confusion matrix is still used widely (Foody et al, 2008). Conformity assessment is introduced to provide unbiased classification accuracy.
In order to evaluate the classification accuracy accurately, remote sensing image classification results compared with the ground-truth are used to get confusion matrix. The main classification accuracy indices contain overall classification accuracy, kappa coefficient, mapping accuracy, user accuracy, commission and omission. The overall classification accuracy refers to the right classification rate of the object category. But the outcome assessment is contingency, a particular category happens to fall in the right area. In order to compensate for the effect of expectation consistency, kappa should be used as evaluation criterion, and its advantage is effective to distinguish the different classification results.
2.2 The classification framework for the relationship exploration
In the classification application, the accuracy indices are not enough for evaluating the classification ability. The relationship of image quality and image classification ability should be discussed in certain situations. In addition to the image quality, the image classification ability is also affected by the Image classification system. The classification results are influenced by the factors such as scenarios, the category system and algorithms. According to different application, the design of the classification scheme is determined by the characteristic of classification problem, the feature of physical properties in the study area and prior knowledge (zhao et al, 2003).
The complexity of image scene changed, the image classification ability may present a strong uncertainty. High within-class variance as well as low between-class variance make VHR remote sensing image classification a difficult task. In most remote sensing images, the ground objects within the coverage of images are not homogeneous, but the classification result is determined by the characters of the main features. Therefore, images should be divided into different scenarios when we explore the relationship of image quality and classification ability.
Different ways of ground objects discriminant affect the image classification ability. In the design of classification framework, the classes should be mutually exclusive, exhaustive, and hierarchical (Jensen, 1986). For example, buildings and roads are difficult to discriminate from each other as two classes, but they may be easy to identify from the vegetation as artificial cover. Therefore, image scene should be discussed when we explore the relationship of image quality and classification ability.
The algorithm is an important factor for the accuracy of image classification. With the increasing availability of VHR remote sensing images, it is a challenge for image classification. Spatio-contextual Information plays a very important role in recent algorithm developing, such as algorithms with markov random fields modeling and object-based image analysis(Li et al, 2014). Therefore, the algorithms should be discussed when we explore the relationship of image quality and classification ability.
Above all, for the objective evaluation of the classification ability, the factors such as semantic hierarchy,classification algorithms and image scene should be taken into account. A specific classification framework is necessary before exploring the relationship between image quality indices and the classification ability indices.
3. EXPERIMENTAL AND ANALYSIS
3.1 Experiment Data
Worldview images in Zhengzhou, China, are chosen for image quality assessment due to its various area types and ground objects. We choose 20 simple scenario images in rural area and 20 complex scenario images in urban area. Many kinds of ground objects are contained in the image data, which was acquired on December 29, 2010, with a size of 800 800 pixels and 2m spatial resolution, as shown in Figure 1.
(a) rural area1 (b) rural area2
(c) urban area1 (d) urban area2 Figure 1. 20 simple scenario images in rural area, such as (a)
and 20 complex scenario images in urban area, such as (c).
3.2 Experiment and Analysis
For exploring the relationship between image quality and the classification accuracy, the experiments of the study are designed in a framework as Figure 2.
Figure 2. Framework for the relationship exploration of the image quality and classification ability.
Influence factors of the classification ability should be verified at first. Then, image quality indices for satellite image itself and the information loss are taken into account.
3.2.1 Influence factors of the classification ability except image quality
A. Image scene
Using the same classification algorithm and classified in the same semantic hierarchy, the relationship of the image quality index and classification accuracy is discussed in two kinds of selected scenarios: images with complex scene in urban areas and images with simple scene in rural areas.
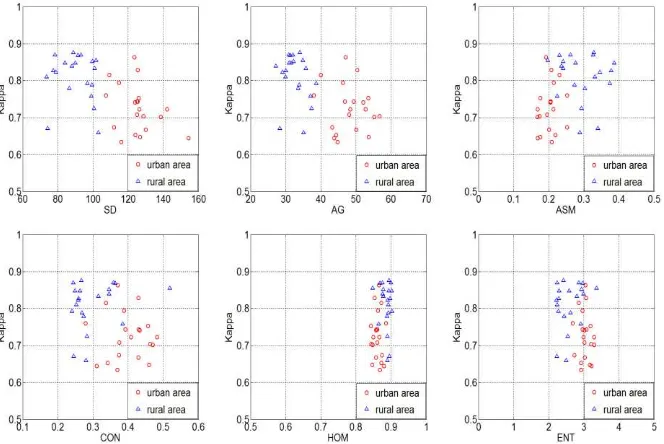
Figure 3. The relationship of the quality index and classification accuracy in different scenarios.
As shown in Figure 3, the relationship of the quality index and classification accuracy is affected by the image scenarios. Compared with the images in rural area, the standard deviation
and average gradient are bigger than the images in urban area. It reflects the high internal complexity of the images in urban area.
Classification ability Image quality
Image scene Semantic hierarchy Classification algorithm Image itself
Information loss
Indices of Image quality
Indices of Classification ability
Relationship model Quantitative description
However, there is no obvious relationship between the quality index and classification accuracy in any areas. With the change of the image scene complexity, the ability of image classification has a strong uncertainty.
B. Semantic hierarchy
Using the same classification algorithm to classify the images in rural areas, the relationship of the quality indices and classification accuracy is discussed under the different semantic interpretation levels.
Figure 4. The relationship of the quality index and classification accuracy in different semantic hierarchies.
As shown in Figure 4, the relationship of the quality index and classification accuracy is affected by the image scenarios. Different division of the object categories gives rise to different image classification results. Compared with low resolution remote sensing image, small scale class division is better for VHR remote sensing image classification. For example, in rural area,the vegetation such as grass, shrub, forests and the crops is hard to distinguish each kind from the others in level2. When they are interpreted as vegetation in level1,it is easy to be
identified from the other class such as buildings. However, no matter in which semantic hierarchies, there is no obvious relationship between the quality index and classification accuracy.
C. Classification algorithm
The images in urban area are classified in the same semantic hierarchy, the relationship of the image quality indices and classification accuracy is discussed by the different algorithms.
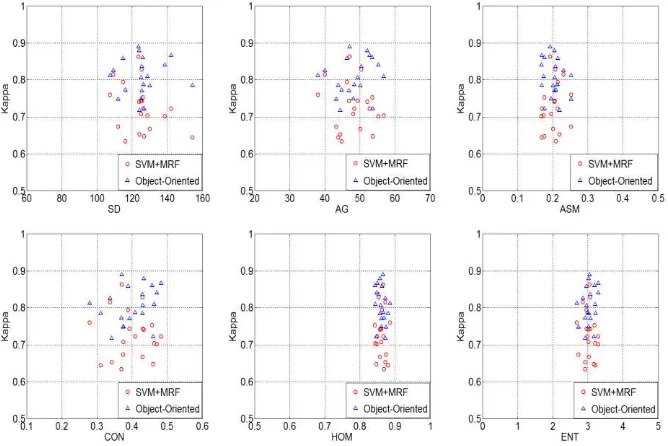
Figure 5. The relationship of the quality index and classification accuracy with different algorithms.
As shown in Figure 5, the relationship of the quality index and classification accuracy is influenced by the algorithms. With the development of machine learning and the resolution enhancement of the remote sensing images, lots of algorithms are published for image classification. At present, many available high-resolution image classification methods are for choice. However, essentially speaking, there is not a classification method absolutely superior to other methods. Then, algorithms must be taken into account when describing the image classification ability. In these urban areas, buildings and roads accounting for the main body,object oriented algorithm has a better performance for VHSR remote sensing images. It is a pity that there is no obvious relationship between the quality index and classification accuracy.
3.2.2 Relationship exploration under a specific classification framework
A. Quality of VHR remote sensing image itself
As shown in figure (3-5), with all the ground objects taken into account, there is no obvious relationship between the quality indices and classification accuracy metrics under a reasonable classification framework. And,the image classification ability should be described under a specific classification framework. Then,the images in urban area are classified into buildings and the other, with same algorithm and the similar image scene.
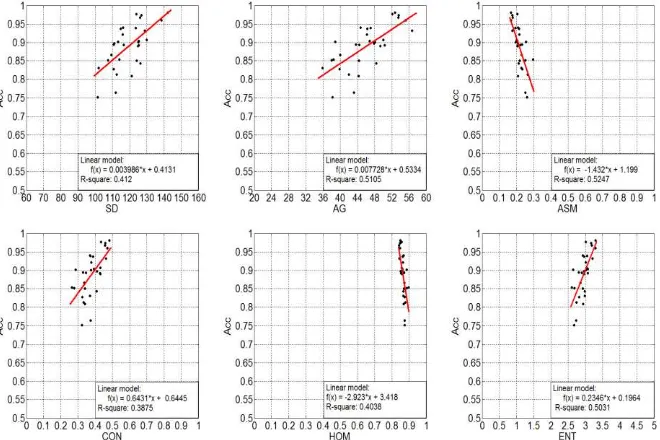
Figure 6. The relationship between the quality index of images in urban area and classification accuracy in the same classification system.
The R2 parameter of the regression equations are used to describe the linear relationship, a small value means a weak linear relationship. As shown in Figure 6, there is approximately a linear relationship between the buildings’ accuracy and the statistical indices of image quality. Though the R value is so 2 small and the correlation is very weak,the results show that Spatial and spectral statistical indices can describe the image classification ability in some extend.
B. Quality caused by information loss
In the process of the image acquisition, storage, image-processing, the phenomenon of noise and blur will occur. In order to study the influence of the information loss,two hundred images are simulated to study the relationship between the image quality and cassification accuracy. The original images are shown as figure1(c,d) in the urban areas.
Figure 7. Under the interference of noise and blur, the relationship of the Scale factor σ, PSNR, SSIM and Kappa.
As shown in Figure 7, there is obvious correlation between the spectral and spatial statistical indices and classification ability
metrics. With the decline of the PSNR, the classification accuracy is smaller sharply. However,it is on the basis of a
hypothesis that this process has been known. Without the clear process of the image-processing,it is hard to describe the image quality with the single quality index. For example, to the same image, the same PSNR may be caused by different process, and the classification accuracy will be different too.
4. CONCLUSION
In this paper, we systematically and objectively describe the remote sensing image quality and the image classification ability, and try to find the relationship between the image quality indices and classification accuracy metrics. As shown in these experiments, we find that there is correlation between image quality and classification ability in theory, but it is hard to describe the relationship quantitatively. The definition of image quality is mainly based on the practical purpose. Divorced from specific purpose,the quality index almost makes no sense. From the perspective of classification application, statistical and global indices are not enough to describe image quality, because image classification aims to get local information from images. Therefore, in order to get the relationship of image quality and classification ability, the next challenge work is to find appropriate indices to describe the global and local information at information level.
ACKNOWLEDGEMENTS
This work was supported by the National Basic Research Program of China (No. 2012CB719901), the National Natural Science Foundation of China (No.41401374), and the Program for Changjiang Scholars and Innovative Research Team in University (No.IRT13092).
REFERENCES
Narumalani, S., Hlady, J.T. and Jensen, J.R., 2002. Information extraction from remotely sensed data. Manual of Geospatial Science and Technology, pp.288-324.
Zhao, Y., 2003. Principles and Methods for Remote Sensing Application and Analysis. Beijing: Science Press, pp.413-416. Wang, Z. and Bovik, A.C., 2006. Modern image quality assessment. Synthesis Lectures on Image, Video, and Multimedia Processing, 2(1), pp.1-156.
Ciocca, G., Corchs, S., Gasparini, F. and Schettini, R., 2014. How to assess image quality within a workflow chain: an overview. International Journal on Digital Libraries, 15(1), pp.1-25.
He, L., Gao, F., Hou, W. and Hao, L., 2014. Objective image quality assessment: a survey. International Journal of Computer Mathematics, 91(11), pp.2374-2388.
Chandler, D.M., 2013. Seven challenges in image quality assessment: past, present, and future research. ISRN Signal Processing, 2013.
Huang, X., Wen, D., Xie, J. and Zhang, L., 2014. Quality assessment of panchromatic and multispectral image fusion for the ZY-3 satellite: From an information extraction perspective. Geoscience and Remote Sensing Letters, IEEE, 11(4), pp.753-757.
Li, L., Luo, H., She, M. and Zhu, H., 2014. User-Oriented Image Quality Assessment of ZY-3 Satellite Imagery. Selected Topics in Applied Earth Observations and Remote Sensing, IEEE Journal of, 7(11), pp.4601-4609.
Baraldi, A. and Humber, M.L., 2015. Quality Assessment of Preclassification Maps Generated From Spaceborne/Airborne Multispectral Images by the Satellite Image Automatic Mapper and Atmospheric/Topographic Correction-Spectral Classification Software Products: Part 1—Theory. Selected Topics in Applied Earth Observations and Remote Sensing, IEEE Journal of, 8(3), pp.1307-1329.
Haralick, R.M., Shanmugam, K. and Dinstein, I.H., 1973. Textural features for image classification. Systems, Man and Cybernetics, IEEE Transactions on, (6), pp.610-621.
Wang, Z., Bovik, A.C., Sheikh, H.R. and Simoncelli, E.P., 2004. Image quality assessment: from error visibility to structural similarity. Image Processing, IEEE Transactions on, 13(4), pp.600-612.
Foody, G.M., 2008. Harshness in image classification accuracy assessment. International Journal of Remote Sensing, 29(11), pp.3137-3158.
Jensen, J.R., 1986. Introductory digital image processing: a remote sensing perspective. Univ. of South Carolina, Columbus.
Li, M., Zang, S., Zhang, B., Li, S. and Wu, C., 2014. A review of remote sensing image classification techniques: the role of spatio-contextual information. European Journal of Remote Sensing, 47, pp.389-411.