MODELING THE SPATIAL DISTRIBUTION OF ESHNAN (
SEIDLITZIA ROSMARINUS
)
SHRUBS TO EXPLORING THEIR ECOLOGICAL INTERACTIONS IN DRYLANDS OF
CENTRAL IRAN
Y. Erfanifard a*, E. Khosravi a
a Dept. of Natural Resources and Environment, College of Agriculture, Shiraz University, Shiraz, Iran- [email protected],
KEY WORDS: Eshnan, Dryland, Modelling, Spatial distribution, Summary statistic, Irano-Turanian zone.
ABSTRACT:
Evaluating the interactions of woody plants has been a major research topic of ecological investigations in arid ecosystems. Plant-plant interactions can shift from positive (facilitation) to negative (competition) depending on levels of environmental stress and determine the spatial pattern of plants. The spatial distribution analysis of plants via different summary statistics can reveal the interactions of plants and how they influence one another. An aggregated distribution indicates facilitative interactions among plants, while dispersion of species reflects their competition for scarce resources. This study was aimed to explore the intraspecific interactions of eshnan (Seidlitzia rosmarinus) shrubs in arid lands, central Iran, using different summary statistics (i.e., pair correlation function g(r), O-ring function O(r), nearest neighbour distribution function D(r), spherical contact distribution function Hs(r)). The observed pattern of shrubs showed significant spatial heterogeneity as compared to inhomogeneous Poisson process (α=0.05). The results of g(r) and O(r)
revealed the significant aggregation of eshnan shrubs up to scale of 3 m (α=0.05). The results of D(r) and Hs(r) also showed that
maximum distance to nearest shrub was 6 m and the distribution of the sizes of gaps was significantly different from random distribution up to this spatial scale. In general, it was concluded that there were positive interactions between eshnan shrubs at small scalesand they were aggregated due to their intraspecific facilitation effects in the study area.
1. INTRODUCTION
Arid and semi-arid ecosystems seem to be very simple biotic communities, while there are complicated ecological interactions between woody plants with each other and with their environment. Investigation of these complicated ecological interactions that can be performed by spatial pattern analysis of plants has an important role in understanding the structure of these ecosystems (Lopez et al., 2010; Navarro-Cerrillo et al., 2013). Spatial pattern of plants in an ecosystem may be influenced by facilitation, seed dispersal, competition or environmental heterogeneity (Wiegand and Moloney, 2014). Facilitative interactions of plants are commonly observed in the environments with high levels of stress such as arid ecosystems, while competitive interactions between plants frequently happen in fertile ecosystems with gentle environmental conditions. Facilitation and competition of plants are two principle ecological interactions that leave significant footprints on the spatial distribution of plant species in arid and semi-arid ecosystems which can be revealed through point pattern analysis (Alvarez et al., 2011).A clumped pattern of plants often observed in arid environments indicates facilitation, while dispersed patterns occur more in environments which competition for scarce resources (e.g., water, light, soil nutrients in drylands) is the cause of the spatial distribution of plants and if the pattern is more similar to random, none of the competitive and facilitative influences are observed (Sher el al., 2010; Alvarez et al., 2011). The spatial distribution modeling of plants via different summary statistics is very useful to recognize horizontal structure of plant communities and understand how they are related to each other. The results of this analysis can provide information not only in little known regions but also for the management objectives of
* Postal Code: 7144165186, Shiraz, Iran. Tel. +98 71 36138162
other regions (Wiegand and Moloney, 2004; Lopez et al., 2010; Carrer et al., 2013).
Different summary statistics and functions explain different characteristics of spatial patterns of plants and it is essential to use more than one summary statistic to better understand the distribution of plants in an ecosystem (Wiegand et al., 2013). Some of the summary statistics such as the pair correlation function g(r), nearest neighbour distribution function D(r), and the spherical contact distribution Hs(r) are commonly used in the literature and some of them, e.g. O-ring statistic has been recently developed (Sher et al., 2010; Martinez et al., 2013).
Qehi protected area Study plot
IsfahanQehi protected area
Isfahan province
Persian Gulf Caspian Sea
According to the wide distribution of eshnan shrubs in arid and semi-arid ecosystems of Iran and Asia and its role in preventing desertification, investigation of intraspecific interactions of this plant species is of great importance in order to better understand its ecological structure and function in these ecosystems. Previous studies on the intraspecific interactions of eshnan shrubs is less considered. Therefore, the objective of this study is to detect the intraspecific interactions of eshnan shrubs in arid regions of Isfahan province in central Iran, via modeling their spatial distributions. Moreover, the type of these interactions (facilitation or competition) was also investigated.
2. METHODOLOGY
2.1 Study Area
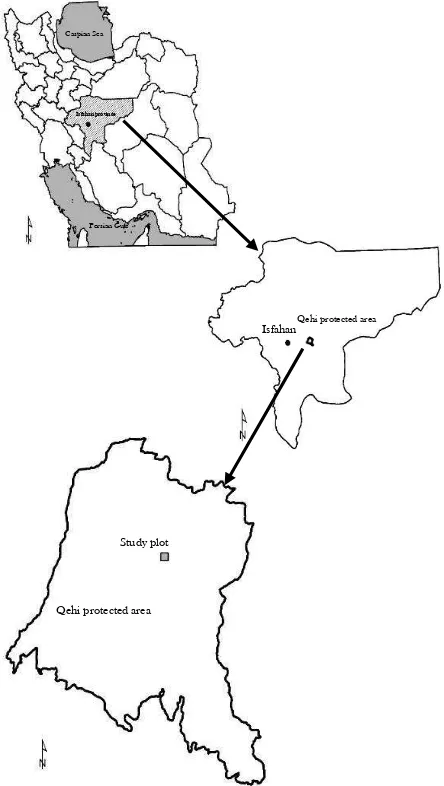
The study site was located in Qehi protected area, 60 km east of Isfahan city, Isfahan province, central Iran, between 52º 13´ to 52º 17´ E and 32º 38´ to 32º 39´ N (Figure 1). The mean elevation was 1544 m above sea level. The average of annual precipitation and temperature were 84.2 mm and 14.9 ºC, respectively. A 160 m × 160 m plot covered dominantly with eshnan shrubs (Figure 2) was selected for this study (Figure 3). Eshnan was accompanied by other species, i.e. saltcedar (Tamarix mascatensis) and Halostachys belangeriana in the area.
Figure 1. The study area in Isfahan province, Iran.
Modeling the spatial distribution of eshnan shrubs needs the point map of study plot, each point representing the spatial location of each eshnan in the observation window. Therefore, the point map of all 989 eshnan shrubs was obtained by Trimble R8 differential global positioning system (DGPS) with accuracy of 3 mm ± 0.1 ppm. In addition to location, height, two crown width (the widest and the perpendicular shortest) of each plant were measured.
Figure 2. A multi-stem eshnan shrub in Qehi protected area.
Figure 3. The study area covered by eshnan shrubs.
2.2 Homogeneity of the spatial pattern
Prior to investigate the spatial pattern of eshnan shrubs, it was necessary to assess homogeneity of distribution of the observed individual shrubs distributed in the study area. The distribution of eshnan shrubs was primarily compared to the null model of homogeneous Poisson process (complete spatial randomness CSR) and Kolmogorov-Smirnov nonparametric goodness-of-fit test was implemented to determine if two distributions were
significantly different (α=0.05) (Wiegand et al., 2013; Tsai et al.,
2015).
2.3 Summary statistics
2.3.1 Pair correlation function g(r): The pair correlation function g(r) (Eq. 1) is the most popular summary statistic for analyzing mapped point patterns in plant ecology which is based on the distribution of distances of pairs of points describing patterns across a wide range of spatial scales. It is the derivative
of Ripley’s K function and is defined as the expected density of
points at a given distance r of an arbitrary point (plant), divided by the intensity � of points (plants) in a pattern (Burns et al., 2013; Nguyen et al., 2014; Getzin et al., 2015).
g � =
π ���(1)
When the point pattern is random (CSR), g(r) equals to 1. Values of g(r) < 1 is for regularity and g(r) > 1 is for clustered patterns.
2.3.2 Nearest neighbour distribution function D(r): The nearest neighbour distribution function D(r), is the distribution function of the random distance from a typical point (plant) to its nearest neighbour in a pattern. It is widely used in combination with other summary statistics to reveal different characteristics of a point pattern (Eq. 2) (Baddeley et al., 2006; Illian et al., 2008).
���� � = � � = 1 − exp −λπr (2)
where ���� � is the nearest neighbour distance distribution in the case of stationary Poisson processes, r is the distance from the random point (plant) and � is the intensity of points (plants) in the study region. Values of D(r) < DPoi(r) demonstrates rejection between points (plants) whereas D(r) > DPoi(r) denotes attraction. The Hanisch estimator was used to correct the nearest neighbour edge effects.
2.3.3 Spherical contact distribution function Hs(r): The
spherical contact distribution function Hs(r), is similar to the nearest neighbour distance distribution function D(r) (Eq. 2) which is the distribution of the distances r from an arbitrary test location to the nearest point (plant) of the pattern. Hs(r) is a summary statistic that determines the empty spaces in a pattern thus it gives important information in point pattern analysis. Under CSR, Hs(r) is like that for D(r), but for clumped pattern, the distances from an arbitrary test location to the nearest point of the pattern is larger than under CSR and for dispersed pattern, it will be smaller (Illian et al., 2008; Wiegand and Moloney, 2014).
2.3.4 O-ring statistic: The O-ring statistic O(r) (Eq. 3) is related to the pair correlation function but uses annuli instead of circles. It gives the expected density of points in a ring with radius r from an arbitrary point (plant) in a pattern. One of the main advantages of using rings instead of circles is isolating specific distance classes in spatial pattern analysis (Wiegand and Moloney, 2004; Watson et al., 2007; Schleicher et al., 2011; Benot et al., 2013).
� � = �� � (3)
where λ is the intensity of the investigated pattern. For random distribution of points (plants) (CSR), O(r) = λ, O(r) > λ indicates aggregation of the pattern at distance r and values of O(r) < λ indicates regularity.
2.3.5 Confidence envelopes: Significant departure from the null model (CSR or heterogeneous Poisson process depending on the spatial distribution of eshnan shrubs in the study plot) was estimated using 199 Monte Carlo simulations and approximately 95% confidence envelopes were built by 5th lowest and 5th highest values of these simulations at each spatial scale r
(Nguyen et al., 2014).
3. RESULTS
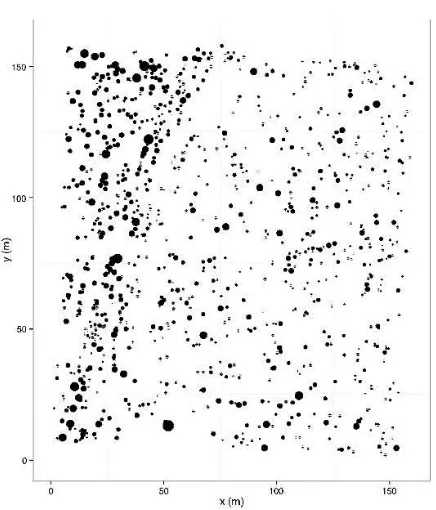
The observed spatial pattern of all 989 eshnan shrubs (Figure 4) was compared to the null model of homogeneous Poisson process and Kolmogorov Smirnov goodness of fit test revealed that the observed pattern followed the heterogeneous Poisson process (D = 0.0134 < D0.05 = 0.0461 and p-value = 0.0704). The quantitative characteristics also showed that eshnan shrubs had various crown areas while they were more similar in height (Table 1).
Mean crown area (m2)
Mean crown diameter (m)
Mean height (m) 0.9 (±0.645) 1.1 (±0.345) 0.8 (±0.189) Table 1. The quantitative characterization of eshnan shrubs (n =
989)
Figure 4. Map of the study area showing the spatial distribution of eshnan shrubs (n = 989) with different sizes based on their
crown size.
As eshnan shrubs were heterogeneously distributed in the study area, the inhomogeneous form of summary statistics, i.e. pair correlation function g(r), O-ring statistic O(r), nearest neighbour distribution function D(r), and spherical contact distribution function Hs(r) were applied to analyse the spatial pattern of all 989 shrubs in the study area.
Figure 5. The results of inhomogeneous pair correlation function g(r) at scales of 0-40 m for eshnan shrubs.
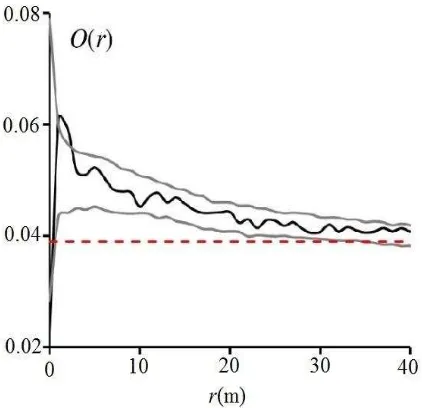
The results of inhomogeneous O-ring function showed the significant aggregation of eshnan shrubs at scales of 1-3 m (Figure 6). Moreover, it indicated aggregation at all other scales
(O(r) > λ) while it was not significant at other spatial scales.
Figure 6. The inhomogeneous O-ring statistic displayed significant aggregation of eshnan shrubs at scales of 1-3 m
(λ = 0.039).
For describing distances among eshnan shrubs in the study plot, the inhomogeneous nearest neighbour distance distribution function D(r) and the inhomogeneous spherical contact distribution function Hs(r) were applied. The D(r) indicated that the maximum distance to nearest shrub was 6 m and significant aggregation of eshnan shrubs at scales 1.5-3.5 m was revealed by the function (Figure 7). However, there was no difference between the observed distribution of eshnan shrubs and the null model at scales of 0-1 m and 5-8 m.
Figure 7. The inhomogeneous nearest neighbour distribution function D(r) displayed the aggregation of eshnan shrubs.
In addition, the results of inhomogeneous Hs(r) function showed that the sizes of gaps were significantly different from random distribution up to 6 m. The Hs(r) also determined the aggregation of eshnan shrubs which was significant at scales of 2.5-6.5 m.
Figure 8. The results of inhomogeneous spherical contact distribution function Hs(r) in spatial pattern analysis of eshnan
shrubs in the study plot.
4. CONCLUSION
important species with a wide distribution in Iran and Asia. To address this objective, we used the point pattern analysis via four summary statistics, i.e. g(r), O(r), D(r) and Hs(r) in order to investigate the intraspecific interactions of eshnan shrubs. A 160 m × 160 m plot with density of 386.3 shrub per hectare and mean elevation of 1549.2± 0.44 m above sea level was selected in Qehi protected area and all 989 eshnan shrubs were precisely mapped by Trimble R8 differential global positioning system (DGPS). Primarily, the spatial distribution of eshnan shrubs was compared to the null model of homogeneous Poisson process which has been increasingly applied in the literature (e.g., Getzin et al., 2008; Cisz et al., 2013; Nguyen et al., 2014) and Kolmogorov-Smirnov nonparametric goodness-of-fit test was used to analyse the significance of differences. The results showed that the distribution of eshnan shrubs was significantly heterogeneous. Despite the relatively homogeneous conditions (e.g., land form, soil conditions, and the structure of vegetation cover) of the study plot, the small-scale environmental changes (such as salinity and humidity as two important factors in the establishment and growth of eshnan) might be the reasons for their inhomogeneous distribution. In addition, it was essential to use suitable summary statistics which consider the environmental heterogeneity (Illian et al., 2008).
The summary statistics used in this study (the heterogeneous g(r),
O(r), D(r) and Hs(r) functions) described different aspects of the intraspecific interactions of eshnan shrubs in the plot. The pair correlation function g(r) indicated aggregation of eshnan shrubs at scales 0-9 m which it was significant at scales of 0-3 m (Figure 5). This function also indicated that the density of eshnan shrubs at distance of 2 m is 1.3 times more than random distribution of these plants. The O-ring statistic showed the significant aggregation of eshnan shrubs up to scales of 3 m. In spite of g -function, the O-ring statistic also showed the aggregation of eshnan shrubs at all scales (Figure 6). Compared to Ripley's K- and L-functions, the g-function and the O-ring statistic have non- cumulative properties thus provide a better assessment of point patterns across specific spatial scales and have been approved in the literature (Sher et al., 2010; Lopez et al., 2010; Churchill et al., 2013; Navarro-Cerrillo et al., 2013; Wiegand and Moloney, 2014).
Although g(r) and O(r) showed the positive intraspecific interactions of eshnan shrubs, the distribution of distance to nearest neighbour of them was also investigated by the nearest neighbour functions (i.e., D(r) and Hs(r)). The D(r) is an appropriate method to describe the neighbourhood relationships of plants which indicated that maximum distance to nearest shrub was 6 m and all eshnan shrubs had a neighbour within this scale in the study plot. Moreover, D(r) detected the significant aggregation of eshnan shrubs at scales of 1.5-3.5 m (Figure 7). This function that provide information on the local neighbourhood, is usually used in combination with other characteristics in point pattern analysis (Illian et al., 2008; Ni et al., 2014). Similar to D(r), the Hs(r) is another important function to analyse the spatial interactions of plants by showing the distribution of empty spaces between them (Wiegand and Moloney, 2014). The results of Hs(r) indicated that the distribution of the sizes of gaps was significantly different from random distribution up to 6 mand it also revealed the aggregation of eshnan shrubs which was significant at scales of 2.5-6.5 m (Figure 8). Hence, eshnan shrubs had strong relationships with each other as there were less gaps between them compared to the gaps in a random distribution.
In conclusion, the summary statistics applied to model the spatial distribution of eshnan shrubs in drylands of central Iran identified the significant aggregation of eshnan shrubs in the study plot and revealed the positive ecological interactions of the plants with one another. The adult plants facilitated the establishment of
young seedlings close to them and formed clusters of eshnan shrubs that were revealed through the results of different summary statistics. In this investigation, nearest neighbour (i.e.,
D(r) and Hs(r)) and univariate second-order (i.e., g(r) and O(r)) summary statistics were implemented that were not structurally similar and could characterize different aspects of spatial distribution of eshnan shrubs in the study plot.
REFERENCES
Abdollahi, J., Arzani, H., Baghestani, N. and Askarshahi, F.S.M., 2006. Rainfall and ground water table changes influencing the
Seidlitzia rosmarinus growth and development at the Chah-Afzal Ardakan. Iranian Journal of Range and Desert Region, 13(2), pp. 74-81.
Alvarez, L.J., Epstein, H.E., Li, J. and Okin, G.S., 2011. Spatial patterns of grasses and shrubs in an arid grassland environment.
Ecosphere, 2(9), pp. 1-6.
Amiraslani, F. and Dragovich, D., 2011. Combating desertification in Iran over the last 50 years: An overview of changing approaches. Journal of Environmental Management, 92, pp. 1-13.
Anonymous, 2009. Qehi rangeland management plan, Isfahan province. Isfahan Natural Resources Organization, 37 p.
Baddeley, A., Gregori, P., Mateu, J., Stoica, R. and Stoyanm D., 2006. Case Studies in Spatial Point Process Modeling. Springer, New York, 328 p.
Baghestani Maybodi, N. and Zare, M.T., 2009. Some ecological requirements and exploitation of Seidlitzia rosmarinus in the desert region of Yazd province. Iranian Journal of Environmental Sciences, 6(3), pp. 31-42.
Benot, M.L., Bittebiere, A.K., Ernoult, A., Clement, B. and Mony, C., 2013. Fine- scale spatial patterns in grassland communities depend on species clonal dispersal ability and interactions with neighbours. Journal of Ecology, 101, pp. 626-636.
Burns, S.L., Goya, J.F., Arturi, M.F., Yapura, P.F. and Perez, C.A., 2013. Stand dynamics, spatial pattern and site quality in
Austrocedrus chilensis forests in Patagonia, Argentina. Forest Systems,22, pp. 170-178.
Carrer, M., Soraruf, L. and Lingua, E., 2013. Convergent space-time tree regeneration patterns along an elevation gradient at high altitude in the Alps. Forest Ecology and Management, 304, pp. 1-9.
Churchill, D., Larson, A., Dahlgreen, M., Franklin, J., Hessburg, P. and Luts, J., 2013. Restoring forest resilience: from reference spatial patterns to silvicultural prescriptions and monitoring.
Forest Ecology and Management, 291, pp. 442-457.
Cisz, M.E., Falkowski, M.J. and Orr, B., 2013. Small-scale spatial pattern of Copernicia alba morong near Bahia Negra, Paraguay. Natural Resources, 4, pp. 369-377.
Deymeh, H., Shadizadeh, S.R. and Motafakkerfard, R., 2012. Experimental investigation of Seidlitzia rosmarinus effect on oil-water interfacial tension: Usable for chemical enhanced oil recovery. Scientia Iranica, 19(6), pp. 1661-1664.
from crown areas. Forest Ecology and Management, 255, pp. 2478-2485.
Getzin, S., Wiegand, K., Yizhaq, H., Hardenberg, J. and Meron, E., 2015. Adopting a spatially explicit perspective to study the mysterious fairy circles of Namibia. Ecography, 38, pp. 1-11.
Hadi, M. R., 2009. Biotechnological potentials of Seidlitzia rosmarinus: A mini review. African Journal of Biotechnology, 8(11), pp. 2429-2431.
Illian, J., Penttinen, A., Stoyan, H. and Stoyan, D., 2008.
Statistical analysis and modelling of spatial point patterns. John Wiley & Sons Inc., Chichester, 534 p.
Jafari, M., Zare Chahouki, M.A., Tavili, A., Arzanivand, H. and Zahedi Amiri, G.H., 2004. Effective environmental factors in the distribution of vegetation types in Poshtkouh rangelands of Yazd province (Iran). Journal of Arid Environments, 56, pp. 627-641.
Kurkova, E.B., Kalinkina, L.G., Baburina, O.K., Myasoedov, N.A. and Naumova, T.G., 2002. Responses of Seidlitzia rosmarinus to salt stress. Biology Bulletin, 29(3), pp. 221-228.
Lopez, R.P., Larrea-Alcazar, D. and Zenteno-Ruiz, F., 2010. Spatial pattern analysis of dominant species in the Prepuna: Gaining insight into community dynamics in the semi-arid, subtropical Andes. Journal of Arid Environments, 74, pp. 1534-1539.
Mahdavi Ardakani, S.R., Jafari, M., Zargham, N., Zare Chahouki, M.A., Baghestani Maybodi, N. and Tavili, A., 2011. Investigation on the effects of Haloxylon aphyllum, Seidlitzia rosmarinus and Tamarix aphylla on soil properties in Chah Afzal Kavir (Yazd). Iranian Journal of Forest, 2(4), pp. 357-365.
Mahmoodi, T., Khoshhal, J., Mousavi, S.H. and Pourkhosravani, M., 2013. A comparative evaluation of adaptation of nebkas to stabilize sand dunes of the desert in Sirjan using AHP model.
Iranian Journal of Environmental Erosion Researches, 2(10), pp. 24-38.
Martinez, I., Taboada, F.G., Wiegand, T. and Obeso, J.R., 2013. Spatial patterns of seedling-adult associations in a temperate forest community. Forest Ecology and Management, 296, pp. 74-80.
Navarro-Cerrillo, R., Manzanedo, R., Bohorque, J., Sanchez, R., Sanchez, J., Miguel, S., Solano, D., Qarro, M., Griffith, D. and Palacios, G., 2013. Structure and spatio-temporal dynamics of cedar forests along a management gradient in the Middle Atlas, Morocco. Forest Ecology and Management, 289, pp. 341-353.
Ni, R., Baiketuerhan, Y., Zhang, C., Zhao, X. von Gadow, K., 2014. Analysing structural diversity in two temperate forests in northeastern China. Forest Ecology and Management, 316, pp. 139-147.
Nguyen, H., Wiegand, K. and Getzin, S., 2014. Spatial patterns and demographics of Streblus Macrophyllus trees in a tropical evergreen forest Vietnam. Journal of Tropical Forest Science, 26(3), pp. 309-319.
Safdari, V., 2012. Anatomical, physical and chemical properties of Seidlitzia rosmarinus Bunge ex Boiss wood in Irano-torani region. Iranian Journal of Wood and Paper Science Research, 27(2), pp. 212-225.
Sagheb-Talebi, K., Sajedi, T. and Pourhashemi, M., 2014.
Forests of Iran. Springer, Heidelberg, 160 p.
Sher, A.A., Wiegand, K. and Ward, D., 2010. Do Acacia and
Tamarix trees compete for water in the Negev desert? Journal of Arid Environments, 74, pp. 338-343.
Tsai, C.H., Lin, Y., Wiegand, T., Nakazawa, T., Su, S.H., Hsieh, C.H. and Ding, T.S., 2015. Individual species area relationship of woody plant communities in a heterogeneous subtropical monsoon rainforest. PLoS ONE, 10(4), pp. 1-14.
Watson, D.M., Roshier, D.A. and Wiegand, T., 2007. Spatial ecology of a root parasite – from pattern to process. Austral Ecology, 32, pp. 359-369.
Wiegand, T. and Moloney, K.A., 2004. Rings, circles, and null-models for point pattern analysis in ecology. OIKOS, 104, pp. 209-229.
Wiegand, T., He, F. and Hubbell, S., 2013. A systematic comparison of summary characteristics for quantifying point patterns in ecology. Ecography, 36, pp. 092-103.
Wiegand, T. and Moloney, K.A., 2014. Handbook of spatial point-pattern analysis in ecology. CRC Press, New York, 538 p.