112 DOI: https://doi.org/10.5281/zenodo.1267830
Date of Publication: 5 June 2018 Volume 2 Issue 2, pp. 112-121
Quality Service Strategy In Improving Performance of Puskesmas
Service Area of Mranggen District
Nanang Wahyudin
Faculty of Economics, Bangka Belitung University, Indonesia [email protected]
Abstract
This study aims to analyze the quality of services available at the health center of Mranggen in order to formulate a strategy to improve the quality of health services of Puskesmas by analyzing the importance and level of performance in six dimensions of service quality (Tangibles, Reliability, Responsiveness, Assurance, Empathy and Accessibility) to produce performance (performance) that can satisfy customers. The data analysis of this research was conducted by qualitative descriptive method, to answer the problem formulation about how to improve the quality of health service of Mranggen in accordance with the quality standard set by the Government, then used "Importance-Performance Analysis" with Cartesian diagram, the number of samples of this study 75 respondents taken from three Puskesmas available at Puskesmas Mranggen. The result of the research shows that the dimension of Responsiveness is the main priority to improve the quality of service because it has the highest importance of 81.3%, while the performance is still low with the level of conformity of 71%, while the next sequence based on the level of conformity is Assurance dimension, Accessibility, Tangibles, Reliability, and Empathy. Thus the whole health center Mranggen considered good enough from the level of customer satisfaction.
Keywords: Tangibles, Reliability, Responsiveness, Assurance, Empathy, Accessibility, Service Performance
1.
Introduction
Health services to all citizens are the responsibility of the government by the mandate of legislation (Law No. 36 of 2009). However, it has not been implemented well because there are still many complaints from the public about health services. That can be proven from several studies on the quality of service in government agencies. Quality of service delivery is a strategic pillar for the implementation of hospitals, especially for local government-owned hospitals in the decentralization era. It is ironic to find that the quality of services provided by the Regional General Hospital (RSUD) is still below the expectations of the community while the poor, disadvantaged members of the community desperately need quality services (Mulyana, 2015).
113
statistical processes are commonly used in other industries and have recently been proposed as a tool to improve service delivery and performance in public health environments (Boe, Debra Thingstad, 2009). Based on some research conducted by academics and bureaucrats about public services in Indonesia, the condition is still often "considered" not good and satisfactory. That is shown from the conclusions made by Agus Dwiyanto, et al. in GDS (Governance and Decentralization) 2002 in 20 provinces in Indonesia on the performance of public services mentions "... in general the practice of public service delivery is still far from the principles of good governance. Then the performance of the public bureaucracy service in Indonesia, based on a report from The World Competitiveness Yearbook in 1999 is in the group of countries that have the lowest competitiveness index among the 100 most competitive countries in the world (Cullen and Cushman, in Dwiyanto, et al., 2002).
According Dwiyanto (2001) states about the performance of public service bureaucracy:
"The low performance of the public bureaucracy is strongly influenced by the still strong paternalism culture, which tends to encourage bureaucratic officials to be more oriented towards mastery rather than service, positioning themselves as rulers and treating service users as an object of service in need of assistance. Also, low performance is caused by a power-sharing system that tends to focus on leadership. The hierarchical, bureaucratic structure encourages a concentration of power and authority on the superior so that bureaucratic officials directly linked to service users often do not have adequate authority to respond to the evolving dynamics in service delivery".
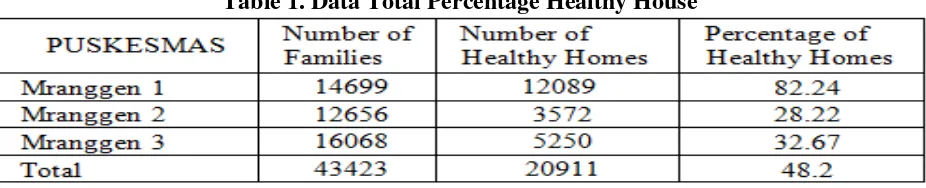
The poor performance of public services is partly due to the lack of transparency and accountability in the implementation of public services. Therefore public services must be implemented in a transparent and accountable manner by each unit of government agency services because the performance quality of public service bureaucracy has widespread implications in achieving public welfare. Given the type of service is very diverse with different characteristics, then fulfilling the service required guidelines used as a reference for agencies within the environmental health agencies. Puskesmas Mranggen located in Demak Regency is a health service provider with the working area covering all districts of Mranggen consisting of (three) Puskesmas namely Mranggen I, Mranggen II, Mranggen III. Based on Table 1. we can see the condition of the population from the work area of Puskesmas Mranggen based on the percentage of the number of healthy houses.
Table 1. Data Total Percentage Healthy House
Source: Demak Regency Health Office, 2017
114
number of people in need of health services in health centers Mranggen. Very much needed health services by the community Mranggen, of course, is expected is a quality health service and give the satisfaction that can improve the health status of the community especially in the region Mranggen. To see the number of people using health services from 2014 - 2016 at the public health center in Mranggen can be seen in the following table of patient visits:
Table 2. Patient Visiting Data
Source: Demak Regency Health Office, 2017
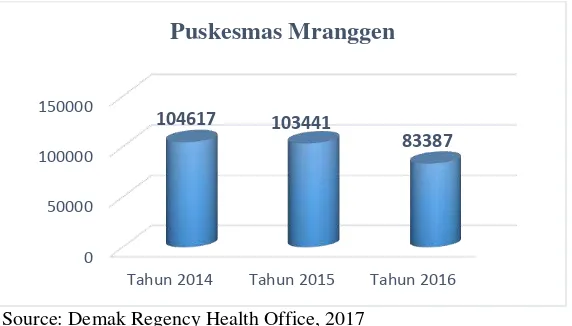
Based on data in Table 2, it can be seen that Puskesmas Mranggen1 experience fluctuation of the patient visit, and at Puskesmas Mranggen 2 decrease number of visit whereas at Puskesmas Mranggen 3 increase of patient visit number from year to year. However, for the overall number of patient visits at Puskesmas Mranggen can be seen in Figure 1 below:
Source: Demak Regency Health Office, 2017
Figure 1. Overall Patient Visitor Data Chart
Based on Figure 1, it can be seen that the overall number of patient visits at Puskesmas in Mranggen decreased from year to year. So contrary to the number of healthy homes that only 48.2% means that the need for health services is essential but the number of visits at Puskesmas Mranggen decreased and based on the results of preliminary interviews (pre-survey) with some visitors in the health center Mranggen many complained about the service given in relation to some of the above-mentioned service quality indicators. One of the visitors said that to get free service facility in Puskesmas is not as easy as imagined, it is proved by the requirement required to bring a certificate issued by local urban village, even though the information is not socialized to the visitor either in the form of announcement or circular to each RT \ RW.
Another visitor recounted his experience while doing the treatment at Puskesmas Mranggen, the readiness of both administrative and medical personnel is very poor so often patients must be willing to wait to get health services. Also, the available facilities such as waiting room that is less comfortable cause the patient often feels abandoned, for that this research formulate a
0 50000 100000 150000
Tahun 2014 Tahun 2015 Tahun 2016
104617 103441
115
strategy to improve the quality of patient service that impact on the improvement of health institutions performance that ultimately can improve the degree of public health.
2.
Literature Review
Quality of Service
According to Lukman (1999), the conventional definition of quality usually describes the direct characteristic of a product such as: the needs of customers). Understanding quality basically refers to the basic understanding: a. Quality consists of some product features, both direct features and attractive features that
satisfy customer needs and thus satisfy the use of the product.
b. Quality consists of everything that is free from deficiencies or damage.
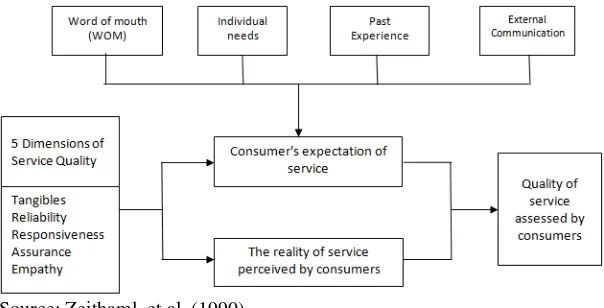
Furthermore, in relation to service, according to Zeithaml, Parasuraman, Berry (2006). To know the quality of service perceived significantly by consumers, there are indicators of customer satisfaction measure that lies in the five dimensions of service quality. The five Servqual dimensions include the following:
1. Tangibles (service quality in the form of physical office facilities, computerized administration, waiting room and place of information). This dimension relates to the modernity of the equipment used, the attractiveness of the facilities used, the neatness of the officers and the completeness of supporting equipment (pamphlet, announcement).
2. Reliability (ability and reliability to provide reliable service). Dimensions relate to the promise of accomplishing something as desired, handling customer complaints, performing the right service, providing timely service as promised and fixing the demand for recording errors.
3. Responsiveness (the ability to help and provide services quickly and accurately, and responsive to the desires of consumers). These dimensions include notification from the officer to the consumer about the services to be provided, the delivery of services quickly, the willingness of the officers to assist consumers and officers never feel busy to serve consumer demand.
4. Assurance (ability and hospitality and courtesy of officers in ensuring consumer confidence). This dimension is related to the behavior of officers who remain confident so that consumers feel safe will the ability of officers and can answer consumer questions.
5. Empathy (firm but the attentive attitude of the officer to the consumer). This dimension includes, among others, the giving of individual attention to the consumer, the timeliness of service to all consumers, the company has officers who pay special attention to the consumers, the essential service of consumers and officers who understand the specific needs of its customers.
116
Source: Zeithaml, et al. (1990)
Figure 2. Assessment of Service Quality by Consumer
Service Performance
According to Hoffman and Beteson (1997) without customers, service companies have no reason to operate. Meanwhile, according to Mowen (2002), Customer satisfaction is defined as the overall attitude regarding goods or services after the acquisition and use of the value of price relations. Performance can be viewed as a process or a result of work. Performance is a process of how work takes place to achieve work. However, the work itself also shows performance (Wibowo, 2011). Armstrong and Baron in Wibowo (2011) define performance as a result of work that has a strong relationship with organizational strategic goals, consumer satisfaction, and economic contribution. Based on the definition, it can be concluded that there is a strong relationship between performance and customer satisfaction
Puskesmas Management Performance
Puskesmas management performance is measured by two main conceptions of efficiency and effectiveness. According to Drucker (2008), efficiency is doing all the work right (doing the jobs right), while effectiveness is doing all the right jobs. Efficiency (effectiveness) of Puskesmas is the process of exploiting, saving and pushing of Puskesmas resources by doing the job properly, while effectiveness (the result of use) of Puskesmas is the success level of achievement of the purpose of Puskesmas by way of doing the right job. The effectiveness of Puskesmas also means being able to achieve the purpose of Puskesmas well. If efficiency is more focused on the process of utilization of savings and empowerment of resources (input), then the effectiveness is more focused on the output and outcome or performance results of employees and health centers as expected. Efficiency is related to the relationship between the output of health services with the resources used to produce output and outcomes (Handoko, 2003)
117
Puskesmas that will identify the problem, then look for the cause of the problem and at the same time monitor the implementation to meet the health service standard and ultimately will build a performance standard based on current information, technology and patient expectations. This activity will repeatedly, find the problem, determine the cause of the problem and implement corrective action and monitor the results, so as to create efforts to improve the quality of health services continuous health (Pohan, 2003).
3. Research Methods
This research uses descriptive qualitative research design or design that is mixed between qualitative and quantitative, by using technical data analysis Importance-Performance Analysis and Cartesian Diagram. Cartesian diagram is a build that is divided into four sections bounded by lines intersecting perpendicular to the point (X, Y), where X is the average of the average score of the execution level or customer satisfaction of all factors affecting customer satisfaction. where:
K = Number of indicators or sub-indicators formula:
̿ = average of average satisfaction score score
̿ = average of average interest rate scores
The results of calculations of the use of these formulas are then incorporated into the Cartesian Diagram. From here, it is known which indicators are achievements and need to be maintained. It is also known which indicators are of poor quality and need to be prioritized for improvement. In this research, sampling using Accidental Sampling technique. The sampling was performed using the following formula (Levine et al., 2011):
n = Sample
Z = value Z on the degree of confidence, so in the 90% trust then the value of Z = 1.64 e = error (10%)
= 67,64 = 68
So obtained sample = 68 respondents. Sample size greater than 30 and less than 500 is sufficient for most research, then to facilitate the calculation of statistics and to analyze, the sample used amounted to 75 Respondents, which then divided the three Puskesmas in the district Mranggen.
The data were collected using questionnaires using Likert scale 1-5 items. Because this study aims to find the gap between performance and customer expectations, the Likert scale is given the following weight:
118
respondents who are Puskesmas customers in a southern area of Mranggen Subdistrict during May 2017. Questionnaire division will be divided into 3 terms:
1. Morning at 07.00-09.00 am. 2. Morning at 09:00 to 11:00 am. 3. Afternoon at 11:00 to 13:00 pm.
In each term, the customer who will be the respondent is a customer who is a patient of Puskesmas in Mranggen sub-district. Observation: that is by making direct observation of the object of research to complete the required data. Interview: i.e., held a direct interview with the management or customer health center in Mranggen District.
4. Results
Descriptive Data of Respondents
Descriptive data describes the profile of respondent data obtained from the responses given by respondents, then below will be explained first about the identity of respondents. The identity of the respondent is based on gender, age, and last education.
Respondents by Gender
Based on data processing, show that 75 respondent’s male gender is equal to 29 percent while female gender is 53 percent. This shows that most of the respondents in this study were dominated by female respondents
Respondents by Age
Based on data processing, respondents based on age showed that from 75 respondents the highest were respondents aged between 40 to 49 years that is 32% and age 30 - 39 by 31%, while the rest are at age > 50 by 10%, age < 20 as many as 19% and the lowest is aged between 20 - 29 years as much as 8%. . This shows that the respondents in this study dominated by respondents aged productive.
Respondents by Age
Based on data processing, it shows that from 75 respondents, based on the type of education, the respondents are the most respondents are elementary school 38%, high school 28%, SMP 24%, not 5% school, 4% S1 and 1% D3 it means the respondents in this study dominated by low educated respondents
Respondents by Age
Based on data processing, it shows that from 75 respondents, based on the type of education, the respondents are the most respondents are elementary school 38%, high school 28%, SMP 24%, not 5% school, 4% S1 and 1% D3 it means the respondents in this study dominated by low educated respondents.
Data analysis
119 Table 3. The calculation of Average Values of Interest and Performance at each-Individual
Dimensions of Research.
Source: Primary data processed 2017
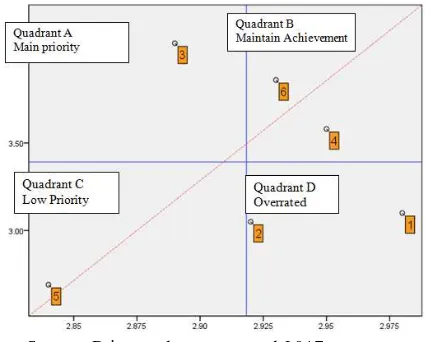
After calculating the level of conformity to the interests or expectations of customers and the performance of Puskesmas Mrangggen over the dimensions of service quality then these values can be mapped into the following Cartesian diagram:
Source: Primary data processed 2017
Figure 5. Cartesian Diagram Positioning Customer Satisfaction Level on Service Quality Dimension of Puskesmas Mrangggen
Information:
1. Tangibles; 2. Reliability; 3. Responsiveness; 4. Assurance; 5. Empathy; 6. Accessibility
The interpretation of Cartesian diagram is as follows: 1. Quadrant A (top priority)
Indicates that the indicator that affects the satisfaction of the customer of Puskesmas Mranggen is in this quadrant and the handling needs to be prioritized by the Puskesmas, because the existence of this dimension is considered important by the customer, while the implementation level is still not satisfactory, as for the entry into this quadrant is responsiveness dimension, A, the dimension of responsiveness is also still very far from the diagonal line, it means that this dimension is considered very poor in performance so the Puskesmas should focus its concession to improve the performance of this dimension immediately.
120
Means has a high score both from the level of importance and performance. Aspects of this category are ideal aspects because it indicates that the organization has advantages in the areas considered important by the customer, as for the variables that fall into this category is Assurance.
3. Quadrant C (low priority)
Indicates that indicators affecting customer satisfaction of Puskesmas Mranggen are in this quadrant of low priority because of both score of importance and low-value performance. Aspects included in this group can be neglected from the attention of management in the future, the variables included in this quadrant are responsiveness
4. Quadrant D (Excessive)
Indicates that the indicator affecting the customer satisfaction of the health center of Mranggen in this quadrant is considered excessive in its implementation, this is mainly due to the customer's grip is not very important to the existence of the indicator, but the implementation is done very well by the Puskesmas, so it is very satisfying, not useful, variables included in this quadrant include tangible and reliability
5.
Conclusion
The result of the research shows that the dimension of Responsiveness is the main priority to improve the quality of service because it has the highest importance which is 81.3% while the performance is still low with the level of conformity of 71%, among others about the alertness of the officer to inform the patient when the service will be given, and a response to the patient's request. The next sequence based on the level of compatibility is the dimensions of Assurance, Accessibility, Tangibles, Reliability, and Empathy. Thus the whole health center Mranggen considered good enough from the level of customer satisfaction.
6. Acknowledgment
We would like to thank the patients who have spent their time in this research both interviewing and filling out questionnaires, Demak Regency health office on data support, and Andre and Muhammad who have helped coordinate with various parties, this research is fully supported by dentist clinic drg. Juliati Semarang who has paid all the financing of the implementation of this research to completion.
References
1) Boe, Debra Thingstad,R.N., M.P.H., Riley, W., PhD., & Parsons, H., M.P.H. (2009). Improving service delivery in a county health department WIC clinic: An application of statistical process control techniques. American Journal of Public Health, 99(9), 1619-25. Retrieved from https://search.proquest.com/docview/215091800?accountid=25704
2) Dinas Kesehatan Kabupaten Demak. (2017). Profil Kesehatan Kabupaten Demak Tahun 2016,
Demak, Jawa Tengah.https://drive.google.com/file/d/0BwGza6Pvu6tPWFY3TGVyNzhuY W8/view
3) Drucker, Peter F. (2008),. Pengantar Manajemen, Pustaka Binaman. Pressindo,Effendi Jakarta
121 5) Handoko, TH. (2003). Manajemen. Edisi Kedua. Cetakan Kedelapanbelas. Yogyakarta:
BPFE-Yogyakarta.
6) Harvey, J. B., Beich, J., Alexander, J. A., & Scanlon, D. (2012). Building the scaffold to improve health care quality in western new york. Health Affairs, 31(3), 636-41. Retrieved from https://search.proquest.com/docview/927126281?accountid=25704
7) Hoffman, Andrew J.; Bazerman, Max H. & Yafee, Steven L. , (1997), ‘Balancing Business Interests
And Endangered Species Protection”, Sloan Management Review: Vol. 39 (1), Fall, P. 59-74.
8) Levine, B., Schweizer, T. A., O’Connor, C., Turner, G., Gillingham, S., Stuss, D. T., … Robertson, I. H. (2011). Rehabilitation of Executive Functioning in Patients with Frontal Lobe Brain Damage with Goal Management Training. Frontiers in Human Neuroscience, 5, 9. http://doi.org/10.3389/fnhum.2011.00009
9) Mowen, John C (2002), ” Perilaku Konsumen “ Jakarta: Erlangga
10)Mulyana, Budi. (2015). Kualitas Pelayanan Rumah Sakit Umum Daerah (Studi Tentang Kepuasan Pasien Rawat Inap Peserta Jamkesmas Pada Rumah Sakit Umum Daerah Kabupaten Indramayu) JURNAL ASPIRASI Vol. 5 No.2, Universitas Wiralodra, Indramayu
11)Parasuraman, A, V A Zeithaml And L L Berry, (1990), "Servqual: A Multi-Item Scale Measuring Consumer Perceptions Of Service Quality," Journal of Retailing, Vol 64, No. 1, pp. 12-37.
12)Pohan IS, 2003. Jaminan Mutu Pelayanan Kesehatan Dasar-Dasar Pengertian, Cetakan Pertma. Bekasi; Kesaint Blanc.
13)Undang-undang Republik Indonesia Nomor.36 Tahun 2009, Tentang Kesehatan 14)Wibowo. (2011). Manajemen Kinerja, edisi ketiga, Jakrta : PT. Raja Grafindo Persada.
15)Zeithaml, Valarie A. (1990), Delivering Quality Service: Balancing Customer Perceptions And Expectations, The Free Press, USA.