IDENTIFICATION OF VENATION TYPE BASED ON VENATION
DENSITY USING DIGITAL IMAGE PROCESSING
Agus Ambarwari
1), Yeni Herdiyeni
2), Irman Hermadi
3)1)Informatics, Universitas Teknokrat Indonesia 2), 3)Computer Science, Bogor Agricultural University
1)Jl. H.ZA Pagaralam, No 9-11, Labuhanratu, Bandarlampung
2), 3)
Jl. Meranti Wing 20 Level V Kampus Dramaga IPB, Bogor
Email: [email protected]), [email protected]), [email protected])
Abstract
Leaf venation is one biometric feature of leaves that have an important role in growth processes of the plant, and to determine the relationship of the plant physiology and the environment in which plants grow. At every different environment, plants have different types of leaf venation. It can be seen from the level of the leaf vein density. In this study, the feature of leaf vein density was used to identify the leaves based on venation type. The venation density features obtained from segmentation, vein detection, and density feature extraction of leaf venation. Identification of the venation type was made using the artificial neural network (ANN). The results of this study indicate that the proposed method can classify the leaf correctly image based on the venation type. On the dataset with 324 samples, the accuracy of 82.71% was obtained. This shows that the leaf vein density features allow use as a plant identifier.
Keywords: leaf vein density, vein detection, density feature extraction, artificial neural network
1. Introduction
Plant morphology or phytomorphology is the study of form and structure of plant [1]. It is useful to identify plants visually, so an enormous diversity of plants can be identified, classified, and given a proper name for each group formed. Plant morphology does not just describe the shape and structure of plants, but also to determine the function of each part in the life of the plant, then also be able to know where the origin and composition of the body formed [2]. Morphology information is necessary for the comprehension of life cycles, geographical and ecological distribution, evolution, conservation status, as well as species delimitation [3].
The plants can be identified using their body structures such as leaves, flowers, and fruit. Among these parts, the leaf is widely used for plant identification because typically this data most abundant collected by botanists and easy to get in the field study [4]. Although flower and fruit have proved very useful for botany and paleobotany, certainly there are situations in which these organs are not available for study [5]. Also, the leaf is an organ that plays a significant role in environmental adaptation [6]. The leaf has main features that
distinguish each type of crop, among others shape, vein structure (venation), color and state of the surface of the leaves [7]. Among the features, the leaf venation has a unique diversity that can describe in detail the characteristics of the plant, although some plant species do not show the clear pattern of venation [8]. The networks of leaf venation provide an integrative linkage between plant form, function, and climate, including temperature, precipitation, and water availability, because water transport in leaf underlies variation of plant growth [9].
Related to plant growth, the leaf venation has a critical role. Plant growth will experience a water loss during transpiration. Transpiration needs water supply provided by the leaf venation. If the growth rate and water loss rate of plants depend on the environment, only a few leaf venation types with a certain density that can survive in environment differently [9]. In fact, in most of the plants that have been investigated (including deciduous trees, evergreen trees, bushes, and herbs), the leaves under the sun has venation density higher than in the shade [10] [11]. The most important factor influencing venation density is water [10]. The result of observation stated that the venation density in dry habitats is higher than the plants in mesic habitat [12]. Thus, to determine the relationship of climate and a plant physiology, measurement of the leaf vein density is required. Density is one of the key traits of leaf venation because it is directly associated with vein function [11].
In leaf venation, there are six types of venation, which is acrodromous, actinodromous, campylo-dromous, palinac-tinocampylo-dromous, parallelodromous and pinnate [13]. To identify each type of venation can do by utilizing the leaf vein density features. The density features divided into two, based on measured traits and derived traits of leaf venation [14]. These features can obtain through the extraction of leaf venation features.
vesselness measure based on the eigenvalues of the Hessian matrix. Vesselness of this measure commonly used for vessel segmentation of human organs [15]. The results obtained, the system can perform segmentation up to tertiary venation. Other studies, Plotze and Bruno have done a biometric feature extraction on the plant, i.e., on the leaf venation. The features that extracted from the leaf venation structure is distances, length, and angle [16]. The results of Ambarwari et al. showed that leaf venation features can be used to classify the venation type [17].
This paper focuses on identifying the venation type of leaf using venation density features. The leaf image data used in this study obtained from the Computational Intelligence Laboratory, Bogor Agricultural University. The leaf images were extracted using Hessian matrix [15]. Venation detection and feature extraction of leaf vein density used the method from Plotze and Bruno [16]. For identification of the type of leaf venation, the technique used is the artificial neural network (ANN).
2. Methods
The method developed has been applied directly to the identification of plant leaves. The leaf image data are used as much as 324 images of leaves that have been classified by venation type with the number of sample image that different. Each leaf venation type consists of 96 images of acrodromous, 37 images of actinodromous, 50 images of parallelodromous and 141 images of pinnate. The sample image data of leaf is obtained from the Computational Intelligence Laboratory, Bogor Agricultural University. Figure 1 shows a sample of each venation type from some species used in the experiments.
(a) (b) (c) (d)
(e) (f) (g) (h)
Figure 1. Sample of each venation type from some species. Acrodromous: (a) clidemia hirta, (b) randong
tangkal; Actinodromous: (c) morus alba, (d) akar bilawan; Parallelodromous: (e) congkok, (f) rotan; Pinnate: (g) aegle marmelos, (h) eupatorium riparium.
The leaf images obtained from the Computational Intelligence Laboratory taken using a digital camera and a scanner with a resolution of 300 dpi. The experiments
divided into four steps: segmentation, vein detection, density feature extraction and pattern recognition (neural network).
Segmentation
Segmentation is the operation of partitioning data into parts, or into separate objects [18]. Image segmentation is the process of separating the image into several parts homogeneous and extracts the parts into objects to be observed so that the region of interest found [19].
Figure 2. Segmentation process on leaf image data
Figure 2 is a segmentation process on leaf image data. In the leaf image data, segmentation divided into two, namely leaf shape (using thresholding, to obtain projected leaf area) and leaf venation using Hessian matrix [15]. The result of segmentation process in the form of binary image data. The threshold value applied to each of leaf image is different because each image of leaves has color intensity levels and image quality that difference. Figure 3 presents a sample of each venation type of several species after segmentation.
(a) (b) (c) (d)
(e) (f) (g) (h)
Figure 3. Venation structure of the samples. Acrodromous: (a) clidemia hirta, (b) randong tangkal;
Vein Detection
From the binary image data of segmentation result of leaf venation was determined the branch-point and end-point. These points stored in the form of coordinate values (x, y). Then will create a segment (length of venation), which consists of two pairs of points.
Figure 4. Leaf structure feature extraction: bifurcations (branch-point), extreme point (end-point), and
intermediary.
The main idea to determine the branching point and ending point, ie when a pixel has only one or two neighboring pixels, then this pixel is the ending point. If a pixel has three or more neighboring pixels, then this pixel is a branching point [16].
Figure 5. Determination of bifurcation pixels: (a) pixel p is not bifurcation A(p) ≤ 2;
(b) pixel p is bifurcation A(p) > 2
Figure 5 illustrates bifurcation (branch-point) pixels in the structure of the leaf venation. The extreme point (end-point) concept can be understood as the last pixel of the ramification structure (represent the end of ramification). The intermediary pixel can be understood as all the points that do not belong to the bifurcation and extreme points or the simple is dots that connecting the bifurcation with an extreme point [16].
Density Feature Extraction
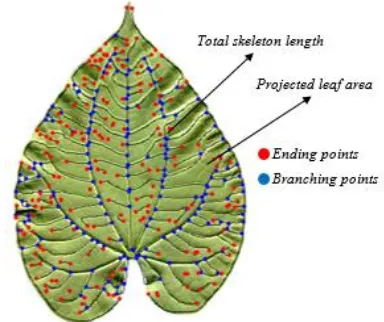
Density is one of the key traits of leaf venation because it is directly associated with venation function [11]. Leaf vein density (LVD), defined as the total length of venation per unit area [20]. Illustration of the features of the leaf vein density shown in Figure 6.
Figure 6. The illustration of leaves venation density features
The leaf vein density can be calculated by measuring the traits of leaf venation in Table 1, and the derivative traits of leaf venation on Table 2 [14].
Table 1. Measured traits of leaf venation Venation Traits Symbol Unit
Total skeleton length L mm
Projected leaf area A mm2
No. of branching points NBP No. of ending points NEP
Table 2. Derived traits of leaf venation Venation Traits Symbol Definition
Leaf vein density Dv = L/A
Branching point density DBP = NBP/A Ending point density DEP = NEP/A
Total skeleton length represented by the length of the segment as a whole. Projected leaf area represented by the number of pixels of the leaf shape (segmentation using thresholding). The number of branching points represented by the number of blue pixels and the number of ending points represented by the number of red pixels. Density feature of leaf venation obtained as much as 8, which is total skeleton length, projected leaf area, number of branching points, number of end points, leaf vein density, branch point density, end point density, and the number of segments.
Multilayer Perceptron
Pattern recognition technique used is an artificial neural network (ANN). The main characteristics of an ANN are the ability to learn the nonlinear complex relations of input/output, the sequentially training procedures, and the adaptation of ANN in accordance with the incoming data [16].
One of the families that are often used in ANN for classification is a feed-forward network, called a multilayer perceptron (MLP). A multilayer perceptron (MLP) is a model that maps sets of input data onto a set bifurcation
extreme point
of appropriate outputs. An MLP consists of multiple layers of nodes on a directed graph, with each layer fully connected to the next one node. Except for the input nodes, each node is a neuron (or processing element) with a nonlinear activation function. MLP utilizes a supervised learning technique called back-propagation for training the network [21]. Figure 7 illustrates an MLP with an input layer (density feature of leaf venation), a
Figure 7. Multilayer Perceptron (MLP) structure to classify type of leaf venation
The performance and the efficiency of MLP of the ANN can be measured by error ratio value. This calculation is based on the difference between the results achieved algorithms with expected results. One way that is more commonly used is the Mean Square Error (MSE) [16]. Equation (1) defines the Mean Square Error.
where j represents the neurons of the output layer, t is the output obtained and y the desired output of the neural network.
3. Results and Analysis
The image data obtained from the Computational Intelligence Laboratory as many as 324 and grouped by the venation type, venation type acrodromous consists of 96 images, actinodromous consists of 37 images, parallelodromous consists of 50 images, and pinnate consists of 141 images. Each type of leaf venation also consists of a different species. Acrodromous consists of 8 species of leaf, actinodromous consists of 10 species of leaf, parallelodromous consists of 2 species of leaf, and pinnate consists of 28 species of leaf.
Previously the leaf images in the segmenting and extracted, thus obtained seven features include the projected leaf area, total skeleton length, end point, branch point, leaf vein density, branch point density and end point density.
Feature information collected is used as input data on ANN. ANN trained using back propagation algorithms and topology 7×5×4 (7 neurons in the input
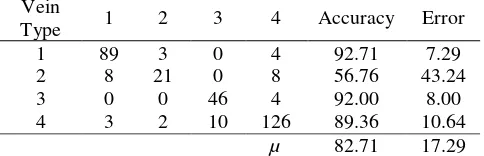
layer, 5 neurons the hidden layer, and 4 neurons in the output layer). The parameter value of learning rate is 0.3, momentum 0.2, training time 500, and the validation threshold 20. For validation the correct/incorrect data, use k-fold cross validation. Dataset (324 data) was actinodromous type who earn less good accuracy results. Almost half of the data types actinodromous misclassified, ie on acrodromous and pinnate. This is due to the characteristics of the pattern of leaf venation between acrodromous, actinodromous, and pinnate almost the same (can be seen in Figure 3 (a, b) for the type acrodromous, Figure 3 (c, d) for the type actinodromous, and Figure 3 (g, h) for the type pinnate). The results of the classification are shown in a confusion matrix, as shown in Table 3.
Table 3. The results of venation type classification using density features of leaf venation
Vein
1=Acrodromous; 2=Actinodromous; 3=Parallelodromous; 4=Pinnate
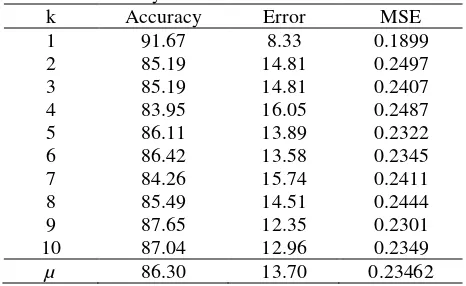
From the confusion matrix in Table 3, data is classified correctly represented diagonally. The column Accuracy and Error is the percentage of correct and incorrect data is classified. The resulting classification (for k=1 to k=10) by comparing the value of MSE at the time of data testing shown in Table 4. The average of error ratio obtained in the test is 0.23462. Table 4 shows the average accuracy obtained ANN in classifying images leaf based on the venation type, for a value of k = 1 to k = 10 is 86.30.
Table 4. The results of venation type classification using
Information about plant morphology, especially the leaves is important to be learned, remember leaf is one of the plant organs needed for the survival. Through the leaves, botanists were able to identify the characteristics of the plant such as climate and physiology of the plant. One of the characteristics of the leaves that store such much as seven and an artificial neural network is used to classify the leaves based on the venation type. This method has applied to four types of leaf venation, with a variety of species on each of venation type different (8 species of acrodromous, 10 species of actinodromous, 2 species of parallelodromous, and 28 species of pinnate).
Using dataset as much as 324 samples, the proposed methodology is able to correctly classify as much as 82.71%. This indicates that the computer vision technique and machine learning can be applied to identify the characteristics of a plant, by its leaf venation. Although the results are good enough, the addition of other features allows improving the result of accuracy. As for the other features of leaf venation, the author got from the papers reference include the distance between the end point with the branch point, the angle formed by each pair of branch venation, and the length of each branch of leaf venation.
References
[1] R.F. Evert & S.E. Eichhorn, Raven Biology of Plants, 8th ed., Freeman and Company, New York, p.10, 2013.
[2] G. Tjitrosoepomo, Morfologi Tumbuhan, Gadjah Mada University Press, Yogyakarta, pp.254-263, 2016.
[3] B. Douaihy, K. Sobierajska, A.K. Jasinska, K. Boratynska, T. Ok, A. Romo, N. Machon, Y. Didukh, M.B. Dagher-Kharrat & A. Boratynski,
“Morphological versus molecular markers to
describe variability in juniperus excelsa subsp. excelsa (cupressaceae)”, AoB Plants, pp.1-14, 2012.
[4] T.L. Le, D.T. Tran & V.N. Hoang, “Fully automatic leaf-based plant identification, application for vietnamese medicinal plant search”, In Proceedings of the Fifth Symposium on Information and Communication Technology - SoICT '14, New York, pp.146-154, 2014.
[5] S. Wing, A. Ash, B. Ellis, L.J. Hickey, K. Johnson & P. Wilf, Manual of Leaf Architecture – morphological description and categorization of dicotyledonous and net-veined monocotyledonous angiosperms by Leaf Architecture Working Group, Smithsonian Institution 10th St. & Constitution Ave., N.W. Washington, DC, 1999.
[6] J. Yang, R.A. Spicer, T.E.V. Spicer, N.C. Arens, F.M.B. Jacques, T. Su, E.M. Kennedy, A.B. Herman, D.C. Steart, G. Srivastava, R.C. Mehrotra, P.J. Valdes, N.V. Mehrotra, Z.K. Zhou & J.S. Lai,
“Leaf form-climate relationships on the global stage: an ensemble of characters”, Global Ecology and Biogeography, vol. 24, no. 10, pp.1113-1125, 2015.
[7] M. Rahmadhani & Y. Herdiyeni, “Shape and vein extraction on plant leaf images using fourier and b-spline modeling”, In Proceeding of AFITA International Conference, the Quality Information for Competitive Agricultural Based Production System and Commerce, pp.306-310, 2010.
[8] A. Wahyumiyanto, I.K.E. Purnama & Christyowidiasmoro, “Identifikasi tumbuhan berdasarkan minutiae tulang daun menggunakan
SOM kohonen”, Undergraduate Thesis, Institut
Teknologi Sepuluh Nopember, Indonesia, 2011. [9] B. Blonder & B.J. Enquist, “Inferring climate from
angiosperm leaf venation networks”, New Phytologist, vol. 204, no. 1, pp.116-126, 2014. [10] D. Uhl & V. Mosbrugger, “Leaf venation density as
a climate and environmental proxy: A critical review and new data”, Palaeogeography Palaeoclima-tology Palaeoecology, vol. 149, no. 1-4, pp.15-26, 1999.
[11] Y. Zhu, H. Kang, Q. Xie, Z. Wang, S. Yin & C. Liu, “Pattern of leaf vein density and climate relationship of quercus variabilis populations remains unchanged with environmental changes”, Trees, vol. 26, no. 2, pp.597-607, 2011.
[12] W.V. Zalenski, “Ueber die ausbildung der nervation bei verschiedenen pflanzen”, Berichte Deutsche Botanicshe Gesellschaft, vol. 20, pp.433-440, 1902.
[13] L.J. Hickey, “Classification of the architecture of dicotyledonous leaves”, American Journal of Botany, vol. 60, no. 1, pp.17-33, 1973.
[15] A. Salima, Y. Herdiyeni & S. Douady, “Leaf vein segmentation of medicinal plant using hessian matrix”, In Proceeding of ICACSIS 2015, pp.275-279, 2015.
[16] R.D.O. Plotze & O.M. Bruno, “Automatic leaf structure biometry: computer vision techniques and their applications in plant taxonomy”, International Journal of Pattern Recognition and Artificial Intelligence, vol. 23, no. 02, pp.247-262, 2009. [17] A. Ambarwari, Y. Herdiyeni, & I Hermadi,
“Biometric Analysis of Leaf Venation Density Based on Digital Image”, TELKOMNIKA (Telecommunication Computing Electronics and Control), vol. 16, issue 4, pp.1735-1744, 2018. [18] A. McAndrew, An Introduction to Digital Image
Processing with MATLAB, Notes for SCM2511 Image Processing 1, School of Computer Science and Mathematics, Victoria University of Technology, pp.137-160, 2004.
[19] R.C. Gonzalez, R.E. Woods & S.L. Eddins, Digital Image Processing Using MATLAB, Pearson Prentice Hall, New Jersey, 2004.
[20] C.A. Price, P.R.T. Murno & J.S. Weitz, “Estimates of leaf vein density are scale dependent”, Plant Physiology, vol. 164, pp.173-180, 2014.