Khairul A. Rasmani and Nor Azni Shahari
Faculty of Information Technology and Quantitative Sciences, Universiti Teknologi MARA, Malaysia
{khairulanwar, norazni}@nsembilan.uitm.edu.my
Abstract
Likert-type scale that employs ordinal values to represent linguistics terms has been very popular in the studies on job satisfaction evaluation. In this work, it is argued that the use of ordinal values in Likert scale does not offer the best way in representing the linguistic terms. This paper proposes the use of fuzzy sets to represent linguistic terms in Likert-type scale and employs the technique using fuzzy conjoint method in job satisfaction evaluation. Experimental results show that the analysis using fuzzy conjoint method produced consistent result compared to the analysis using the percentage. However, the fuzzy membership values obtained from fuzzy conjoint method can be used to compare the decisions between criteria used to measure job satisfaction, and hence is very useful in providing additional information for decision-making.
1. Introduction
Job satisfaction is an important aspect that determines the quality of academic staff in higher education. It illustrates enhancement of efficiency and performance of the institution. The outcome of a study on job satisfaction of academics staff also could also be very useful to provide information for the quality improvement process. In general, the instrument used for the evaluation of job satisfaction consists of several criteria that are very subjective. Typically, each criterion consists of several variables in which the respondents of the survey need to give their responses in the form of preferences or agreements such as ‘agree’ and ‘disagree’.
Likert-type scale that employs ordinal values to represent linguistics terms has been very popular in the studies on job satisfaction. The discrete-ordinal values have been used for the analysis which includes the measurement of central tendency, correlation coefficient, regression, t-test, chi square test etc. For example in [4], five-point Likert response scale ranging from ‘1: very satisfied’, through ‘3:neutral’, to ‘5:very dissatisfied’ has been used in studies on job satisfaction among academic staff across eight nations including Australia, Germany, Hong Kong, Israel, Mexico, Sweden, UK and USA. In those studies, percentage and mean were used for the analysis. In [5], five-point Likert scale had been used in a study on the effect of change and
transformation on academic staff and job satisfaction in South African University. The evaluation of job satisfaction was based on percentage. In [6], a ‘six-step’ Likert scale had been used in a study on job satisfaction of library staff at the University of North Carolina. The Likert scale consisted of ‘1:disagree very much’, ‘2:disagree moderately’, ‘3:disagree slightly’, ‘4:agree slightly’, ‘5:agree moderately’ and ‘6:agree very much’. In that study, the analysis was conducted using statistical mean and standard deviation. In [9], two types of Likert scale had been used, they were five-point scale ranging from ‘5:strongly agree’ to ‘1:strongly disagree’ and a seven-point Likert scale ranging from ‘0:never’ to ‘6:everyday’. The study which focused on job satisfaction and burnout among Greek early educators employed statistical mean, standard deviation and correlation for the analysis.
It is observed that discrete-ordinal value is widely used to represent linguistic term in Likert-type scale. The use of percentage and statistical mean in particular are very popular methods for data analysis. For example in [4], statistical mean has been used to compare job satisfaction among academic staff in eight different countries. In the study, higher mean value indicates that the academic staffs are more satisfied to their jobs. However, the use of mean value obtained from Likert scale makes no sense because the ordinal value is just for coding. Furthermore, the interval between values is not interpretable in an ordinal measure. Thus, a mean value of ‘4.75’ from response to Likert scale ‘1:disagree’ to ‘5:agree’ does not mean that the outcome is ‘agree’. The use of discrete values in Likert scale is also inappropriate because the linguistic terms such as ‘agree’ and ‘disagree’ are measured as degrees of preferences or agreements which in nature are fuzzy terms. Thus, in this work, it is argued that the use of ordinal values in Likert scale does not offer the best way in representing the linguistic terms. As an alternative, fuzzy set offers a new way of representing the linguistic terms used in Likert scale. Moreover, the output from fuzzy inference in terms of membership value degree can be very useful to indicate the degree of preferences or agreements.
2. Background Theory
This section describes the basic theory of fuzzy sets relating to job satisfaction evaluation and the fuzzy conjoint analysis method.
2.1 Fuzzy Sets and Job Satisfaction Evaluation
In classical set theory, a set (normally termed as crisp set
in the literature) is typically defined as a collection of elements. Each element can either belongs or does not belong to the set. If x∈A is true, then x∉ A is false. This classical approach shows that everything is precise and every set must be well defined. However, this is not always true in real world problems as some sets may not have clear boundaries [11]. The same word uttered by humans may carry different meanings. The theory of fuzzy sets, which was introduced by Zadeh [12] in 1965, is intended to deal with such imprecision that cannot be dealt with using the crisp set theory.
The basic property of a fuzzy set is its gradual transition from membership to non-membership [1]. The characteristic function, also known as the membership function, of a fuzzy set is a mapping to a portion of the real line, allowing a continuum of possible choices [8]. That is, the value of an element in a fuzzy set is defined in terms of degrees in an interval from 0 to 1. If 0 is false and 1 is true, a value approaching 0 means that the value is becoming ‘false’ and a value approaching 1 means that the value is approaching ‘true’. For example, if µAgree(x) is the membership value
degree of agreement, then the closer the value of µAgree(x) is
to 1, the more x belongs to 'Agree' and the closer µAgree(x) is
to 0, the less x belongs to 'Agree'.
Fuzzy sets and fuzzy membership values have been proven can be used to induce model from vogue and subjective concepts for the purpose of conducting evaluations [3]. Fuzzy inference also allows the combination of information provided by experts into fuzzy sets in the process of evaluation. The use of fuzzy approach in the area of job satisfaction evaluation is relatively new. Only a few studies have been conducted related to this area. For example in [3], fuzzy model based on multi-objective fuzzy decision-making has been proposed to evaluate the salary structure that is suitable for the job assignment, and in [2], inference using fuzzy sets theory has been proposed for the personnel evaluation procedures in a large company.
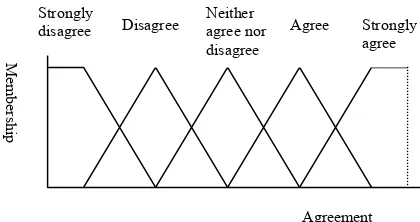
In general, job satisfaction evaluation is conducted based on subjective evaluations and is very dependent on human interpretations. The measurements of preferences or agreements on certain subjective questions that have been used by many researchers are the Liker-type scale which is typically in the form of linguistic terms. The linguistic terms are ordered and therefore can be replaced with fuzzy sets representing each agreement or preference level. Figure 1 illustrates an example of the fuzzy sets representing the level of agreement.
The use of fuzzy sets in Likert scale will make the evaluation more flexible as the value of the level of agreement level is not a discrete point as it can take any value from 0 to 1. This approach also allows the creation of different type of fuzzy sets, say according to the experts’ beliefs. Thus, the distance value for each level of agreement can also be different. Additionally, the main characteristic of fuzzy sets representing the level of agreement is the overlapping of a fuzzy set with the adjacent fuzzy set to reflect the real-world situation where there are no sharp boundaries to differentiate the agreement levels.
Figure 1. Fuzzy sets representing level of agreement
2.2 Fuzzy Conjoint Analysis
Conjoint analysis also known as ‘trade-off’ analysis is a quantitative tool that is widely used in marketing research. Currently, there are several types of conjoint analysis available and have been used in broader research area. The fuzzy conjoint analysis used in this study is a method originally proposed by Turksen and Willson [10], in which the method is used for the analysis of consumer preferences. The membership value degree for linguistic label representing item A for all respondents according to linguistic label yj = 1, 2, …, t is defined as follows:
) , ( )
,
( x A
w w A
y Fi j
t
i i
i j
R = ⎜⎜⎝⎛ ⎟⎟⎠⎞×µ
µ
∑ ∑
=1
, (2)
where
∑
ii
w w
= weight that represent level of agreement
for respondent i with respect to other respondents.
) , (xj A
i F
µ = membership value degree for respondent
i for item A according linguistic label xj =
1, 2, …, t.
t = number of linguistic label/term.
A = an item / a question.
The membership value degree calculated above, represents the fuzzy set of response given by respondents is then compared to fuzzy set defined by expert. This can be conducted using fuzzy similarity measure based on Euclidean distance of two fuzzy sets [10] defined as follows:
Agree Strongly
disagree Disagree Strongly agree Neither
agree nor disagree
Agreement
M
em
b
ers
h
(
)
⎥⎥where is the fuzzy sets calculated based on
responses given by respondents, and is the standard
fuzzy sets defined for linguistic label l. Other fuzzy similarity measure can also be utilised. By using this method similarity values for each agreement level is calculated. The outcome of this analysis is determined based on the maximum similarity value among the agreement level.
)
3. Experiment and Discussion
The dataset used in this study consists of responses collected from 39 male and 61 female academic staff in Universiti Teknologi MARA (UiTM), Malaysia. Thirty two of the respondents are from UiTM main campus and the rest are from branch campuses. Among them, 34 have worked between 1 to 5 years, 29 have worked between 6 to 10 years and the remaining 37 have worked for more than 10 years. Non random sampling is used because the objective of this study is to investigate the suitability of fuzzy conjoint method rather than to make inference about the population.
3.1 Data Collection and Analysis
The research instrument for this study was a set of questionnaire consisting four main criteria to measure the job satisfaction level among academic staff in UiTM.
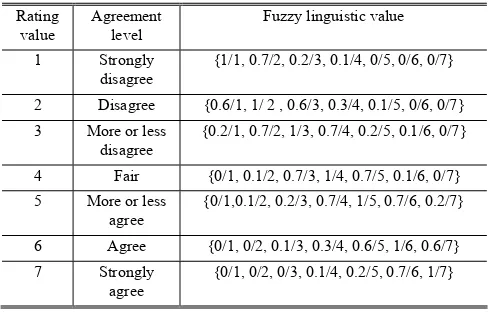
Table 1. Fuzzy linguistic value representing each agreement level
Rating value
Agreement level
Fuzzy linguistic value
1 Strongly
The criteria used include nature of work, remuneration, promotion opportunity and interpersonal relations. Seven agreement levels corresponding to seven fuzzy linguistic values were created based on seven-point Likert scale as shown in Table 1. The respondents of the study were only needed to choose their preferences or agreements according to the agreement level. The fuzzy linguistic value
representing the agreement level was defined by expert in advanced.
3.2 Experimental Results
The experimental results shown in Table 2 – 5 demonstrate the comparison of decisions obtained based on two types of evaluation methods; fuzzy conjoint method and analysis using the percentage. For both methods, the decision for each sub-criterion is made based on the highest value obtained on the agreement level. The statistical mean and standard deviation are also provided in order to compare the ‘likely decision’ with decisions obtained from the first two methods mentioned above.
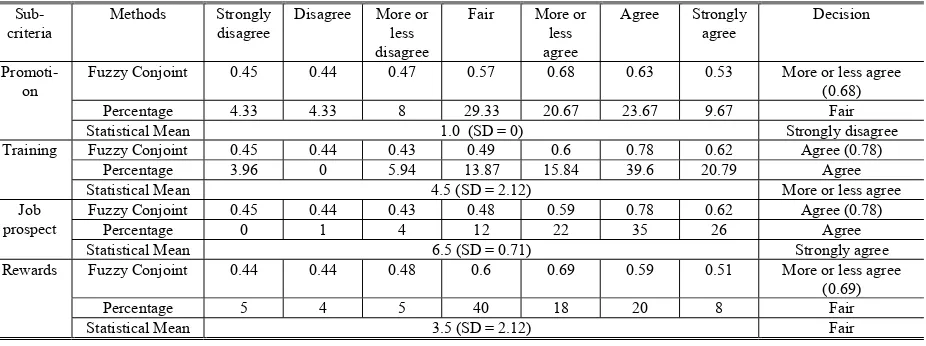
On comparison between decisions obtained based on fuzzy conjoint method and analysis using the percentage, it is observed from the analysis on nature of work (Table 2), the decisions produced using fuzzy conjoint method are consistent with the decision based on analysis using the percentage, except for the sub-criterion ‘Ability’. On comparison of analysis on remuneration (Table 3), only the sub-criteria ‘Pay’ created different decision. In Table 4, there are two sub-criteria on promotion opportunity that created different decision. The two sub-criteria are ‘Promotion’ and ‘Rewards’. On comparison of decisions on interpersonal relations (Table 5), only the sub-criterion ‘Family’ produced different decisions.
Although there are different decisions obtained by the fuzzy conjoint method and the analysis using the percentage, the differences are not really significant. In Table 5 for example, the decision using fuzzy conjoint method for the sub-criterion ‘Family’ is ‘Strongly agree’ which is about the same with ‘Agree’ for the decision obtained from analysis using the percentage. Additionally, the number of sub-criteria which reveals the same decision is greater than the results that produce different decision. From these observations, it can be concluded that fuzzy conjoint method generally produces consistent results with the analysis using the percentage.
Comparing the mean values obtained based on Likert-type scale has been practiced by many researchers (see for examples [4, 6, 9]. Thus, in Table 3 for example, the mean value 6.5 on ‘Benefit’ and 5.0 on ‘Job security’ suggest that the academic staffs are more satisfied with benefit compared to the job security. Although the comparison of the mean values seem ‘workable’, the mean values obtained from the statistical method do not represent anything as the results have been derived originally from ordinal values. Thus, in practical, no decision can be made based on the statistical analysis.
in general, the academic staff is more satisfied with benefit compared to job security. This shows that fuzzy membership values can be used to differentiate the degree of satisfaction when the decisions (level of agreements) are the same. This
advantage comes from the use of fuzzy membership values to indicate the decisions. In brief, the use of fuzzy value as the output is very useful in helping the decision-making process.
Table 2. Comparison of decisions on nature of work
Sub- criteria
Methods Strongly disagree
Disagree More or less disagree
Fair More or less agree
Agree Strongly agree
Decision
Fuzzy Conjoint 0.45 0.44 0.41 0.46 0.54 0.79 0.69 Agree (0.79) Percentage 1.2 1.2 2 7 13.8 41 33.8 Agree Interest
Statistical Mean 6.5 (SD = 0.71) Strongly Agree Fuzzy Conjoint 0.45 0.43 0.42 0.47 0.58 0.81 0.64 Agree (0.81)
Percentage 0 0 1.5 6.5 24.5 37.5 30 Agree Freedom
Statistical Mean 5.5(SD =1.41) More or less agree Fuzzy Conjoint 0.45 0.43 0.41 0.45 0.52 0.77 0.72 Agree (0.77)
Percentage 0 0 3 4 6 46 41 Agree
Opportu-nity
Statistical Mean 6.5 (SD = 0.71) Strongly agree Fuzzy Conjoint 0.45 0.43 0.42 0.48 0.57 0.79 0.65 Agree (0.79)
Percentage 0 0 1 12 19 36 32 Agree
Status
Statistical Mean 5.5 (SD = 0.71) Agree
Fuzzy Conjoint 0.45 0.43 0.41 0.46 0.55 0.79 0.67 Agree (0.79) Percentage 0 0 3 4 21 34 38 Strongly agree Ability
Statistical Mean 4.5 (SD = 2.12) More or less agree
Table 3. Comparison of decisions on remuneration
Sub- criteria
Methods Strongly disagree
Disagree More or less disagree
Fair More or less agree
Agree Strongly agree
Decision
Fuzzy Conjoint 0.45 0.44 0.44 0.51 0.66 0.73 0.57 Agree (0.73) Percentage 0 2 5 14 31 31 17 More or less agree/
Agree Pay
Statistical Mean 3.5 (SD = 2.12) Fair
Fuzzy Conjoint 0.45 0.44 0.42 0.47 0.55 0.78 0.68 Agree(0.78)
Percentage 0 2 3 10 12 37 36 Agree
Job security
Statistical Mean 5.0 (SD = 2.83) More or less agree Fuzzy Conjoint 0.45 0.44 0.42 0.47 0.57 0.80 0.65 Agree (0.80)
Percentage 1 1.5 2 11 13.5 43.5 27.5 Agree Benefit
Statistical Mean 6.5 (SD = 3.54) Agree
Table 4. Comparison of decisions on promotion opportunity
Sub- criteria
Methods Strongly disagree
Disagree More or less disagree
Fair More or less agree
Agree Strongly agree
Decision
Fuzzy Conjoint 0.45 0.44 0.47 0.57 0.68 0.63 0.53 More or less agree (0.68) Percentage 4.33 4.33 8 29.33 20.67 23.67 9.67 Fair
Promoti-on
Statistical Mean 1.0 (SD = 0) Strongly disagree Fuzzy Conjoint 0.45 0.44 0.43 0.49 0.6 0.78 0.62 Agree (0.78)
Percentage 3.96 0 5.94 13.87 15.84 39.6 20.79 Agree Training
Statistical Mean 4.5 (SD = 2.12) More or less agree Fuzzy Conjoint 0.45 0.44 0.43 0.48 0.59 0.78 0.62 Agree (0.78)
Percentage 0 1 4 12 22 35 26 Agree
Job prospect
Statistical Mean 6.5 (SD = 0.71) Strongly agree Fuzzy Conjoint 0.44 0.44 0.48 0.6 0.69 0.59 0.51 More or less agree
(0.69)
Percentage 5 4 5 40 18 20 8 Fair
Rewards
Table 5. Comparison of decisions on interpersonal relations
Sub- criteria
Methods Strongly disagree
Disagree More or less disagree
Fair More or less agree
Agree Strongly agree
Decision
Fuzzy Conjoint 0.45 0.44 0.443 0.48 0.58 0.78 0.64 Agree (0.78) Percentage 0 1 5 10.5 18 36.5 29 Agree
Collea-gue
Statistical Mean 2.5 (SD = 0.71) More or less disagree Fuzzy Conjoint 0.45 0.43 0.41 0.45 0.51 0.75 0.73 Agree (0.75)
Percentage 0 0 0 5 10 37 48 Strongly agree Family
Statistical Mean 5.5 (SD = 2.12) Agree
Fuzzy Conjoint 0.45 0.44 0.43 0.5 0.61 0.75 0.6 Agree (0.75)
Percentage 0 0 5 17 24 29 25 Agree
Superior
Statistical Mean 4.5 (SD = 2.12) More or less agree
4. Conclusion
This paper has presented an application of fuzzy approach in job satisfaction evaluation of academic staff. In particular, it has been shown that the evaluation of job satisfaction can be carried out using fuzzy conjoint method. The results obtained from the fuzzy conjoint method are generally consistent with the results obtained from analysis based on percentage. Hence, this method can be used as an alternative method for analysing job satisfaction. The proposed approach also has an advantage from the use of fuzzy membership value degree. These values can be use to indicate the degree of acceptance or agreement on job satisfaction. This method can also be used as a tool to ‘double-check’ results or decisions derived from statistical or other methods. Additionally, the simple approach employed in fuzzy conjoint method could be very useful in term of practicality of the methods to be used for evaluation of job satisfaction in real-world situation.
Results from this study can be vital for further research regarding the appropriate methods that should be used for job satisfaction evaluation. Note that job satisfaction evaluation can also be classified as classification problems. Hence many other approaches such as crisp decision trees, fuzzy classification systems and Support Vector Machine (SVM) may also be used for the job satisfaction evaluation problems. This has not been included and reported in this paper. However work is on-going in this direction.
Beside that, the use of knowledge from data has become very popular in developing data-driven fuzzy rule based on systems that can be used to conduct evaluation [7]. Existing or historical data available in computer systems can provide very valuable information that can be utilised in assisting decision-making process. The implementation of such systems may results in a better technique on job satisfaction evaluation.
5. References
[1] P. P. Bonissone, "A Fuzzy Sets Based Linguistic Approach: Theory and Applications," Proceedings of the 1980 Winter Simulation Conference, 1980, pp. 99-111.
[2] A. Cannavacciuolo, G. Capaldo, A. Ventra, A. Volpe, and G. Zollo, "An Approach to the Evaluation of Human Resources by using Fuzzy Set Theory," Proceedings of the 3rd IEEE International Conference on Fuzzy Systems, 1994, pp. 1165-1170.
[3] S. Gupta and M. Chakraborty, "Job Evaluation in Fuzzy Environment," Fuzzy Sets and Systems, vol. 100, 1998, pp. 71-76.
[4] F. J. Lacy and B. A. Sheehan, "Job Satisfaction Among Academic Staff: An International Perspective," Higher Education, vol. 34, 1997, pp. 305-322.
[5] M. Mapesela and D. H. Hay, "The Effect of Change and Transformation on Academic Staff and Job Satisfaction: A case of a South African University," Higher Education, vol. 52, 2006, pp. 711-747.
[6] R. A. Murray, "Job satisfaction of Professional and Paraprofessional Library Staff at the University of North Carolina at Chapel Hill," Unpublished dissertation, University of North Carolina, 1999.
[7] K. A. Rasmani and Q. Shen, "Subsethood-based Fuzzy Rule Models and their Application to Student Performance Classification," Proceedings of the 14th IEEE International Conference on Fuzzy Systems, Reno, Nevada USA, 2005, pp. 755-760.
[8] K. J. Schmucker, Fuzzy Sets, Natural Language Computations, and Risk Analysis. Maryland: Computer Science Press, 1998.
[9] N. Tsigilis, E. Zachopoulou, and V. Grammatikopoulos, "Job Satisfaction and Burnout Among Greek Early Educators: A Comparison between Public and Private Sector Employees," Educational Research and Review, vol. 1, 2006, pp. 256-261.
[10] I. B. Turksen and I. A. Wilson, "A Fuzzy Preference Model for Consumer Choice," Fuzzy Sets and Systems, vol. 68, 1994, pp. 253-266.
[11] L. X. Wang, A Course in Fuzzy Systems and Control. New Jersey: Prentice-Hall International, 1997.