CHAPTER III
RESEARCH METHODOLOGY
This chapter discussed the research design and the design strategies
underpinning this research study. In addition, the chapter discussed the
research design and approach which used in the study including place and
time of the study, population and sample, research instrument, data collecting
procedure and data analysis procedure while explaining the stages and
processes involved in the study.
A.Research Design and Approach
The main purpose of the research design was to help to avoid the
situation in which the evidence does not address the initial research
questions.1 This suggested a research design focuses on the methods with
which data were collected and annalyzed to investigate a research question in
the most logical manner.
The research design of this study was survey research. In survey
research, investigators ask questions about peoples’ beliefs, opinion,
characteristics, and behaviour. A survey researcher may want to investigate
associations between respondents’ characteristic such as age, education,
social class, race, and their current attitudes toward some issues.2
According to Donald Ary “Inquiry employing operational definitions
to generate numeric data to answer predetermined hypotheses definitions or
1
Yin, Case Study Research: Design and Methods, 3rd Edition, New Delhi: SAGE Publications, 2003, p.20-21.
2
questions”.3 By this statement the writer studied to summarize data in
numerical indices. The writer physically went to the people, setting, site, or
institution to observe or record behaviour in it was natural setting.4
In this study the design was mixed method which used survey
research with the classification according to focus and scope as a census
intangibles and the focus information as attitudinal information because this
study concerned with students’ perception in process. Attitudinal information,
attitudinal questions seeked to find out more about the opinions, beliefs, or
interests of teachers or learners. These questions were often used in needs
analysis research when researchers want to gather information on such topics
as what learning goals students had or what skill areas they were most
interested in.5The data collected from the students’ information. It meant the data were statistic data and written.
By the statements above, the writer concluded that survey research
was a process of collecting information about the respondents of population.
In this research, the writer also did not control over the independent variable
as non experimental research. Therefore the writer used the quantitative and
survey research to measure the students’ perceptions towards search engine resources as learning media to promote reading comprehension at Study
Program of English Education of IAIN Palangka Raya.
3
Donald Ary, and friends, Introduction to Research in Education Eight Edition, USA: Wadsworth, 2010. p. 648.
4
John Crasswell, Research Desaign Qualitative and Quantitative, California: Sage Publication, inc, 1994, p. 145.
5
B.Place and Time of the Study
A research was conducted at Palangka Raya, especially at Campus of
IAIN Palangka Raya. This research was conducted on September 13 up to
November 13, 2016 in 2016/2017 academic years of IAIN Palangka Raya.
C.Population and Sample
1. Population
The larger group about which the generalization is made is
called population. Population is defined as all members of any
well-defined class of people, events, or objects.6 While in this research, the
population is all of the English Department Students who had took
Reading Comprehension Course from the students in academic year of
2014/2015 and 2015/2016 of IAIN Palangka Raya which consisted of
134 students.
2. Sample
The small group that is observed is called a sample. A sample
is a portion of a population.7 The writer chose the subject based on the cluster sampling criteria which took Reading Comprehension Course.
As mention previously, the writer used cluster sampling criteria.
Cluster sampling A probability sampling technique that
randomly selects and uses whole naturally occurring groups such as
intact classrooms or entire voting precincts as the samples (clusters)8
6
Donald Ary, Lucy Cheser Jacobs, Chris Sorensen, and Asghar Razavieh, Introduction to Research in Education, Canada: Wadsworth, 2010, p.148
7
Ibid.
8
The population of this research was the students of English Education
Study Program 2014/2015 and 2015/2016 academic years of IAIN
Palangka Raya which total of 124 students. Another procedural
requirement is that once a cluster is selected, all the members of the
cluster must be included in the sample.9 This research was factually prepared with the sample in a group of classes where the students in it.
D.Data Sources
Sources of datas were the subject where the was found. In this
research the writer found and take the data by the students’ perceptions towards internet resources as learning media to promote reading
comprehension at Study Program of English Education of IAIN Palangka
Raya. The information was by students’ perception about their reactions to learning and classroom instruction and activities. To collect the information
therefore the writer did meetings with the students.
E.Research Instrument
1. Instrument
To get the data accurately, it was important to use the instrument,
for it was the tool to get the data on the field. In collecting the data
questionnaire and interview were used in this study to answer the
problem of the study.
9
a. Questionnaire
Brown in Zoltan Dornyei, stated questionnaire is any
written instruments that present respondents with a series of
questions or statements to which they are to react either by
writing out their answers or selecting from among existing
answers.10 Survey questions can take a variety of forms. The one main type of questions is close-ended questions.11
The close-ended questions was used on this research. This
type was suitable with the topic of the research which asks the
students’ perceptions towards search engine as learning media to
promote reading comprehension. By using this type of question,
the students’ response toward Search Engine as Learning Media
to Promote Reading Comprehension can be measured and
maximizes people’s freedom of response. In compiling the results
of the research, the coding was done, because Likert scale was
used, and the interval scales also was used to code the question.
The questionnaire is constructed in the form of Likert Scale. In
research, the writer used interval scale and collected the data by
using the questionnaires both of the close-ended and likert types
questions. This research was about students’ perception which was known as attitudinal information. Often attitude scales on a
10
Zoltan Dornyei, “Questionnaires in Second Language Research Construction, Administration, and Processing” London: University of Nottingham, Lawrence Erlbaum Associates, Publishers, 2003, p.6.
11
questionnaire are also treated as interval scales. For example,
frequently when Likert-scales was used, each response was given
a number (e.g., strongly agree = 1, agree = 2, disagree = 3, and
strongly disagree = 4) and these numbers are treated as interval
scales.12 The questionnaire is constructed in the form of Likert Scale which consists of 20 items. By the statement above, the
writer chose this kind of questionnaire to make the research took
short time in analyzing and low budget.
The situation may be more serious when a questionnaire
was administered in languages that the respondents were learning,
which the case was often in applied linguistic research. It was
therefore understandable that for respondents with literacy
problems or with limited L2 proficiency, filling in a questionnaire
can appear an intimidating or overwhelming task.13 Therefore,
Bahasa Indonesia was used in questionnaire of this research.
The questionnaires was adopted from the journal entitled
The Students’ Perception of The Use The Search Engine (ICT) as
Teaching Media in Reading Course conducted by Sudiran.
The questionnaire was focused on answering the problem
of the study, and found the problems was exist in the directions’ clarity of the questionnaire, and which items might be confusing
12
Ibid.p. 42.
13
for respondents to answer. Therefore, the pilot study was done.
Here were several procedures;
1. Did cluster sampling,
2. Prepared the pilot questionnaire,
3. Gave try out to the respondents,
4. Collected the responses,
5. Calculated the result of the pilot,
6. Analyzed the data obtained to know the instrument validity,
instrument reliability, and central tendency.
b. Interview
The interview was used for completing the data that found
by the questionnaires. Interview is an oral questioning of a
subject.14 Questions can be designed to find out more about teachers’ and learners’ opinions and attitudes about various aspects
of language learning, such as their feelings about the use of
particular classroom activities or the content of classroom
materials.15 Interview was done to be useful in order to obtain more
information of the students’ perceptions towards web based resources as learning media to promote reading comprehension at
Study Program of English Education of IAIN Palangka Raya.
14
Donald Ary, Lucy Cheser Jacobs, Chris Sorensen, and Asghar Razavieh, Introduction to Research in Education, Canada: Wadsworth, 2010, p.644.
15
Informal conversational interview was used in this study
which is done by doing face to face interview with participants.
The success of interview was related to the wording of the
question. One way to avoid the problems that can arise from
students’ lack of English proficiency is, if possible, to allow
students to be interviewed in their first language.16 The respondents were students of English Education Study Program from different
academic years, the students in academic year 2014/2015 and
2015/2016 at IAIN Palangka Raya. The respondents were 13
respondents who decided by 10% from the sample as the
respondents for interview by the sampling.
In this research the writer conducted face to face interviews
with participants. The interview was needed to do because,
interviews were ways for participants to get involved and talk
about their views. In addition, the interviewees were able to discuss
their perception and interpretation in regards to a given situation.
It was their expression from their point of view.
The informal conversational interviews used for gathering
the data by interviewing the respondents. Conversation was not
being used here in the general sense of informal interactions that
have no particular agenda because these conversations do have a
purpose and very unstructured. The success of an interview is
16
related to the wording of the questions. One way to avoid the
problems that can arise from students’ lack of English proficiency
is, if possible, to allow students to be interviewed in their first
language.17 As a consideration, the writer thought that was
necessary to put interview in one of the instrument applied. In
order to support the questionnaire that was given to the students,
teachers’ sight was covered in interview where the students were as
respondent of study. Depending on the design, this research
observed the data by the students of English Educational Program
of 2014/2015 and 2015/2016 academic years. The Indonesian
language used for avoid the respondents’ misunderstanding
comprehension of the question.
F. Endorsment of The Data
1. Try Out
Before the instrument was applied to the real sample of the
study, trying out an instrument was done. The test instrument was to
gain information about the instrument quality that consists of
instrument reliability and validity. Procedures of the try out were as
follows:
a. Trying out the instruments to some students,
b. Giving score to the students’ answer,
17
c. Then analyzing the data obtained to know theValidity and
Reliability
The instrument try out or pilot study was applied on September,
8th 2016. The instrument pilot study was given to each students of
academic years 2013/2014 who had took reading comprehension
course.
2. Validity
Validity is defined as the extent to which scores on a test enable
one to make meaningful and appropriate interpretations.18 Validity is the most important consideration in developing and evaluating
measuring instruments.19 Face Validity is taken to ensure that the
questionnaire is valid. Face validity is a term sometimes used in
connection with a test’s content. Face validity refers to the extent to which examinees believe the instrument is measuring what it is
supposed to measure.20 The questionaire was tested by conducting pilot study to small number of students. Doing pilot study was not only to
know the students’ difficulties in answering the questionnaire, but also
to measure the construct validity of the questionnaire.
618 Donald Ary, Lucy Cheser Jacobs, Chris Sorensen, and Asghar Razavieh, Introduction to Research 7in Education, Canada: Wadsworth, 2010, p.224.
19
Ibid.p.225.
20
In this research the writer calculated the results of the pilot
study using SPSS 20.0 Program. The total item was 20 items in small
number of students.
By comparing and analyzing between the pilot study results
and the critical values of the Pearson Product Moment Correlation
Coefficient. The data were found as follow:
Table 3.1.
The Validity of the Research Using SPSS 20.0 Program
Results of Face Validity
No. Item Value Critical Value Validity
1. Item 1 1,000 ,444 Valid
2 Item 2 ,645 ,444 Valid
3 Item 3 ,650 ,444 Valid
4 Item 4 ,316 ,444 Invalid
5 Item 5 ,519 ,444 Valid
6 Item 6 1,000 ,444 Valid
7 Item 7 ,519 ,444 Valid
8 Item 8 ,650 ,444 Valid
9 Item 9 ,730 ,444 Valid
10 Item 10 ,645 ,444 Valid
11 Item 11 ,439 ,444 Invalid
12 Item 12 ,519 ,444 Valid
13 Item 13 ,300 ,444 Invalid
14 Item 14 ,194 ,444 Invalid
15 Item 15 ,730 ,444 Valid
16 Item 16 ,300 ,444 Invalid
17 Item 17 ,247 ,444 Invalid
18 Item 18 ,055 ,444 Invalid
19 Item 19 ,440 ,444 Invalid
From the above table it can be explained that there were from
20 items, there were 9 items was not valid and 11 items were valid.
The wiriter chose the items were not valid and repaired the items. The
items were important was choosen and dropped out the items were not
important. Therefore, there were 16 items was used in questionnaires
items, and there were 4 items was deleted.
The second was construct validity, the writer assessed construct
validity by having some colleagues such as advisor and some lecturers
who have credibility to judge the questionnaire. Afterwards, the
questionnaires were distributed to 124 students.
3. Reliability
The reliability of a measuring instrument is the degree of
consistency with which it measures whatever it is measuring. On a
theoretical level, reliability is concerned with the effect or error on the
consistency of scores.21 In designing a survey, as in all research, it is essential for researchers to strive for reliability. In order to assure the
reliability of a survey, several measures can be used. First, the same
survey can be given on two occasions to the same individuals. Then
the researcher can check to see how consistently the respondents gave
the same response to the same item. The second way of assuring
reliability is to have two forms of a survey and have individuals take
both forms. The consistency of response on these two forms could
21
again be checked. The final way to achieve reliability is to check the
internal consistency of responses in a survey. In this case, if a survey
contains several items that ask similar questions but in different forms,
then the researcher can check to see how consistently the respondents
have answered these questions.22
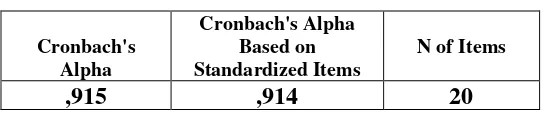
It was using SPSS 20.0 program in finding the reliability. The
degree of alpha’s cronbach alpha is higher than r table (0.444). The
result of reliability above as follows:
Table 3.2
Table of Reliability
Cronbach's Alpha
Cronbach's Alpha Based on Standardized Items
N of Items
,915 ,914 20
In this research, the writer found the consistent responses by
the students when the writer did pilot study either in questionnaire or in
interview. These all have significant similarities in the observation
which has been done by the writer.
To support the validity and the reliability of the data, the writer
did the triangulation of the data. The writer used method triangulation
as the supporting method in collecting the data. As stated above, the
writer used interview for completing the data that found by the
questionnaires.
22
4. Content Analysis
In this study, the writer used Content or Document Analysis
design. Ary states that,
“content or document analysis is a research method applied to written or visual materials for the purpose of identifying specified characteristic of the material. The materials analyzed can be textbooks, news paper, web pages, speeches, television programs, advertisement, musical composition, or any of a host of other types of documents. Content analysis is widely used in education.23
The writer used this research design because the writer analyzed
the students’ responses product. And it was formed in a questionnaire.
G. Data Collecting Procedure
Validity is defined as the extent to which scores on a test enable
one to make meaningful and appropriate interpretations.24 Validity is the most important consideration in developing and evaluating measuring
instruments.25 Face Validity is taken to ensure that the questionnaire is valid. Face validity is a term sometimes used in connection with a test’s content. Face validity refers to the extent to which examinees believe the
instrument is measuring what it is supposed to measure.26 Doing pilot study was not only to know the students’ difficulties in answering the
questionnaire, but also to measure the construct validity of the
questionnaire.
To collect the objective data, this research had several steps as follows:
23
Ibid.p.457
624 Donald Ary, Lucy Cheser Jacobs, Chris Sorensen, and Asghar Razavieh, Introduction to Research 7in Education, Canada: Wadsworth, 2010, p.224.
25
8Ibid.p.225.
26
1. Prepared the questionnaire.
2. Try out validity and reliability
3. Gave the questionnaire to the respondents.
4. Collected the responses.
5. Calculated the result of responses.
6. Analyzed the data obtained using SPSS Version 20.
7. Did interview
8. Concluded the students’ perceptions towards seacrh engine as learning media to promote reading comprehension at Study Program of English
Education at IAIN Palangka Raya.
H. Data Analysis Procedure
After the all data had been collected, the next step was analysed the
data. To analyse the data obtained from the field, several techniques were
conducted, namely data reduction, and data displaying.
1. Data Reduction
In this research, interval scale was used and collecting the data
by using the questionnaires both of the close- ended and Likert type
questions. This research was about students’ perception which is known
as attitudinal information. Often attitude scales on a questionnaire are
also treated as interval scales.
There were three steps to analyse the data; they are item scores, the
distribution of frequency, and then central tendency. To analyse the
a. Collecting the main data (item score/responses);
b. Arranging the collected score into the distribution of frequency of
score table.
c. Calculating Mean using formula, Median, and Modus.
1) Mean
∑X X = N
Where:
X = Mean value
Σ = Sum of
X = raw score
N = Number of case. 27 2) Median
The median is defined as that point in a distribution of
measure which 50 percents of the cases lay28. Example:
18 20 22 25 25 30
Median: any point from 22.5 to 24.5 fits definition of the
median. In this case, 22.5 + 24.5 = 23.5
3) Modus/Mode
The mode is the value in a distribution that occurs most
frequently29. Example:
14 16 16 17 18 19 19 21 22
27 Ibid,
Donald Ary, et al, Introduction to Research…, p.109.
28Ibid
, p.110
29
The mode of this distribution is 19 because it is the most
frequent score.
d. Calculating the deviation score and standard deviation using the
formula:
1) Deviation Score
= X −X
= Deviation Score
X = raw score
X = Mean
2) Standard Deviation
= ∑
s = √∑
s = √∑ ∑
Where =
∑ = sum of the squares of each score (i.e., each score is first
squared, and then these squares are summed)
∑ = sum of the score squared (the scores are first summes,
and then this total is squared)
N = Number of cases
e. Interpreting the analysis result.
2. Data Displaying
A numerical code is assigned to the data; the data needs to be
recorded in some fashion. The best way to do this is in some type of a
table in which a researcher identifies the respondents in the left-hand
column and uses the rows in the table to list the participant’s response to each item.30
Once the information is compiled in a table, it needs to be
displayed in some ways. There are several possible alternatives.
a) One is to simply report the frequency of each response. Hence, in
the example of having students rank the importance of each skill,
one could simply describe how many students ranked writing as
one, and how many ranked listening as one, and so on.
b) A second alternative is to describe the results in percentages. If
researchers choose to describe the results in terms of frequency or
percentages they could also display these results in a figure using a
bar graph or pie chart. Visually displaying results in this way often
makes it easier to highlight the results of the survey.
c) Finally, with interval scales one could describe the data in terms of
central tendency. As mentioned earlier, attitude scales are often
treated asinterval scales so that the central tendency of Likert-scale
questions is sometimes calculated. The most common types of
central tendency are the mean, mode, and median. The mean or
30
average is calculated by adding up the scores and dividing by the
number of participants. The median is the number in a set of
numbers that represents the point at which 50% of the items are
above and 50% are below. The mode is simplythe most common
number. 31
The writer adopted the Fukuda’s way to display her data results. The writer used questionnaire with the close ended questions and likert
type scale (strongly agree, agree, strongly disagree, disagree) as the
instrument for collecting the data. In addition, the table also includes the
percentage of respondents for each response and finally the mean for the
question. The table also included the percentage of respondents for each
response and finally the mean for the question. In this research,
questionnaire was used with close-ended question and Likert type scale
to collect the data. Therefore, the table on this research included the
percentage of respondents for each response and finally the mean for the
question.
3. Data Transformation
The data was taken in interval scale in the questionnaires both of
the close-ended and likert types questions was transformed into number.
By doing this data transformation, the writer could analyze the students’ perception.32
31
Ibid.p.42.
32