CHAPTER III RESEARCH METHOD
This chapter was going to discuss research time and place of the study,
research design and approach, population and sample, research instrument,
instruments try out (research instruments reliability, research instruments validity,
index of difficulty), data collection, data analysis procedures.
A. Time and Place of The Study
The study was conducted at the MTs Islamiyah which located on Jl. Dr.
Murdjani Palangka Raya.
B. Research Design and Approach
This study uses quantitative design. It is quantitative design because
quantitative is the data that from of number using statistic data. According to Donald
Ary “Quantitave research a ginnery employing operational definitions to generate numeric data to answer predator mined hypotheses or questions.”1
Creswell states
that a quantitative study, consistent with the quantitative paradigm, is an inquiry into
social or human problems based on testing a theory composed of variables, measured
with numbers, and analyzed with statistical procedures, in order to determine
whether predictive generalization of the theory hold true.2
The writer applied the quasi experiment approach. Experimental design is a
study design in which the researcher imposes some artifical constraints in the setting,
manipulates the indepedent variable to establish cause-effect relationship or both.
1Ary Donal, et…all.
Introduction To Research In Education Ceight, Canada: Wadsworth Engage Learning, 2010,p. 648.
2
John W.Creswell, Qualitative And Quantitative Approach, 1994, california: SAGE Publications, inc, 1994, p.2
Experimental design is a plan for an experiment that specifies what independent
variables will be applied, the number of levels of each, how subjects are assigned to
groups, and the dependent variable. In the present study, the writer typically compare
two groups, one of which (the experimental group) receives the treatment, while the
other (the control group) does not. The nonrandomized control group, pretest–
posttest design is one of the most widely used quasi-experimental designs in
educational research. The design is as follow :3
Tabel 3.1
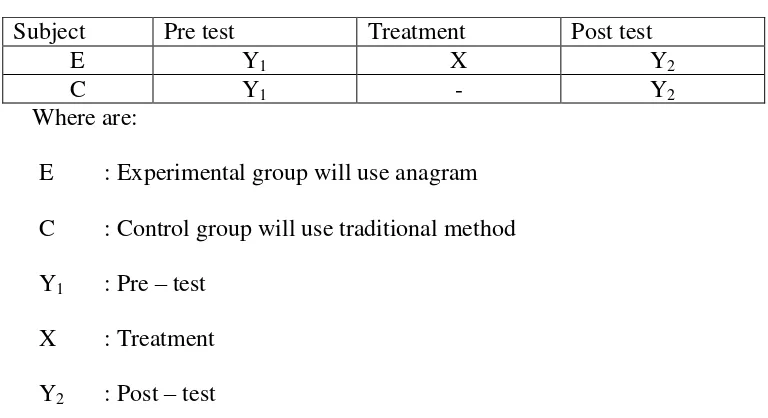
Nonrandomized Control Group, Pretest–Posttest Design
Subject Pre test Treatment Post test
E Y1 X Y2
C Y1 - Y2
Where are:
E : Experimental group will use anagram
C : Control group will use traditional method
Y1 : Pre – test X : Treatment
Y2 : Post – test
Because both of experiment group and control group take some pre test and
post test, and the study has done at the same time. The experiment group just
learning english and apply the anagram (the threatment) and the control group was
taught using traditional method.
C. Population and Sample of the Study 1. Population
3
Population is the whole of research subject, if someone wants to
research all of the elements in research area his research is called population
research on survey study.4
A population is defined as all members of any well defined class of
people, events, or objects.5 The population in this study was all students of eight
grade of MTs Islamiyah of Palangka Raya. There are four classes in the eight
grade of MTs Islamiyah of Palangka Raya. There were 97 of the eight grade
students that divided into three classes.
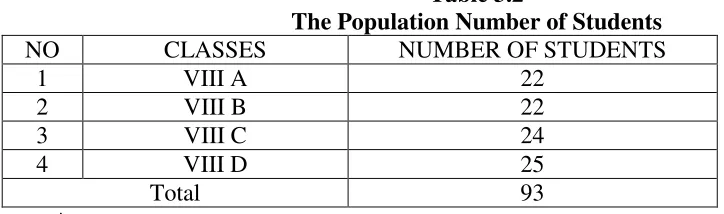
Table 3.2
The Population Number of Students
NO CLASSES NUMBER OF STUDENTS
1 VIII A 22
2 VIII B 22
3 VIII C 24
4 VIII D 25
Total 93
\
2. Sample
Sample is a part of population. According to Arikunto, sample is some or
represent of population that is researched.6 It is a group selected from population
for observation in a study. The writer takes two classes of MTs Islamiyah of
Palangka Raya will be the sample, the first class is experiment group use
4
Suharsimi Arikunto, Procedure Penelitian :Suatu Pendekatan Praktek. Jakarta : PT. Rineka Cipta, 2000,p.108
30
David Nunan, Research Methods in Language Learning,Cambridge: Cambridge University Press,1992 , p. 232
6
Anagram and the second class is control group non-use Anagram. Due to the
intact class, the writer cannot use simple random sampling to select the sample.
According to Ary, it is very difficult, if not possible to list all the members of a
target population and select the sample from among them.7 Therefore, the writer
used cluster sample sampling. Because the unit chosen is not an individual but a
group of individuals who are naturally together or grouped by the school.8 Those
are all the Students of VIII A and VIII B of MTs Islamiyah Palangka Raya.
Table 3.3 Number of Sample
NO Group Class of student Number of students
1 E VIII A 22
2 C VIII B 22
Total Number 44
E : Experiment Group
C : Control Group
D. Research Instrument
Instrument of the study is very needed in the research. It is because the
instrument is tool to get the data of study, in which the data is the important things to
help the writer in answering the problem of the study and also to prove the hypothesis.
The data also needed to find the aim of study. It is to measure the effect of using
anagram in teaching English vocabulary to the eight grade students at MTs Islamiyah
Palangka Raya.
7
Donal Ary, (et all) Introduction To Research In Education Eight, United state : Wadsworth (engange Learning, 2010), p. 649.
8Ibid,
The writer collected the data of this study by using a test and the result of the
test to measure the students’ vocabulary scores about anagram. The test is vocabulary test. According to Heaton, a test of vocabulary measures the students’ knowledge of the meaning of certain words and word group.9 In this study, the writer used gap fill
items to check the students’ vocabulary scores and the total number of test is eighty two questions.
The categories of the specification as follows :
Table 3.4
The Content Specification of Test Items No
Indicators Total Items Percentation
1 Noun 51 Items 62,20 %
2 Verb 25 Items 30,49 %
3 Adjective 6 Items 7,31 %
Total 82 Items 100 %
Based on table above the specification for noun there are 51 items, 62,20%, verb
there are 25 items, 30,49 %, and adjective there are 6 items, 7,31%, so the total items
there are 82 items.
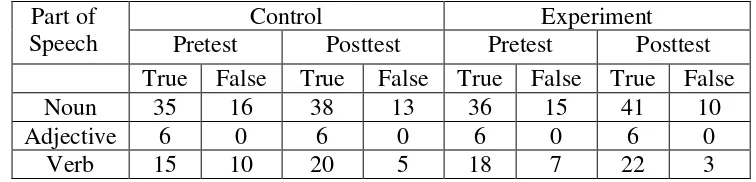
To know the compare score of test items as follows:
Table 3.5
The Compare Score of Test Items Part of
Speech
Control Experiment
Pretest Posttest Pretest Posttest
True False True False True False True False
Noun 35 16 38 13 36 15 41 10
Adjective 6 0 6 0 6 0 6 0
Verb 15 10 20 5 18 7 22 3
9
The writer make test based on the material and be appropriated with
syllabus that used by the school. The writer gave pre-test and post-test to the both
experimental and control group. Pre test is a test given before the writer gives
treatment. The function of pre test is to know how are the students’ vocabulary scores before they taught by using anagram. Post test was a test given after a lesson or a
period of instruction. The function of post test was to know how are the students’ vocabulary scores after they taught by using anagram.
A. Instruments Try Out
Instruments are a number of question to test vocabulary size. Before
instruments are used to test vocabulary size, the writer took conduct try out. The
porpuse is to see whether test (instruments) have fullfied characteristic of a good
test. Try out is used to measure the suitable instrument and the students’ vocabulary size. Instrument try out is definitely important before the instrument tested to the real
sample. The try out test used to validity and reliability, so the writer conducted try
out before the test given to the sample to this research. The purpose of instrument try
out is in order to validity and reliability of the test item. The try out were done by
10- 20 % students of the total number of the population. The writer chose 21 the
eighth grade students(VIII D) MTS Islamiyah include nine man and eleven women
to follow the try out. The try out was conducted on Monday 23 September 2015,
09.00 am at MTS Islamiyah Palangka Raya. The 21 students were done the tryout of
Vocabulary test. After doing try out all of item were valid and can be given as the
instrument of the study. The results of try out there are 82 items valid and there are
There are the procedures that in carrying out this try out as follows:
a. Preparing the instrument
The wirter preparing the instruments vocabulary test,for the students test.
b. Telling to the students how to do
The writer telling to the students about how many test items for vocabulary
test.
c. Giving the test items to students.
The writer giving test items, who is giving of the test? The test gave of the
eight grade student’s junior high school. Where place of test? The place of
test at MTS Islamiyah Palangka Raya. What did the students of test? The
students correct the answer of the question vocabulary test. How the students
answer of the test? The students answer of the question based on their
knowledge.
d. Collecting the students’ work
The writer collecting the students’ work, after the students finished the
answer of the question.
e. Scoring the students’ work
The writer gave score the students’ work use formula.
The writer calculating the result of test use formula based on the book
f. Analyzing the result of the test and enter it in to the table
The witer analyzing the result of the vocabulary test and enter to the tabel.
g. Calculating the result
Reliability is necessary characteristic of any good test: for it to be valid at
all, a test must be reliable as measuring instrument.10 According to Susan
Stainback, reliability is often defined as the consistency and stability of the data
or finding. From a positivistic perspective, reliability typical is consideres to be
synonimous with the consistency of the data produced by observation made by
different researchers, by same researcher by the same researcher at different
times, or by splitting a daa set in two parts. To measure the reability test, the
writer used SPSS 2.1. (See Appendix 7.1).
2. Research Instruments Validity
The validity of a test is the extent to which measure, what is supposed to
measure and nothing else.11 According to Gronlund “content validity is the process of determining the extent to which a set of test tasks provides relevant and
representative sample of the domain of tasks under consideration.”12
Instrumentation validity discuss about construct and content validities of the test
which use in this research.
a. Face validity
This type of validity, in fact is often referred to as face validity : if a
test item looks right to other testers, teachers, moderators, and tastes.
10
J.B. Heaton, Languauge Tesingt(Published Tests, May 1989), p.155
11
Anas Sudijono, Pengantar evaluasi Pendidikan, Jakarta: Raja Grafindo Persada, 2005, p. 185.
12
The test used by the writer is suitable to others and the same level
that is Junior High School level. So that is why, the writer makes the type of
test items also suitable in the eight grade students at the MTs Islamiyah of
Palangka Raya. the face validity of the test item as follows :
1) The kind of the test is vocabulary test which is about noun and verb.
2) The forms of the test items is arrangement words.
3) The language of items uses English.
4) The test items are suitable to the secondary school.
Face validity concerns the appeal of the test to the lay judgment,
typically that of the candidate, the candidate’s family, members of the public and so on. Sometimes the students do not know what is being tested when
they tackle a test. Sometimes they feel that the test doesn’t test what it is
supposed to test. A test has face validity if it is carefully constructed, it has a
well thought-out format, its items are clear and uncomplicated, its difficulty
level is appropriate for students, and the condition for all students is the same.
b. Construct validity
Construct validity is type of validity which assumes the existence of
certain learning theories or construct underlying the acquisition of abilities
and skills. In this case, the test is a written test in order to measure the
students’ vocabulary size. It is type of validity that is essential for tests that
are used to individuals on certain abilities. Then, to measure the validity of
the instrument, the writer used SPSS 2.1.
The test item in this research is to measure the students’ English
vocabulary size and base on the English teaching learning curriculum apply
in MTs Islamiyah of Palangka Raya. In making the test, the writer try to
match each of item test with the curriculum that is used by MTs Islamiyah of
Palangka Raya.13
3. Index of Difficulty
According to Heaton the index of difficulty or facility value is the
fraction or percentage of the students who answer the item correctly.14 It is use to
show how easy or difficult the particular item proved in the test. The index
difficulty can be known by the formula:
FV =
Where:
FV = facility value (index of difficulty).
R = represent the number of correct answer.
N = the number of students taking the test.
Then the result of the formula above is related to be value of F.V as in the
following on:
F.V 0.00-0.30 = Difficult
F.V 0.30-0.70 = Fair
F.V 0.70-1.00 = Easy
13
J.B. Heaton, Writing Language English Test, London: Logman 1974, p.153-154
14
4. Index Homogeneity
It is used to know whether experimental group and control group, that are decided, come from population that has relatively same variant or not. The
formula is: 15
F =
Notice:
F: Frequence
The hypothesis in homogeneity:
Fvalue ≤ Ftable, Means both of variant are homogeneity.
Fvalue > Ftable, Both of variant are homogeneity.
If calculation result of F is lower than F table by 5% degree of
significance so HO is accepted, it means both groups have same variant.
1. Index Normality
It is used to know the normality of the data that is going to be analyzed
whether both group have normal distribution or not.
Chi square is used here: 16
=
Notice:
15
J.B. Heaton, Writing English Language Test, Longman, 1975, p. 172.
16
= Chi square
= frequency from observation
= expected frequency
Calculation result of is compared with x table by 5% degree of significance. If
is lower than x table so the distribution list is normal.
2. The formula They are: 17
a. Mean : Mᵡ =∑
Where:
Mx: Mean
N: Number of case
Fx: Total result product between each score with frequency.
b. Median : M
Where:
Mdn: Median
N: Number of ease
Fkb: Cumulative Frequency located in underscore content median
Fi: Authentic frequency ( frequency of score content median )
I: interval class
c. Modus : Mo =1 +
X
Where:
17
Mo: Modus
Fa: Frequency located in above interval content modus.
Fb: Frequency located in under content modus
d. Standard Deviation
SD= √∑
Where:
SD: Deviation Standard
I: interval class
Fx’: total result product between frequency each interval with X
N: Number of class
e. Standard Error
Sem = √
B. Data Collecting Procedures
To get the data, the writer uses some ways in this study. Those ways are:
1. The writer chose the place of the study.
2. The writer make instrument try out.
3. The writer showed the try out to the class that have been determined
4. The writer gave instruction to the students to do the test of try out.
5. The writer checked the result of test of try out.
6. The writer checked the validity and reliability of test.
7. The writer gave pretest to both classes.
9. The writer gave treatment to both classes. Experiment group using ( anagram)
and than control group using (traditional methode).
10. The writer gave posttest to both classes.
11. The writer checked the result of posttest.
12. The writer gave score to students’ answer (pretest and posttest). C. Data Analysis Procedures
The data of this study is students’ vocabulary ability score. Therefore, the
data are quantitative. To analyze the data has been collected; the writer used some
procedures in this study:
1. The writer collected score of test (pre test and post test).
2. The writer analyzed the data have been collected.
3. The writer gave score to the students’ test result by using the formula:
Score : x 100%
B: frequency of the correct answers
N: number of test item
4. Tabulating the students’ score into distribution of frequency in the table, then find out the mean of students’ score, standard deviation, and standard error of variable
X1 (Experimental group) and X2 (Control group).
5. Calculating the data by using t-testto test the hypothesis of the study, whether the
to examine the truth or falseness of null hypotheses states that between two of
Sample Mean taken randomly from the same population, there was no significant
different. 18
“t test” was used to measure whether animation pictures give effect to students’ english score using theformula as follows: 19
M1 – M2 to =
SEm1 – m2 Note:
M1 – M2 : The difference of two means
SEm1 – m2 : The standard error of the difference between two means To know the hypothesis is accepted or rejected using the criterion:
If t-test (the value) ≥ ttable,it means Ha is accepted and Ho is rejected. If t-test (the value) < ttable,it means Ha is rejected and Ho is accepted.
Interpreting the result of t-test. Previously, the writer counted the degrees of
freedom (df) with the formula: 20
df = (N1 + N2 – 2)
Note : df : degrees of freedom
N1 : Number of subject group 1
N2 : Number of subject group 2
2 : Number of variables
18
Anas Sudijono, Pengantar Statistik Pendidikan,Jakarta : RajaGrafindoPersada, 1987, p.278.
19
Ibid, p 284.
20Ibid
After that, the value of ttest was consulted on the ttable at the level of significance 1
% and 5 %. In this research, the writer used the level of significance at 5 %. If the
result or t-test is higher than ttable, it means Ha is accepted.
6. The writer concludes data analysis obtained.