EVALUATION OF BIOMEMBRAN WATER TREATMENT PLANT
Faculty of Civil and Environmental Engineering, Institut Teknologi Bandung, Jl. Ganesha 10 Bandung 40132
1[email protected] and 2[email protected]
Abstract : Biomembrane water treatment plant has been used to process river water in order to achieve the water quality of standard class II on the Cikacembang river. Over time, the facility has also developed into a water treatment plant system that serves the needs of the local people. The treatment plant consists of biomembrane and the supporting units, such as aeration container tanks and sand filter unit. The purpose of this study is to analyse the water quality in order to assess the performance of the biomembrane water treatment plant. The method used in this research is conducting analysis on water input of installations and water output or the processed water from nine major point, namely the inlet, outlet A, tank 2, tank 3, tank 4, the tank 5, tank 6, the tank 10 and the last outlet B with three variations of discharge flow. Afterwards, the quality of the water samples was compared with water quality standards based on the physics, chemistry and biology parameters. It should be noted that there are considerable incidences when comparing the ninth point and the Government Regulation No. 82 year 2001 for the category of water class II. It was inquired that there are several water quality parameters that has exceeded water quality standard class II; this parameters are: phenols (0.2245±0.3069 mg/L), fecal coliform (9.3x10⁴±2.1x10⁵ Total/100 mL) and total coliform (8.98x10⁵± 2.42x10⁶ Total/100mL). As for the outlet B outcome
is ready to be distributed compared with Health Ministry Regulation No. 416 year 1990 for the category of clean water and drinking water, Health Ministry Regulation No. 492 year 2010 for drinking water and PP 82 of 2001 category of water class I. Based on the result, water comply to clean water standard rather than drinking water standard. But for clean water also contained several water quality parameters that has exceeded water quality standards is total coliform (2x10⁴±3.46x10⁴ Tot/ 100 mL ). In general, the performance of the biomembrane water
treatment plant delivers a decent performance, given the flow variation of 0,5 m3/min, while viewed from average
efficiency the largest removal efficiency of color (95.64%), turbidity (98.48%), Biochemical Oxygen Demand or BOD (94.06%), cyanide (95.53%) ammonium (93.33%), total coliform (95.32%) and fecal coliform (98.10%), while the smallest removal efficiency of hardness (11.67%), so we need additional units to increase the removal efficiency for these parameters.
Key words : clean water, water quality, biomembran water treatment system
WS-2
total coliform (95,32%), fecal coliform (98,10%) sedangkan efisiensi terkecil adalah parameter kesadahan (11,67%), sehingga perlu dilakukan penambahan unit untuk meningkatkan efisiensi penyisihan untuk parameter tersebut.
Kata kunci: air bersih, kualitas air, instalasi biomembran
INTRODUCTION
Pollution of water resources has occurred in the district of Bandung, especially in the industrial zone of Majalaya. The presence of industries is analogous with two sides of a coin; on one side it supports the formal sector by promoting economic activities, and on the other, it raises several social problems, notably those that were derived from the waste water discharged into the water bodies, thus disbenefits the local community. Several rivers have served as a sewage disposal bodies between industrial and domestic waste water, and the Cikacembang River serves as an example for the case (BPLH Kab. Bandung, 2014). From visual observations alone, one could convey that the river water condition is not in accordance with the regulation of river water quality class II. This is supported by mainly three indicators: color; odor; and no presence of water biota along the river.
Based on several indicators such as physical, chemical and biological, it is apparent that the Cikacembang River is contaminated. As a response of the matter, a biological based river-water-quality-treatment using biomembrane system was installed. The imminent goal was to achieve the class II category. Over time, the facility has been further developed into a water treatment system with additional supporting units, i.e. aerated water tanks and physical processing unit using a sand filter. This development has rendered the clean water output to be distributed among the local residents. The later was aimed to be utilized in order to achieve their daily needs.
In order to determine the extent of the treated water quality, hence tests were conducted at nine points in the biomembrane water treatment plant. Several indicators that was tested were: physical parameters (i.e. temperature, the residue suspended (TSS), color, turbidity and electrical condcutivity); chemical parameters (i.e. pH, biochemical oxygen demand (BOD), chemical oxygen demand (COD), dissolved oxygen (DO), total chromium, ammonium and sulphide); organic chemical parameters (i.e. phenol, oil and grease); biological parameters were tested using fecal coliform and total coliform. The result was then compared with Government Regulation No. 82 year 2001 for the category of II water class.
The purpose of this study is analysing the water quality to identify the performance of the biomembrane water treatment plant then comparing the latter with the available standard. The results of the water quality will indicate the removal efficiency based on each parameter in order to assess the performance of the biomembrane installation with different variations of flow.
MATERIALS AND METHODS
Location and Time Sampling
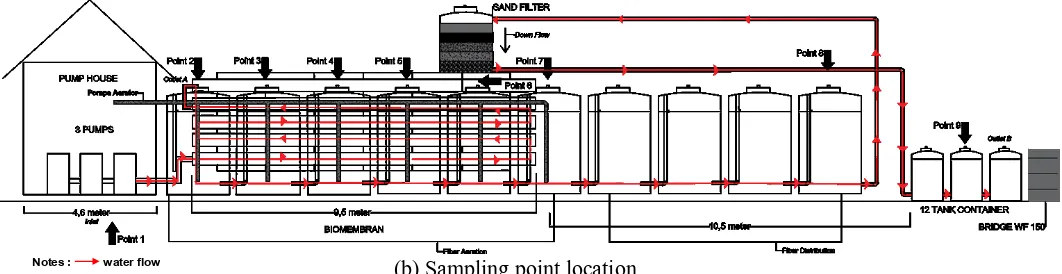
Sample collection was performed at the Biomembran Installation of water in the river Cikacembang in Kampung Pangkalan Raja RW 05, Desa Sukamukti, Kecamatan Majalaya, Kabupaten Bandung. (Figure 1.a) Samples were taken three times, i.e. 16 February, 3 and March 22, 2016. Sample collection was done from 07.30 until 10.00. Nine sample points were determined prior to the collection, i.e. inlet, outlet A, tank 2, tank 3, tank 4, tank 5, tank 6, tank10 and outlet B. This was done to determine the efficiency of the treatment process in the installation. There are nine points used to sample the water (Figure 1.b), namely:
• Point 1 : Inlet
Inlet is the point where feed goes into the pump, thus relayed into the water treatment plant that utilize biomembrane. Flow variation is achievable adjusted through the pump discharge. The first flow variation used was 1,5 m3/min, and consecutively the second and third flow are: 1 m3/min and 0,5 m3/min.
• Point 2 : Outlet A
Outlet A is the output discharged from the biomembrane system, that is then divided into two flows. One flow is diverted into the river and the other is diverted as a feed for the biomembrane supporting unit, in this case tank 1 with a capacity of 5300 L.
• Point 3 : Tank 2
Tank 2 is a tank provided with piped aeration. • Point 4 : Tank 3
Tank 3 is a tank provided with piped aeration. • Point 5 : Tank 4
Tank 4 is a tank provided with piped aeration. • Point 6 : Tank 5
Tank 5 is a tank provided with piped aeration. • Point 7 : Tank 6
Tank 6 is a tank provided with piped aeration. • Point 8 : Tank 10
Tank 10 is a reservation unit that have similarities with tank 1, however, no aeration is present. Water feed from tank 10 will be supplied to the processing physical unit i.e. the sand filter unit which is composed of silica sand, activated carbon, small pore zeolites, large pore zeolite and split corn coral arranged vertically. The output is diverted into 12 small tank that is used as a reservoir before discharged into outlet B. Afterwards, the result is further processed using activated carbon unit that serves to cleanse the feed through filtration while also eliminate undesirable taste, color, odor and other contaminants in the water (Khalkhali and Omidvari, 2005). The latter also functions as means to eliminate bacteria, colloids and viruses.
• Point 9 : Outlet B
Outlet B is the final outcome that is ready to be distributed to the local residents.
WS-4 Notes : water flow
(b) Sampling point location
Figure 1 Water sampling at nine points
Laboratory Analysis
Laboratory analysis was conducted in UPT Environmental Laboratory BPLHD Kabupaten Bandung located at Soreang. The method follows directly from Standard Method, Method HACH 2100 P, JIS K and IK. The analysis was providing comparison grounded on water quality class II with the nine main sampling points, with regards to physical, chemical, and biological indicators. Several analysis parameters were carried out immediately, while others were done the day after with reference to the preservation method. The results of the nine sampling points were then compared with the quality standards or water quality class II, namely Government Regulation No. 82 year 2001. The method used to analyze water samples, preservation methods and the number of water samples taken can be seen in Table 1 below:
Table 1 Research Methods
NO PARAMETER UNIT TREATMENT WATER
SAMPLE METHODS STANDARD
Physical Parameters
1 Temperature 0C Direct - Electrochemical SNI 06-6989.23-2005 (BSE,
2005)
2 Total Suspended
Solid (TSS) mg/L Cooling to 4
0C 500 Gravimetric SNI 06-6989.3-2004 (BSE,
NO PARAMETER UNIT TREATMENT WATER
Utilizing the pump, three flow variations were used to provide intake feed from the river water to the biomembrane water treatment plant.
Cikacembang River Water Quality Prior and After by Biomembrane Plant
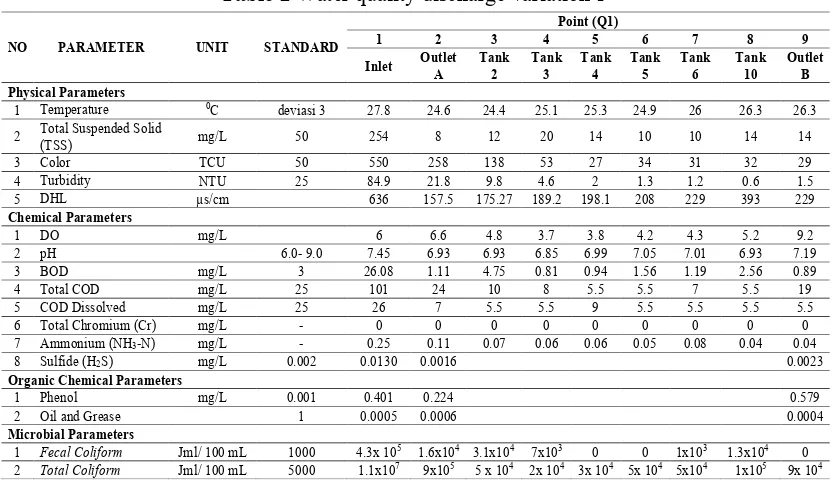
The processed feed from the biomembrane plant was expected to improve the quality of river water into Class II. Hence, the processed water that has been through the biomembrane system was compared with Government Regulation No. 82 year 2001 for the category of class II water. The results of water quality measurements on the biomembrane with Q1 flow variation can be seen in Table 2, Q2 flow variation in Table 3 and Q3 flow variation can be seen in
Table 4.
Table 2 Water quality discharge variation 1
NO PARAMETER UNIT STANDARD
WS-6
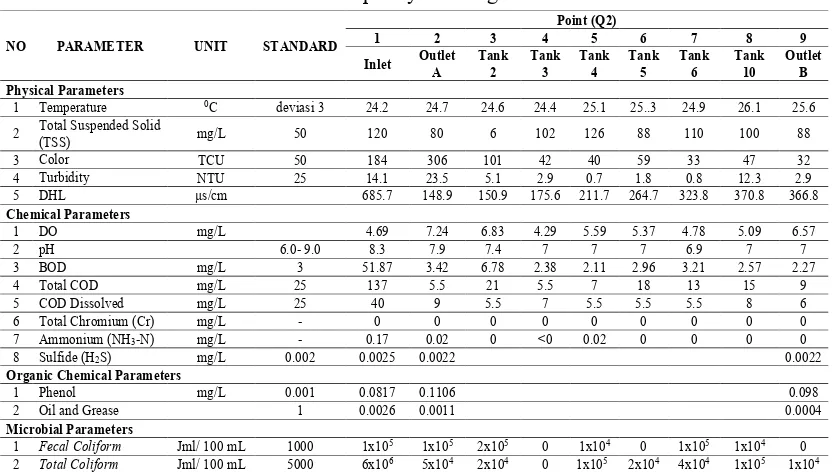
Table 3 Water quality discharge variation 2
Table 4 Water quality discharge variation 3
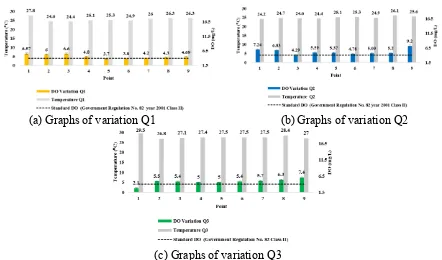
• Temperature and dissolved oxygen (DO)
The average DO value for the biomembrane plant is 5.41±1.39 mg/L. This value exceeds the standard provided by class II, which is 4 mg/L. This relatively high value could be interpreted that solubility of oxygen in the water is rather high. The temperature of the raw water and processed water in the installation is within the normal range, that is 26.3±0.7 0C. The water
sample temperature has a lower value compared to the ambient temperature; the former corresponds as an effective temperature for disinfection (Sururi et al, 2008).
Figure 2. a, b and c provides data for DO values and temperature for each of the three flow
variations. A distinct trend could be observed between the two parameters as the temperature is inversely proportional to the DO. This observation is supported by Sawyer et. Al (2003) where the latter states that high temperature corresponds to lower oxygen solubility in water.
NO PARAMETER UNIT STANDARD
Notes : Water quality standards based on The Government Regulation No. 82 year 2001 for the category of II water class
(a) Graphs of variation Q1 (b) Graphs of variation Q2
(c) Graphs of variation Q3
Figure 2 DO and temperature at nine point of the three variations of discharge flow
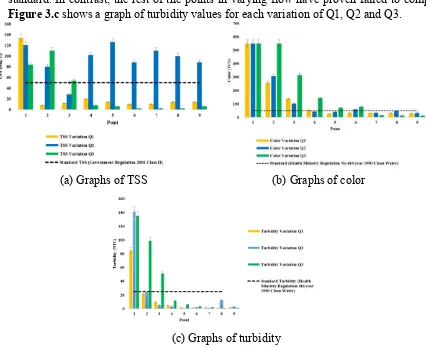
• Total Suspended Solid (TSS)
The biomembrane plant has a TSS value of 50.07±47.77 mg/L. Compared to the 50 mg/L provided by the class II, the plant’s TSS value is higher. In Q2 flow variations, the TSS value exceeded the standards in every point. However, difference is distinguishable in Q1 flow variation where only the value in inlet unit surpasses the standard and the rest are below it. The first three points in Q3 flow variation have exceeded the standard and the remaining abides it. Figure 3.a shows the TSS values for the 3 variations.
• Color
The average color value for the biomembrane plant is within the range of 152.14±188.47 TCU. Due to the lack of color parameter availability in the Government Regulation No. 82 year 2001 standard, the obtained values will be compared to Permenkes 416 of 1990 on the criteria for clean water. The result is clear, having a standard of 50 TCU, most points has proven unable to comply to this value. However, the last three points for every variation is in accordance with the regulation for having value below the standard. In general, the water color is attributed to brightness factors / turbidity, materials that float both living and dead (Sawyer, 2003). The color value for points in each variation is displayed in Figure 3.b.
• Turbidity
WS-8
standard. In contrast, the rest of the points in varying flow have proven failed to comply.
Figure 3.c shows a graph of turbidity values for each variation of Q1, Q2 and Q3.
(a) Graphs of TSS (b) Graphs of color
(c) Graphs of turbidity
Figure 3 Water quality analysis result at nine sampling points with variation Q1, Q2 and Q3
• Electrical Conductivity (EC)
Electrical conductivity measurement is rudimentary to be conducted in situ (on the spot) of the sampling location. Conductivity or EC is a numerical representation of the ability of water to conduct electricity (Effendi, 2003). Measurement shows that electrical conductivity values are within 319.87±339.63 μs/cm. Figure 4.a plots the value of DHL in all sampling points for all variations of discharge. Highest EC occurs in variation 3, specifically at the first sampling point (the inlet) which has a value of 1869 μs/cm. In the same variation also occurs the lowest value, which is 133.8 μs/cm, at the point 7 or tank 6. Hasunia (2006) states that in terms of the electrical conductivity measurement, only the ionized material that can be measured, organic molecules and other substances that dissolve without the ionization process will be omissioned from the measurement.
• The degree of acidity (pH)
(a) Graphs of DHL (b) Graphs of pH
Figure 4 Water quality analysis result at nine sampling points with variation Q1, Q2 and Q3
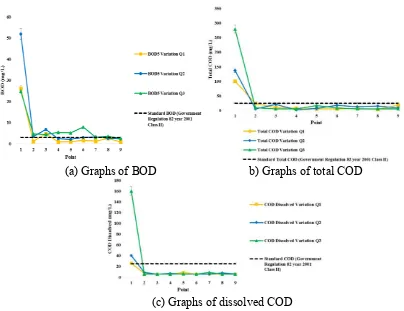
• Biological Oxygen Demand (BOD) and Chemical Oxygen Demand (COD)
Figure 5.a shows the measured BOD values for each points in each flow variation. This
resulted in an average BOD value of 10,96±6,63 mg/L. According to the standard class II, the standard BOD value is 3 mg/L, hence indicates that most of the points have exceeded this limit. However, some points are in accordance to this standard, i.e. point 8 variation Q1, point 8 variation Q2, and point 9 for all variations.
Besides BOD, total COD and dissolved COD were also measured in this study having a average value of 28.11±58.40 mg/L and 13.89±30.146mg/L consecutively. For dissolved COD results, all points across all variations are in accordance to the standard class II which is 25 mg/L. On the other hand, the total dissolved COD in point 1 for every flow variations denies compliance set by the standard above, nevertheless, the remaining points rests below the limit. Total COD can be seen in Figure 5.b, while dissolved COD is plotted in Figure 5.c.
(a) Graphs of BOD b) Graphs of total COD
(c) Graphs of dissolved COD
WS-10
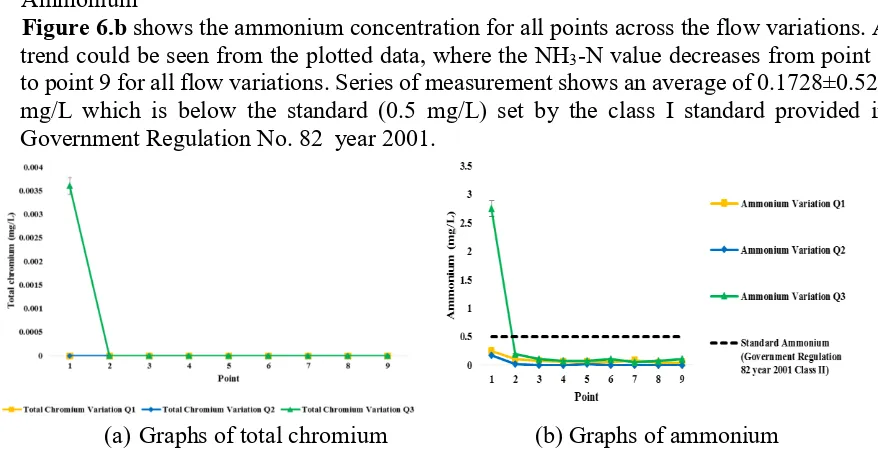
• Total chromium
The average value measured from the biomembrane plant for total chromium is 0 mg/L. This value does not necessarily mean an absence of the substance, rather it could be attributed to the very low sample values that possibly are below the limit of qualification (LOQ) for AAS, which is below 0.0026 mg/L for chromium. Thus, the reading will show a value of 0 mg/L. LOQ itself is the lowest numerical value of a substance that could measure by a method/instrument while maintaining a decent accuracy and precision. Figure 6.a
shows total chromium value for all the three flow variations.
• Ammonium
Figure 6.b shows the ammonium concentration for all points across the flow variations. A
trend could be seen from the plotted data, where the NH3-N value decreases from point 1
to point 9 for all flow variations. Series of measurement shows an average of 0.1728±0.529 mg/L which is below the standard (0.5 mg/L) set by the class I standard provided in Government Regulation No. 82 year 2001.
(a) Graphs of total chromium (b) Graphs of ammonium
Figure 6 Water quality analysis result at nine sampling points with variation Q1, Q2 and Q3
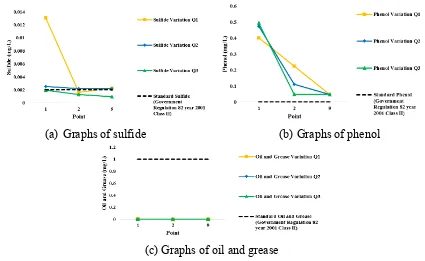
• Sulfide
Acid sulfide is a product of an imperfect overhaul from sulphur-containing organic materials due to anaerobic water conditions. This substance could be attributed to the increase of dissolved oxygen depletion and the generation of foul odor. Organic sulphur compounds could be contributed from industrial waste and household waste (Sawyer, 2003). Series of samples examinations shown in Figure 7.a plots the sulfide value at all points across all flow variations. The average value of the measured compound is 0,001831±0,000737 mg/L. In comparison, this value is smaller compared to the established standard based on Government Regulation No. 82 year 2001 which is 0.02 mg/L. However, some points show contradictory proof to the latter statement. This is the case of point 1 in flow variation Q1 and Q2, where it is most likely happened prior passing the biomembrane water treatment.
• Phenol
The solubility characteristic of phenol in water is 8.3 g/100 ml. It has properties that leans towards acid; this corresponds to its ability to release H+ ions from their hydroxyl groups.
The release of this ion renders C6H5O− anion phenoxide that could dissolved in the water.
Measurements provides an average value of 0.2245±0.3069 mg/L for phenol in the biomembrane plant. These measurements values exceeded the 0.001 mg/L limit set by standard class II under Government Regulation No. 82 year 2001 at all points for all variations. Figure 7.b shows the value of phenol for all variations of the discharge.
The average value of oil and grease parameters for biomembrane plant is 0.000333±0.000115 mg/L. These measurement values are significantly below the quality standards established class II standard set by Government Regulation No. 82 year 2001. Oil and grease measurements result at all points across all flow variations is shown in Figure 7.c.
(a) Graphs of sulfide (b) Graphs of phenol
(c) Graphs of oil and grease
Figure 7 Water quality analysis result at nine sampling points with variation Q1, Q2 and Q3
•Total Coliform and Fecal Coliform
Coliform group of bacteria is a type of bacteria that is commonly used as an indicator of substrate water, foodstuffs and so forth for the presence of harmful bodies as the determination of the sanitary quality of food and water (Suriawiria, 1996). Coliform bacteria are a mixture of fecal bacteria and non-faecal bacteria (Bambang et al, 2014). Measurements of total coliform parameters from the retrieved samples gives an average of 8.98x10⁵±2.42x10⁶ numbers/100 mL.
Class II standard provides a limit of 5000 numbers/100 mL, thus the earlier average value exceeds this value. Fecal coliform measurements results an average value of 9.3x10⁴±2.1x10⁵
numbers/100 mL. Similar with the total coliform case, these measurement values exceed the established limit according to the class II standard which is 1000 numbers/100 mL Figure 8.a
shows the value of total coliform and Figure 8.b shows fecal coliform measurements for all flow variations.
(a) Graphs of total coliform (b) Graphs of fecal coliform
WS-12
Clean Water Quality and Biomembrane Plant Performance
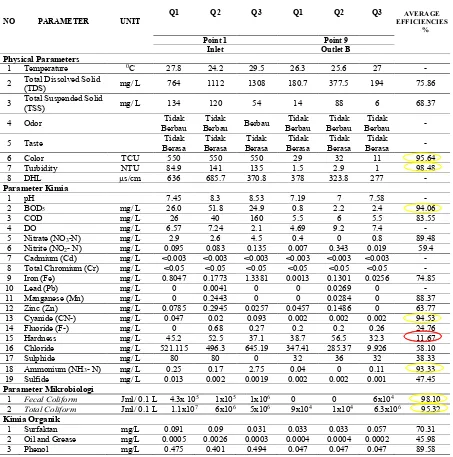
The clean water quality and efficiency of the entire installation biomembran in terms of the physical, chemical and biological parameters could be seen in Table 5, including the average efficiency value derived from all three flow variations efficiencies.
Table 5 Clean water quality and average efficiencies for biomembrane plant
Based on the efficiency values, it could be conveyed that the highest efficiency occurs in Q3 flow variation, which is 0,5 m3/min, while viewed from average efficiency the largest removal efficiency of, i.e.color, turbidity, Biochemical Oxygen Demand or BOD, cyanide, ammonium, fecal coliform dan total coliform, while the smallest removal efficiency of, e.i. hardness, so we need additional units to increase the removal efficiency for these parameters.
CONCLUSION
Derived of biomembrane water treatment plant result at nine sampling points and established standards of Government Regulation No. 82 year 2001 for class II category; one could convey that phenol (0.2245±0.3069 mg/L), fecal coliform (9.3x10⁴±2.1x10⁵ Total/100 mL) and total
coliform (8.98x10⁵± 2.42x10⁶ Total/100mL) have failed to comply with the existing regulation. As for the outlet B outcome is ready to be distributed compared with Health Ministry Regulation No. 416 year 1990 for the category of clean water and drinking water, Health Ministry Regulation No. 492 year 2010 for drinking water and PP 82 of 2001 category of water class I. Based on the result, water comply to clean water standard rather than drinking water standard. But for clean water also contained several water quality parameters that has exceeded water quality standards is total coliform (2x10⁴±3.46x10⁴ Tot/ 100 mL ). In general, the
performance of the biomembrane water treatment plant delivers a decent performance, given the flow variation of 0,5 m3/min, while viewed from average efficiency the largest removal efficiency of color (95.64%), turbidity (98.48%), Biochemical Oxygen Demand or BOD (94.06%), cyanide (95.53%) ammonium (93.33%), total coliform (95.32%) and fecal coliform (98.10%), while the smallest removal efficiency of hardness (11.67%). Hence, additional units are needed to increase the removal efficiency to achieve established water quality standards.
ACKNOWLEDGEMENT
This research has been technically supported by the Environmental Conservation Section (Bidang Konservasi Lingkungan) and Laboratory unit of the regency (BPLHD Kabupaten Bandung).
REFERENCES
Bambang, Andrian G. Fatimawati. Kojong, Novel S. (2014). Analysis of Coliform Bacteria Contamination and Identification of Escherichia coli in Water Refill of depots in Manado (in indonesian). Pharmacon Jurnal Ilmiah Farmasi. 3(3): 2302-2493
BPLH Kabupaten Bandung. 2014. Countermeasures Against Pollution CRB Article Search Google Sumba Techno Systems (in indonesian)
Effendi, H. 2003. Assessing Water Quality : Share Resources Management and Water Environment. (in indonesian). Kanisius : Yogyakarta
Gupta, P., Sunita, P. Saharan, 2009, Researcher, Physiochemical Analysis of Ground Water of Selected Area of Kaithal City (Haryana) India, Vol. 1, No. 2, 1-5
Hasunia, Ahda Megawati. 2006. Worth Drinking Water Quality Analysis at ITB , Final Project S1 , Environmental Engineering Department, ITB (in indonesian)
Khalkhali, R. Ansari dan R. Omidvari, 2005, Polish Journal of Environmental Studies,
Adsorption of Mercuric Ion from Aqueous Solutions Using Activated Carbon, Vol. 14, No. 2, 185-188
Indonesian Government Regulation No, 82 Year 2001 on the Management of Water Quality and Water Pollution Control (in indonesian)
Indonesian Health Ministry Regulation No. 416 Year 1990 on the criteria and Water Quality (in indonesian)
Indonesian Health Ministry Regulation No. 492 Year 2010 on the Drinking Water Quality Requirements (in indonesian)
Sawyer, Clair N. Mc Carty, Perry L. Parkin, Gene F. 2003. Chemistry for Environmental Engineering and ScienceFifth Edition pg 605-638. Mc Graw Hill : Boston
Suriawiria, U. 1996. Introduction of General Microbiology (in indonesian). Penerbit Angkasa : Bandung