Corresponding author:
*E-Mail: [email protected]
INTERPRETATION OF BOUGUER ANOMALY TO
DETERMINE FAULT AND SUBSURFACE STRUCTURE AT
BLAWAN-IJEN GEOTHERMAL AREA
Anjar Pranggawan Azhari1*, Sukir Maryanto1, Arief Rachmansyah2
1
Department of Physics, Faculty of Mathematic and Science, Brawijaya University Malang Jl. Veteran No. 1 Malang 65144
2
Department of Civil Engineering, Faculty of Engineering, BrawijayaUniversity Malang Jl. Veteran No. 1 Malang 65144
Recieved: 14th August 2016; Revised: 20th September 2016; Accepted: 29th September 2016
ABSTRACT
Gravity survey has been acquired by Gravimeter Lacoste & Romberg G-1035 at Blawan-Ijen geothermal area. It was a focusing study from previous research. The residual Bouguer anomaly data was obtained after applying gravity data reduction, reduction to the horizontal plane, and the upward continuation. The result of Bouguer anomaly interpretation showed the occurrence of new fault sand their relative movement. Blawan fault (F1), F2, F3, and F6 are the normal fault. Blawan fault is the main fault controlling hot springs at Blawan-Ijen geothermal area. F4 and F5 are the oblique fault and forming a graben at Banyupahit River. F7 is the reverse fault. Subsurface model shows that Blawan-Ijen geothermal area was dominated by the Blawan-Ijen caldera-forming ignimbrite (ρ1=2.670 g/cm3),
Keywords: Gravity; lineament; Bouguer anomaly; new fault; Blawan; geothermal; subsurface
Introduction
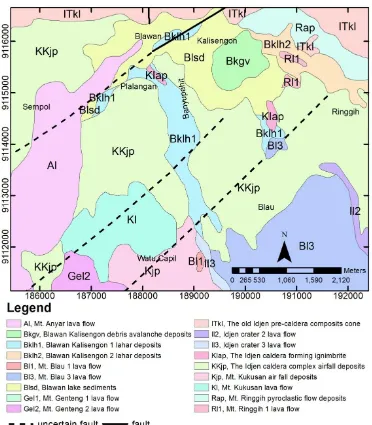
Blawan-Ijen area is located inBlawan – Ijen geothermal area, Bondowoso, East Java, Indonesia (Figure 1). It is inside Ijen Volcanic Complex (IVC) at the northern part around Kendengcaldera.1 In the beginning, caldera was formed because of a volcanic quartenary process and Old Ijen eruption was followed by forming of Blawan ancient lake. Blawan ancient lake has the width of 5 kilometers. The presence of Pedatigraben became way out to outside IVC caldera for ancient lake’s fluid. Now, Blawan ancient lake’s trace can be found as clastic sediments in steep hills and northern part of caldera. Some sediment eroded by river streamline because of a geological fault.2
The topography of inside caldera IVCis dominated by volcanic cones. One of volcanic conesis Mt. Blau3 which include on
this study area. In addition, Mt. Ringgih is another volcanic cone existing alongside east rim of Ijen Volcanic Complex (IVC).
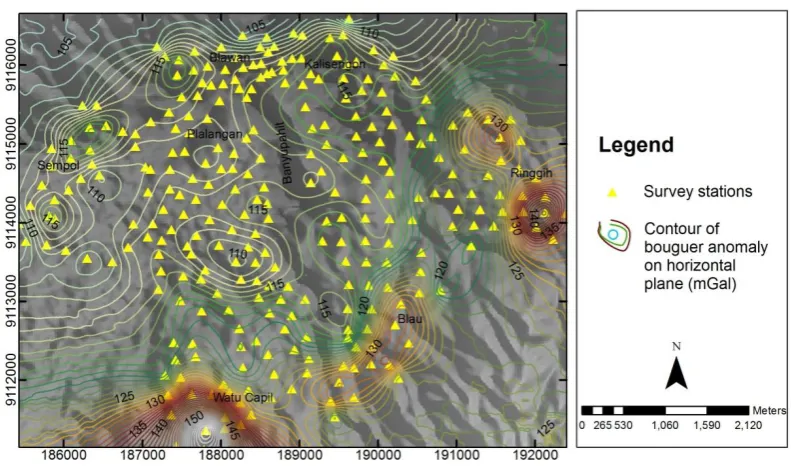
Figure 3. Measured stations in Bouguer anomaly on horizontal plane map Identification of subsurface structure on
promising areais important to understand the system. Gravity survey is one of all geophysics method which appropriate to explore subsurface structure. It is non-destructive method. The Difference of mass density is basic principle of this survey. Gravity method is a strong method to map the subsurface fault due to its sensitivity of vertical change.
Based on the previous study, gravity surveying on IVC has been done by Raehanayati.7 Space between station from the last study was 0.25 – 1.00 km. The stationwas only formed a straight line from Bondowoso to Blawan and Ijen crater. The previous study focused on identification of geothermal reservoir extensively.It did not determine fault which showed in geological map too.5 Further study,it is needed to determine fault at the geothermal area. The spacing between stations was made by the grid and denser on low Bouguer anomaly of the previous study. This was done for the purpose resolving the lack of previous study by showing any fault or new fault position and making the edge of reservoir clearer.
Methods
The instrument for thisstudy is Gravimeter
Lacoste-Romberg G-1053. The physical quantity which measured by gravimeter is earth’s gravitational acceleration.9 Gravity data was acquired on the focused area. Total of the stations is 288 points with 150-250 meters spacing (Figure 3). Data was acquired and processed from February to October 2015.
Measured data was processed to obtain Bouguer anomaly maps and subsurface model by the following step
a. gravity data reduction (tidal correction, drift correction, latitude correction, free air correction, terrain correction, and Bouguer correction) until get Bouguer anomaly on topography by equation.10
∆𝑔𝐵𝐴 =𝑔𝑜𝑏𝑠 − 𝑔𝜑+𝑓𝑎𝑐+𝑏𝑐+𝑡𝑐
where ∆𝑔𝐵𝐴 is Bouguer anomaly on topography (mGal), 𝑔𝑜𝑏𝑠 is the measured gravitational acceleration which corrected by tidal and drifts (mGal),𝑔𝜑is normal gravitational acceleration at station (mGal), 𝑓𝑎𝑐is free air correction (mGal),
𝑏𝑐is Bouguer correction (mGal), and𝑡𝑐is terrain correction (mGal)
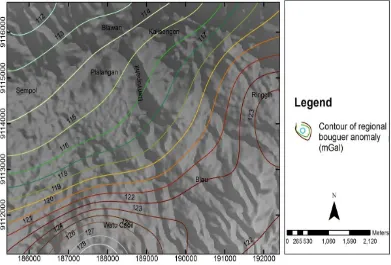
Figure 4. Regional Bouguer anomaly map on Blawan-Ijen study area horizontal plane to Bouguer anomaly
regional and Bouguer anomaly residual by upward continuation
d. qualitative interpretation by describing the meaning all Bouguer anomaly map and quantitative interpretation by making model based on the geological map and four cross sections on Bouguer anomaly residual map in Grav2dc software.
Result and Discussion
The result of processing data is Bouguer anomaly maps (on the horizontal plane, regional, and residual) and subsurface model inthe study area. The subsurface models have fitting error under 10%.
Based on Bouguer anomaly in Figure 3, Bouguer anomalies on the horizontal plane are shown by colored contours. Low Bouguer anomalies (104 – 106 mGal) are pointed out by blue and light yellow contour. Blawan, Plalangan, and the northern part of IVC are covered by low Bouguer anomaly with closure at Plalangan and Blawan. Medium Bouguer anomalies (116 – 133 mGal) are shown by green contours. Sempol and the northern part of Blau are covered by its
closures. High Bouguer anomalies (133 – 160 mGal) encompass Watu Capil, the southern part of Blau, and around Mt. Ringgih. High Bouguer anomalies are shown by maroon, grey, and white contours.
Regional Bouguer anomaly (Figure 4) isthe result of upward continuation on Bouguer anomalies overthe horizontal plane. The level of upward continuation is 900 meters. Low – high (112 – 130 mGal) trend of anomaly spreads from northwest to the southwest from the study area. It indicates that basement rocks turn to be shallower adjusting the trend.
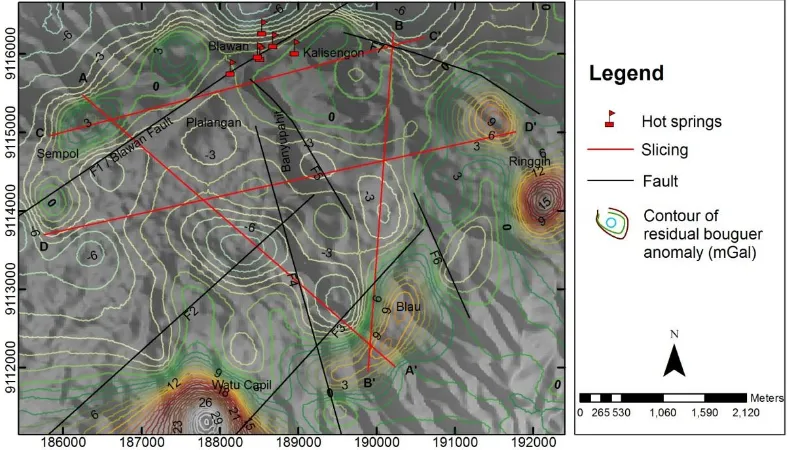
Residual Bouguer anomaly (Figure 5) describes subsurface structure and faults qualitatively. Positive anomaly is coloured by green, orange, maroon, grey, and white contours. Whereas negative anomaly is illustrated by light yellow and light blue. Positive and negative anomalies formed lineament patterns with denser contours. In this sense, it can be interpreted as faults. The negative closures indicate low mass density beneath the surface. On the other side, the positive closures indicate high mass density beneath the surface.
Figure 5.Prospecting new faults based on residual Bouguer anomaly pattern in Blawan-Ijenarea with four cross sections
study area. Three faults spread over northeast–southwest direction which is shown on geological map5 and the four prospecting faults spread over north-south direction. Blawan fault (F1) is located to northeast – southwest direction having positive – negative lineament of dense contour on the northern part of the study area. In addition, at the northern part lineament of Blawan fault, it is found positive Bouguer anomaly and higher topography at the opposite side. On the contrary, at the southern part, it is found negative Bouguer anomaly and lower topography.
According to contour patterns of residual Bouguer anomalies, topography, and subsurface models (Figure 6), the relative movement of the faults can be estimated. Blawan fault, with F1 label, is a normal fault. The Blawan faultoccurs from suface to predicted reservoir at 1400 meters beneath the surface (Figure 6.a). We assume Blawan fault reaches reservoir because it is the main fault which controls geothermal manifestation moving from reservoir to surface.
The relative movement of F2, F3, and F6 are same as Blawan fault’s relative
movement. Another case, F7’s relative movement is reversed. The Fault F7 is followed by the positive Bouguer anomaly associated with lower topography and the negative Bouguer anomaly associated with higher topography (Figure 6).
The direction of F4 and F5 movement is the oblique fault, the combination of normal fault, and strike-slip fault. It is characterized by some closures of residual Bouguer anomaly adjacent to same value move away. This closures look separated each other as shown in Figure 5. In addition, F4 and F5 have a possibility to form a graben. Next, this possibility needs to be explored further using GPS geodetic to obtain its proof.
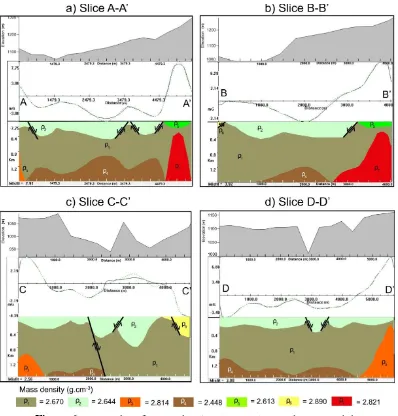
Figure 6. Four subsurface models in Blawan-Ijen study area and the elevation ata) A-A’ cross section, b) B-B’ cross section, c) C-C’ cross
section, d) D-D’ cross section
orange color, ρ3, is 2.814 g/cm3. These
intrusions break through bedrock to 1050 meters deep beneath surface. It is located near northern part of Kendeng caldera which is the weak zone to the north (Figure 6a and Figure 6c), and near the eastern part of Mt. Ringgih (Figure 6d). While the mass density of ρ7 (Figure 6a and Figure 6b), intrusions
showed by maroon color, is 2.821 g/cm3. It is located under Watu Capil area and has great possibility come from widen out of basaltic magma inside Mt. Blau.
The lowest of negative Bouguer anomaly is located beneath Plalangan. It reaches -8 mGal and associated with the geothermal
reservoir. Geothermal reservoir usually was characterized by closure of lowest residual anomaly and low mass density.7,12 Based on Figure 6, lowest mass density is shown by brown color (ρ4) which has2.448 g/cm3. It is
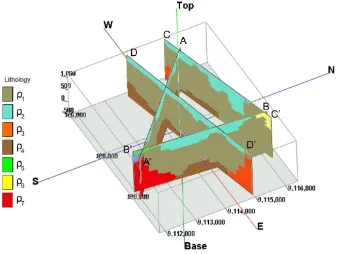
Figure 7. Fence of subsurface models in Blawan-Ijen study area viewed from top-east
dominated by andesite and basalt fragments, came from air fall pyroclastic deposits of IVC. It covered most of the northern side of IVC. Its mass density is 2.670 g/cm3 and shown by ρ1 with khaki color (Figure 6).
Models in Figure 6 show that the surface of the study area are covered by Blawan lake sediments (light green color), Mt. Blau’s pyroclastic air fall deposits (green color), and lava from Mt. Ringgih (yellow color). Blawan lake sediments were formed from embedded shale and sand which has mass density ρ2=2.644 g/cm3. Its thickness is
around 200 meters to 750 meters from surface. It gets thicker until 400 meters at Banyupahit River (Figure 6c) but the thickest part is exactly in debris flow area at Kalisengon. In common, the Blawan lake sediments get thicker from all side to north side at Blawan and Kalisengon (Figure 7).
Pyroclastic air fall deposit from Mt. Blau, ρ5, is 2.613 g/cm3. Its thickness is not more
200 meters. Lava flow from Mt. Ringgih on the surface is shown by yellow color and ρ6
(Figure 6 and Figure 7). Its mass density is 2.890 g/cm3. This lava flow got thicker to the
east.
Magma activity, causing intrusions, from Mt. Blau, Mt. Ringgih, and around Blawan fault became heat source of the geothermal system. These intrusions can be primary or secondary heat source.The intrusion around Mt. Blau is older than intrusion from Mt. Ringgih. As we know that Mt. Blau is the oldest vent inside IVC which occurs 50,000 years ago3 and cooling down so it has higher mass density than the other intrusions.
Meanwhile, the recharge zone is located on around Mt. Blau and Banyupahit River. Its trait is shown by some lineaments of structure which become strip for meteoric water. Meteoric water such as raindrop moves from the higher elevation at south to lower elevation at the north by gravitational force through the cracks. The cracks or faults at recharge zone possibly are Banyu pahit graben (F4 & F5), F2, F3, F6, and F7. No one of them is associated with hot springs. It indicates they do not control geothermal manifestation at the study area.
The fluid from recharge zone enters reservoir beneath Plalangan. If we see negative closures around Plalangan (Figure 5) and subsurface models (Figure 6 and Figure 7) further, the reservoir is believed continue to Wurung crater at southwest from Plalangan but Utama said that geothermal prospect in IVC splits up into two systems.13 The systems are Blawan geothermal system, and system covering Wurung crater and Mt. Djampit at southwest outside study area. For further research, on predicted continuing area need to investigate to locate the border of the reservoir or between two reservoirs. It can get us better understanding about whole geothermal system inside IVC.
Conclusion
Gravity survey with denser and gridding stations is well to locate any fault at Blawan-Ijen geothermal area. Most of the faults are north – south direction and main fault controlling hot springs is Blawan fault which characterized by dense lineament of positive – negative Bouguer anomalies and hot springs line. This fault became a way out for hot springs at Blawan. Moreover, subsurface models show predicted geothermal reservoir with lowest mass density (2.448 g/cm3) beneath Plalangan, Blawan, and Banyupahit River.
For next study, we suggest assure the relative movement of all new faults or predicted graben and investigate border of reservoir at southwest area of IVC.
Acknowledgment
We thank to gravity survey team, all members of BRAVOENERGEOBHAS UB research group, Hibah Penelitian Unggulan Perguruan Tinggi 2015, and NSF – USAID 2015 PGA 2000005053.
References
1. Hinsberg V, Berlo K, Bergen M, Jones AW. Extreme Alteration by Hyperacidic Brines at Kawah Ijen Volcano, East Java, Indonesia: Textural and Meniralogical Imprint. Journal of Volcanology and Geothermal Researrch [Internet]. 2010 Dec[cited 2014 Dec Jurnal Lingkungan dan Bencana Geologi [Internet]. 2012 Aug [cited 2014 Dec Excursion Guidebook IAVCEI General Assembly, 2000.
4. Sidarto, Suwarti T, Sudana D. Peta Geologi Lembar Banyuwangi, Jawa, Scale 1:100.000. Bandung: Pusat Penelitian dan Pengembangan Geologi; 1993.
5. Sujanto, SyarifuddinMZ, Sitorus K. Geological Map of The Ijen Caldera Complex, East Java. Scale 1:50.000. Bandung: Direktorat Vulkanologi Indonesia; 1988.
12];6(1):1-10.Available from:http://ejournal.uin-malang.ac.id/index.php/NEUTRINO/arti cle/viewFile/2441/4429doi:10.18860/ne u.v0i0.2441.
7. Raehanayati, Maryanto S, Rachmansyah A. Studi Potensi Geotermal Blawan-Ijen, Jawa Timur Berdasarkan Metode Gravity. Journal Neutrino [Internet]. 2013 Oct [cited 2014 Dec 12];6(1):31-39. Available from:http://ejournal.uin-malang.ac.id/index.php/NEUTRINO/arti cle/viewFile/2444/4434doi:10.18860/ne u.v0i0.2444.
8. Suciningtyas IK, Maryanto S, Rachmansyah A. Sebaran Mata Air Panas Blawan-Ijen Berdasarkan Data Geolistrik Resistivitas. Natural B. 2013 Oct;2(2):164-171.
9. Telford WM, Geldart LP, Sheriff RE. Applied Geophysics Second Edition. Cambridge: Cambridge University Press;1990.
10. Arafin S.Relative Bouguer Anomaly. The Leading Edge. 2004 Sep;23(9):850-851.
11. Setyawan A. Kajian Metode Sumber Ekivalen Titik Massa Pada Proses Pengangkatan Data Gravitasi Ke Bidang Datar. Berkala Fisika [Internet]. 2005 Jan [cited 2014 Dec 25];8(1):7-10. Available
from:http://eprints.undip.ac.id/1654/1/K ajian_Metode_Sumber_Ekivalen_Titik_ Massa_pada_Proses_Pengangkatan_Dat a_Gravitasi_ke_Bidang_Datar.pdf. 12. Riani E, Maryanto S, Rachmansyah A.
Subsurface Geological Survey Based on Gravity Method in Ijen Volcano, East Java. Physics Student Journal UB [Internet]. 2013 [cited 2014 Dec 12];l(1):64-66. Available from:http://physics.studentjournal.ub.ac.i d/index.php/psj/article/viewFile/16/19. 13. Utama AP, Dwinanto A, Situmorang J,