1
Al Baraka Banking Group (ABG) and Bank Muamalat Indonesia (BMI) An Annual Report Analysis (2010-2014)
Conducted by
Name Student Id
Student 1 111111
Student 2 222222
Student 3 333333
Financial Performance 1. CAMEL Analysis
CAMEL framework is widely used as a tool to evaluate bank performance as it
consists of important parameters which represent results of banking performance
from different factors (Dincer et.al. 2011 and Sarker 2006). Summary of CAMEL
ratio in both banks can be seen in Appendix 2. ▪ Capital
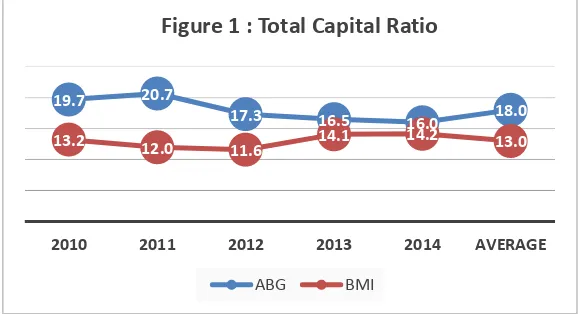
Capital adequacy ratio (CAR) is essential to measure the potential of bank’s capital to protect the depositors from the potential losses or (Sarker 2006).
During 2010 to 2014, both ABG and BMI’s CAR have exceeded the
requirement from the Central Bank. Central Bank of Bahrain set a minimum
CAR of not less than 12%, while Central Bank of Indonesia, based on Bank
Indonesia regulation No. 10/15/PBI/2008 requires banks to maintain its CAR
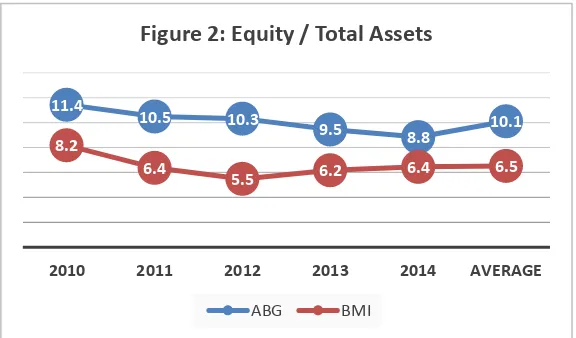
at a minimum 8%. In the term of Equity to Asset ratio, ABG has higher
average (10.1%) than BMI (6.5%), which implies that ABG has better
solvency than BMI. However, figure 1 and 2 shows that ABG has downward
trend both in CAR and Equity to Asset ratio, while BMI shows the upward
trend during the analysis period
19.7 20.7
17.3 16.5 16.0 18.0 13.2 12.0
11.6 14.1 14.2 13.0
2010 2011 2012 2013 2014 AVERAGE
Figure 1 : Total Capital Ratio
2
▪ Asset Quality
Asset quality rating represents the potency of credit risk associated with a certain asset which also implies the management’s ability to control its credit risk (FDIC 1997). This rating is measured by using loan loss reserve to gross loans ratio which depicts banks’ loss estimation due to default per total loan. The higher the ratio, the more vulnerable the bank (Sarker 2006). Loan loss
provision to net interest revenue which measures the loss expense in each
year and impaired loss per gross loan are also used to assess this rating.
According to figure 3, 4 and 5, there is a significant increase in BMI, in the
three ratio in 2013 due to a significant decrease in the collectability of the
loan. This is mainly derived by NPF (non-performing financing) from its major
debtor which were subject to bankruptcy (Voa-islam 2015). In 2014, both
banks have the only slight difference in their ratio (figure 3 and 4), except for
the impaired loans / gross loans which are higher in BMI for it has written off
most of its NPF.
13.2
9.8
24.3
14.7
4.4
13.3 10.9 10.7
5.3
31.6
3.8
12.5
2010 2011 2012 2013 2014 AVERAGE
Figure 4: Loan Loss Prov / Net Int Rev
ABG BMI
11.4
10.5 10.3
9.5 8.8 10.1 8.2
6.4
5.5 6.2 6.4 6.5
2010 2011 2012 2013 2014 AVERAGE
Figure 2: Equity / Total Assets
3
▪ Management Quality
Despite its qualitative nature, management quality can be quantified by using
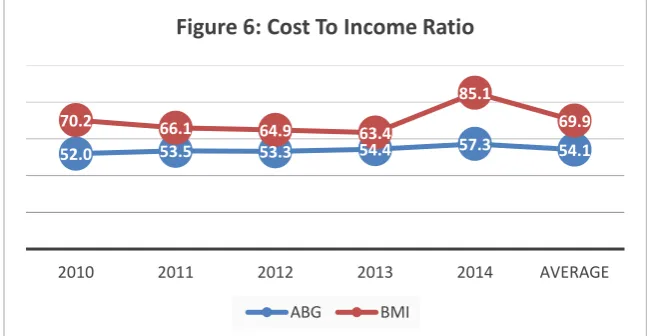
certain ratio, such as total cost to total income (Sarker 2006). This ratio
represents how efficient management in running the operation of the bank;
therefore, the lower the ratio, the more efficient the bank is. Figure 6
highlights that ABG has quite a stable cost to income ratio with average
54.1%, which is lower compared to BMI whose average ratio is 69.9%. Accordingly, ABG’s management is considered to be more efficient than BMI.
3.4 3.5 3.4 3.2
2.8 3.3 1.9 1.9
1.4
4.3
3.0
2.5
2010 2011 2012 2013 2014 AVERAGE
Figure 3: Loan Loss Res / Gross Loans
ABG BMI
4.9 4.9 4.4
3.8 3.4 4.3
3.6
2.5 2.1
4.7
6.5
3.9
2010 2011 2012 2013 2014 AVERAGE
Figure 5: Impaired Loans / Gross Loans
ABG BMI
52.0 53.5 53.3 54.4 57.3 54.1
70.2 66.1
64.9 63.4
85.1
69.9
2010 2011 2012 2013 2014 AVERAGE
Figure 6: Cost To Income Ratio
4
Based on EY report (2016), Islamic banks (IB) in Bahrain in average has cost
to income ratio by 65% in 2014. This means that ABG’s efficiency is better
than its average competitor. Whereas in Indonesia, in average, IB has scored
73%, which means that BMI is less efficient than its competitor.
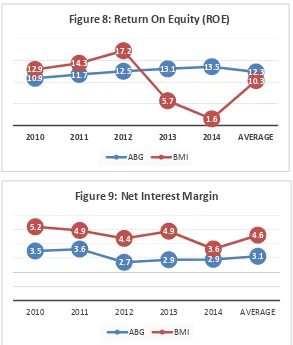
▪ Earnings
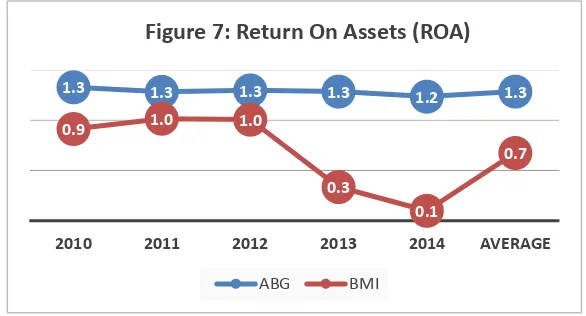
Earnings’ quality are evaluated through bank’s ability to absorb losses by providing an adequate capital base (Sundarajan and Errico, 2002). The most
widely used ratio to measure earnings and profitability are return on assets
(ROA), return on equity (ROE) and net interest margin (NIM) (Sarker 2006).
Figure 7, 8 and 9 shows that ABG has higher average ROA and ROE, while
the NIM is lower than BMI. ABG has quite stable ROA, ROE, and NIM with
the upward trend during 2010-2014. In 2014, average ROA and ROE for IB in Bahrain is only 1.2% and 9%, respectively (EY 2016). This means that ABG’s performance is better than its competitor. Meanwhile, BMI experiencing
downward trend for its profitability, especially since 2013. EY (2016) reported
that the average IB in Indonesia has ROA and ROE by 1% and 13%,
respectively. Therefore, BMI’s profitability is lower than its competitor. The rationale behind this trend is the deceleration of Indonesia’s economic growth and the prolonged decrease in commodity prices lead to the less conducive
condition to the development of the real sector (BI Report 2013).
1.3 1.3 1.3 1.3 1.2 1.3
0.9 1.0 1.0
0.3
0.1
0.7
2010 2011 2012 2013 2014 AVERAGE
Figure 7: Return On Assets (ROA)
5
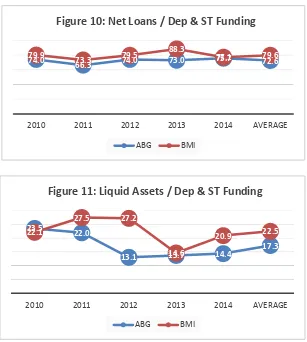
▪ Liquidity
Liquidity represents the bank’s ability to fulfill its financial obligations (Altan, et. al. 2014). According to Sarker (2006), an adequate liquidity position can be
achieved when the bank has enough deposits or assets to meet its liquidity
needs or how quick its assets to be converted to cash. Accordingly, bank’s
liquidity is measured by using net loans to deposit ratio and a liquid asset to
deposit and short-term funding ratio. During analysis period, ABG shows
lower average net loans to deposit ratio compared to BMI; however, the
average percentage of liquid asset per total deposit of BMI is higher than
ABG. This implies that BMI has better liquidity position than ABG.
3.5 3.6
2.7 2.9 2.9 3.1
5.2 4.9
4.4 4.9
3.6
4.6
2010 2011 2012 2013 2014 AVERAGE
Figure 9: Net Interest Margin
ABG BMI
10.9 11.7 12.5
13.1 13.5 12.3 12.9 14.3
17.2
5.7
1.6
10.3
2010 2011 2012 2013 2014 AVERAGE
Figure 8: Return On Equity (ROE)
6 23.5 22.0
13.1 13.7 14.4
17.3 22.1
27.5 27.2
14.6
20.9 22.5
2010 2011 2012 2013 2014 AVERAGE
Figure 11: Liquid Assets / Dep & ST Funding
ABG BMI
2. Financial Impact on Significant Changes in the Organization
▪ ABG
On July 2012, ABG acquired 58.32% of the voting shares of Itqan Capital, an
unlisted company in Saudi Arabia, through its subsidiary, AlBaraka Islamic
Bank. This acquisition increases the bank’s goodwill by US$ 17,082 thousand,
where the total purchase consideration transferred is US$ 27,676 thousand
(ABG Annual Report 2013).
▪ BMI
On June 2014, there is a major replacement of the Board member following
the downward trend of profitability of the bank since 2013. The new executive
director has committed to solving the NPF problem by written off all the
financing with high default possibility. This conduct is reflected in figure 5
which depicts the increase of non-performing loan per total gross loan.
74.0
66.3 74.0 73.0 75.7 72.6
79.9
73.3 79.5
88.3
77.1 79.6
2010 2011 2012 2013 2014 AVERAGE
Figure 10: Net Loans / Dep & ST Funding
7
Non-Financial Performance
1. Quality of Corporate Governance
A good corporate governance plays an important role in business activities.
Chapra (2002) argues that Islamic banks cannot be developed and expanded
without an effective corporate governance (CG), as the problem in the
organization is getting more complex, the need of an effective CG is also
increased. CG performance of the banks is evaluated by using the AAOIFI
governance standard No.6 whose result is presented in appendix 3. The result
shows that ABG scored 89% in average during 2010-2014, higher than BMI
which only scored 86%. The explanation of CG component is elaborated in the
following section.
A. Ownership Structure
The Ownership structure of the banks could reflect its agency problem.
According to Jensen and Meckling (1976), agency problem arises from the
separation between ownership and control (vertically) and from the majority
versus minority ownership (horizontally). The agency theory suggests that the
publicly owned company has higher agency cost than a privately owned
company; hence, a public company is required to present more transparent
disclosure to its shareholders (Gogineni 2013). Accordingly, given the
ownership structure of the banks (Table 1), ABG is expected to have higher
agency cost than BMI. With regards to horizontal agency problem, some
studies show that high concentrated ownership could lead to the extraction of the firm’s resources by the majority owners at the expense of other shareholders (Gogineni 2013). Table 1 shows that ABG’s highest shareholder
is an individual, Sheikh Saleh Abdullah, who is the chairman and founder of
Dallah Albaraka Group and the chairman of ABG as well. Since he owns the
shares in the Dallah Albaraka Group as well, indirectly he owns more than
50% shares of the bank. This lead to a higher agency cost for the bank. In
the case of BMI, major shareholder is Islamic Development Bank which is
classified as government. According to Taktak (2012), research related to the
government ownership shows a mixed result, but mostly show the negative
8
B. Board of Director
Related to the Board structure, both ABG and BMI have complied with the
OECD standard which requires the separation of management and control
function. However, ABG has not complied with the independence requirement
as its chairman hold significant share ownership in the bank. For the diversity
of board member, both banks have a quite good diversity in the term of age,
nationality, education and experience. However, there is still a lack of gender
diversity as most of the member of the board are male. Related to the
diversity and performance, Sicilano (1996) stated that the wider the diversity
in board member characteristics, the better performance of the organization
as it will give wider insight and perspectives. Further detail of the board
structure is presented in appendix 4.
C. Sharia Supervisory Board (SSB)
Unlike the BoD structure, the SSB composition of both banks are lack of age
and gender diversity, and for BMI, it is also in education and experience. In
addition, the members of SSB have been sitting in their position for more than
9
the SSB’s chairman currently sitting on 95 boards, which prone to jeopardize the active involvement and their independence (Hamza 2013). Further detail
of the SSB structure is presented in appendix 5.
D. Auditors
One way to ensure that the bank protects the depositor’s right is by using the
external auditor function to ensure that the bank provides a reliable and
transparent report to all stakeholders (Chapra and Ahmed 2002). Therefore,
it is important for the bank to choose a reliable audit firm as research by
Eshleman and Guo (2014) shows that big 4 audit firm perform higher quality
audits compare to mid-tier auditors. In this case, both ABG and BMI have
been appointed EY, one of the big 4 audit firm, as their auditor. During the
analysis period, both banks got an unqualified opinion, which means that their
financial reports are presented fairly and free from material misstatement. The
detail of audit and non-audit services are summarized in appendix 6.
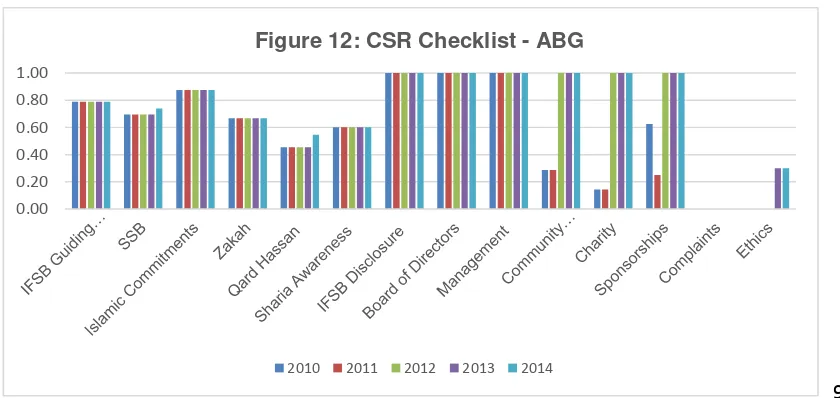
2. Corporate Social Responsibility
Assessment of CSR disclosure is conducted by using Belal, et.al. (2014)
checklist which comprises of 11 categories. Those categories represent universal
(governance issues) and sharia-related issues disclosure which are derived from
several established standards such as IFSB and AAOIFI standard. Based on the
content analysis approach, ABG and BMI in average have fulfilled 67% and 69%
of the checklist, respectively. Figure 12 and 13 shows that the highest score is
reached by IFSB disclosure, BoD and management, while the lowest score, 0%,
goes to complaints and ethics category (detail is presented in appendix 7).
0.00 0.20 0.40 0.60 0.80 1.00
Figure 12: CSR Checklist - ABG
10
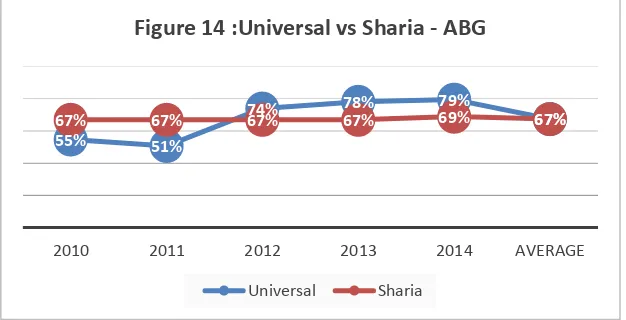
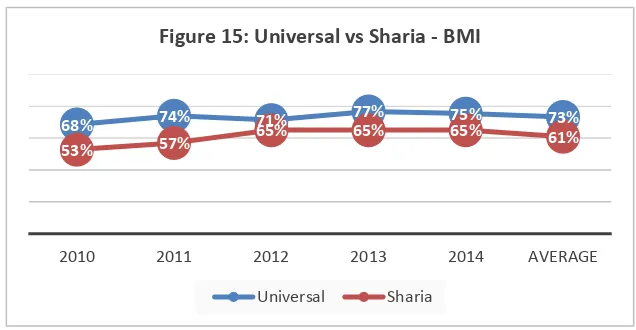
Related to universal and sharia category, ABG shows (figure 14) the upward
trend for its universal disclosure, while the sharia disclosure is quite stable with
average 67%. In contrast, BMI has shown an increase in its sharia disclosure yet
the score is below ABG. In overall, both banks have a higher universal
disclosure than sharia disclosure. This result, therefore, does not satisfy the
public expectation, which expects the sharia bank to be more “Islamic and Ethical” to legitimate its existence to the Muslims community which relates to legitimacy theory (Newson and Deegan 2002). According to the theory, CSR is a
response to the environmental expectation including social, political, and
economic forces (Dusuki 2008).
0 0.2 0.4 0.6 0.8 1
Figure 13: CSR Checklist - BMI
2010 2011 2012 2013 2014
55% 51%
74% 78% 79%
67%
67% 67% 67% 67% 69% 67%
2010 2011 2012 2013 2014 AVERAGE
Figure 14 :Universal vs Sharia - ABG
11
3. Reporting in Islamic Sections
Report of zakah, qardh hassan, and charity fund have been assessed through
the Belal et.al. checklist (appendix 7). Each year, ABG discloses the calculation
of zakah per share as it considers that the obligation to pay zakah is borne by the
shareholders and IAH, not the bank. The calculation is subject to the assessment
by SSB. Unlike ABG, BMI pays zakah from the bank and from other parties.
Zakah fund will be distributed by its representative institution, Baitul Maal
Muamalat, which also distribute infaq and sadaqah. In the case of qardh hasan
financing, only BMI who disclose the source of funds. Furthermore, for the charity
fund, both banks have been disclosed the description, source and balance of
which in their annual reports quite consistently.
4. Quality of Narrative Reporting A. Diction
Impression management practice is recognized when the company tries to use
certain language to cover the negative performance (Cho et. al. 2010). ABG’s
quite stable economic performance is reflected in its chairman statement which
shows the same trend related to optimism and certainty expression (figure 16).
In contrast, figure 17 indicate impression management practice by BMI,
whereby the optimism increase as the profitability decrease (2013). However,
in 2014, as the profit keep declining, the optimism rate is also declining while
the certainty rate increase.
68% 74% 71% 77% 75% 73%
53% 57%
65% 65% 65% 61%
2010 2011 2012 2013 2014 AVERAGE
Figure 15: Universal vs Sharia - BMI
12
B. LIWC
Linguistic Inquiry and Word Count (LIWC) is a text analysis application which
provides the method to evaluate various emotional, cognitive and structural
components in the written or speech samples (Pennebaker et. al. 2007).
Figure 18 shows that ABG has an upward trend for its positive emotion in its
chairman statement along with the decline in the negative emotion, which is in
line with the increase in bank profitability. This implies that ABG uses the
chairman statement in accordance with the overall content of the annual
report. Furthermore, the result of BMI in Figure 19 indicates that the bank did
the impression management in 2013 when the positive emotion increase
though the profitability decrease. In 2014, the chairman’s statement quite show
the real condition of the bank which is indicated by a decrease in the positive
emotion along with the increase in negative expression to explain the declining growth in Indonesia which affected the bank’s profitability.
57.81 57.42 58.82
64.88
59.3 51.47 48.99
46.17 45.4 50.04
0.913 1.016 1.007 0.335 0.099 12.912 14.337 17.21 5.714 1.557 0 5 10 15 20 0 10 20 30 40 50 60 70
2010 2011 2012 2013 2014 Figure 17 : BMI - Diction Result
Optimism Certainty ROA ROE 51.88 54.33 50.81 53.81 52.91
49.99
44.41 46.96 48.47
49.89
1.33 1.285 1.299 1.288 1.237 10.874 11.743
12.488 13.05 13.544
0 2 4 6 8 10 12 14 16 0 10 20 30 40 50 60
2010 2011 2012 2013 2014 Figure 16: ABG - Diction Result
13
Related to the length of the statement, the more complex and longer the
narrative indicating the effort of the company to cover its negative performance
and can be considered as retrospective sense-making (Merkl-Davies 2011). This theory is reflected in both banks’ chairman statement. Figure 20 shows that the word count of the ABG’s statement decreases along with the increase of the profitability. BMI also shows the same pattern, where the word count
increase along with the decrease in the profitability (Figure 21).
1.87
2.29 2.42
2.86
3.38
0.53 0.76 0.63 0.43
0.14
1.33 1.285 1.299 1.288 1.237
10.874 11.743
12.488 13.05 13.544
0 5 10 15 0 1 2 3 4
2010 2011 2012 2013 2014
Figure 18: ABG - Positive & Negative Emotion
Positive Emotion Negative emotion ROA ROE
2.75
3.43
2.83
3.18
2.64
0.2 0.33 0.19 0.19
0.58
0.913 1.016 1.007 0.335
0.099 12.912 14.337 17.21 5.714 1.557 0 5 10 15 20 0 0.5 1 1.5 2 2.5 3 3.5 4
2010 2011 2012 2013 2014
Figure 19: BMI - Positive & Negative Emotion
14
5. Financing Composition
In the term of financing, Islamic banks (IB) are encouraged to have more
equity-based financing instead of debt-equity-based financing, as the main principle of the
Islamic finance is based on the profit-loss sharing system (Asutay 2012). However, recently the critics to IB’s financing practice increased due to IB has been involved in more debt-financing (such as murabahah) rather than promoting
the equity-based financing (Mudharabah and Musharakah). Figure 22 illustrates that ABG’s financing composition is dominated by debt-equity financing (murabahah). In contrast, BMI shows quite a balance in composition between
debt and equity-based financing.
510
903
1,061 1,069 1,211
0.913 1.016 1.007 0.335 0.099
12.912 14.337
17.21
5.714
1.557 0 500 1,000 1,500
0 5 10 15 20
2010 2011 2012 2013 2014
F I G U R E 2 1 : B M I - W O R D C O U N T
Word Count ROA ROE
2,084
1,570
1,115 1,154
711
1.33 1.285 1.299 1.288 1.237
10.874 11.743
12.488 13.05 13.544
0 500 1,000 1,500 2,000 2,500
0 5 10 15
2010 2011 2012 2013 2014
F I G U R E 2 0 : A B G - W O R D C O U N T
15
Conclusion
In overall, in the term of financial performance, ABG has shown the better performance
than BMI, except for the asset quality and liquidity. From non-financial aspect, ABG
performs better related to its CG and CSR disclosure which is evaluated based on
AAOIFI standard and Belal et.al. Checklist. However, in the term of financing
composition, BMI has better performance as it shows quite balance composition
between equity and debt financing.
82.5% 6.7%
0.1% 9.8%0.7% 0.2%
Figure 22 : Financing Composition - ABG
Murabaha Ijara
Istisnaa Mudaraba
Musharaka Other Islamic Banking Products
46.1%
1.2%
0.2% 6.3%
40.9% 5.4%
Figure 23 : Financing Composition - BMI
Murabaha Ijara
Istisnaa Mudaraba