IJEO 45 E-ISSN : 2548-8295
Design Of Web Based Monitoring System For Essential
Plantation
Candra Dewi *1, Gusti Ngurah Wisnu Paramartha2, Rakhmadina Noviyanti3, Enny
Trisnawati4
1,2,3,4Informatics Department, Faculty of Computer Science, University of Brawijaya e-mail: *1[email protected], 2[email protected], 3[email protected],
Abstrak
Kebutuhan minyak atsiri dunia yang cukup tinggi dan keterbatasan budidaya tanaman atsiri di Indonesia, menuntut adanya pengelolaan produk atsiri yang terencana. Untuk meningkatkan produksi agroforestry khususnya atsiri baik dari segi kuantitas, kualitas maupun kontinuitas penyediaannya, diperlukan pasokan bahan baku yang salah satunya berasal dari tanaman atsiri. Ketersediaan data dan informasi mengenai tanaman atsiri yang aktual dan akurat dalam skala tertentu dan tersedia secara berkala sangat diperlukan, agar perencanaannya dapat dilaksanakan secara efektif dan efisien. Untuk itu sangat diperlukan sebuah sistem yang dapat digunakan mengelola dan memonitor ketersediaan informasi mengenai tanaman atsiri. Pada paper ini diperkenalkan desain sistem untuk memonitor tanaman atsiri di Jawa Timur khususnya dan Indonesia umumnya. Sistem dikembangkan berbasis web dan dilengkapi dengan database yang dapat digunakan untuk menyimpan data dan informasi mengenai tanaman atsiri. Desain meliputi identifikasi kebutuhan informasi yang dipelukan untuk disimpan dalam sistem, desain basis data, desain proses dan desain antarmuka. Dengan adanya database ini, data-data atsiri seperti sebaran, jenis tanaman, lokasi penanaman, pemilik, luasan dan lain sebagainya akan tersimpan dan dapat diakses oleh berbagai pihak dengan mudah dan cepat.
Kata kunci— sistem monitoring, tanaman atsiri, web
Abstract
The world needs of essential oil that is high and the limitations of plant cultivation in Indonesia, requires management planning of essential products. To increase the production of agroforestry especially essential both in terms of quantity, quality and continuity of provision, the necessary supply of raw materials, one of which comes from essential plant. The availability of actual and accurately data and information about the essential plants in a certain scale and are available on a regular basis is necessary. Therefore, the planning can be implemented effectively and efficiently. It is very necessary to develop a system that can be used to manage and monitor the availability of essential plant information. This paper presents the design of a system to monitor essential plant in East Java in particular and Indonesia in general. The system is developed as a web-based system with a database that can be used to store data and information about plant essential. Design includes identification of information needs to be stored in the system, database design, process design and interface design. With the existence of this database, essential data such as the distribution of plant species, planting location, owner, size, and so forth will be stored and can be accessed by various parties easily and quickly.
IJEO 46 E-ISSN : 2548-8295 1. INTRODUCTION
Indonesia is a tropical country that has a wide variety of flora that has many benefits and can be grown easily. Plants that have a high commercial value and easily cultivated is a essential plant such as lemongrass, fragrant roots, patchouli, clove, eucalyptus, and nutmeg (Marlon Tanasale, 2012).
Recently, about 200 types of essential oils commercialized in the world market and more than 80 species of them are produced continuously. There are approximately 20 kinds of Indonesian essential oils is known in the world market and about 15 of which have become an export commodity, namely citronella oil, patchouli, vetiver, cananga, ylang-ylang, eucalyptus, clove leaf, clove stem, sandalwood, nutmeg, massoi, kruing, aloes, mace, and turpentine; while potential of more than 40 types. Indonesia only as exporter, but also imported several kinds of essential oils which can be partially produced in Indonesia. In 2006, Indonesia imported essential oils amounted to 815.797 kg with a value of US $ 7.36 million (the Central Bureau of Statistics, 2006).
There are more than 150-200 essential plants produces essential oil. Indonesia has about 40-50 species of plants but only 15 species are in commercialized. Essential plant spread almost throughout the region in Indonesia, but the data have not been managed well. The spread of various essential plants in many areas can not be accessed easily and yet provides important information relating to the development of essential. Thus, we need a technology that can store data of essential crops. In this case, techniques such as precision agriculture is indispensable. This technique can integrate information technology systems and agricultural systems to realize efficiencies, productivity and profitability of agriculture (Day, 1991). Application of information technology has been very extensive use, such as for the management of watersheds (Jong et al, 1996), the economy (Dangolani, 2011), health (Pai and Huang, 2011; Lawler et al, 2011), and government (Lin et al., 2011 ). With the support of information and communication technology applications, precision agriculture techniques are expected to provide improvements to the monitoring functions of production, optimization of the quality of agro-industries essential, minimize adverse environmental effects and reduce the risk of failure in business in the field of essential agro-industry.
Documenting the results of the commodity in different area for each year also require the control to improve the quality (Muawwal, 2016). Such control would require a system that can provide location information and plantation crops
In Indonesia has developed a web-based system of planting calendar. According to research conducted by Fadhullah Ramadhani et. all (2013) from the Research Institute for Agro-climate and Hydrology, the system in addition to informing the time of planting, also include information regarding the recommendations of agricultural technology. Information of planting calendar provide the early predictions of planting time, the estimated of acreage, the potential of an area prone to flooding and drought, potential attack of plant pests (OPT), recommendation on varieties, as well as dosage recommendations and the need of fertilizer until at district level (Ramadani et al, 2013)
IJEO 47 E-ISSN : 2548-8295 information at a certain time and on a regular basis.
2. MATERIALS AND METHODS
Structured application development can be performed using the Waterfall method includes the steps of analysis, design, coding, testing, implementation and maintenance as can be seen in Figure 1. This research perform two initial stages of system development stage that are the stage of needs analysis and system design.
Figure 1. The steps of system development using Waterfall Model
At the stage of system requirements analysis is carried out literature studies, communications and interviews with parties associated with both the farming community of essential, the consumen or industry that use essential products, entrepreneurs and institutions. The process of user needs analysis conducted to determine the needs of user, system functional requirements, the need for hardware and software on the system to be built. Later in the design phase is to design the system based on the needs analysis has been done.
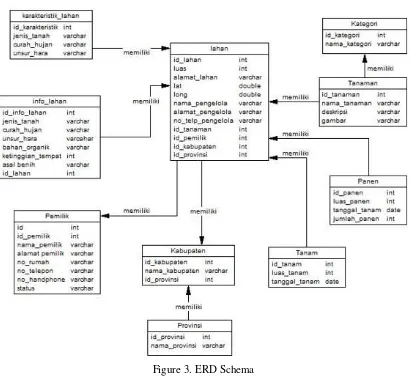
The results of the analysis process will be described in terms of database design and process design in general by using Entity Relationship Diagram (ERD) and the Use Case Diagram. ERD serves to determine the relationship between the data in a database based on the data base objects relationship as well as relationships between model data structures. While the Use Case diagram is used to describe the needs and functionality of the system and is used to show the actions performed by actors of the system.
The design phase of this activity is primarily to design user interface is equipped with navigation and functionality that support so that the website can be used to manage information and access the information required by the user.
3. RESULT
This study will be used as basis for the development of web-based monitoring system for essential plants.
3.1 Block Diagram
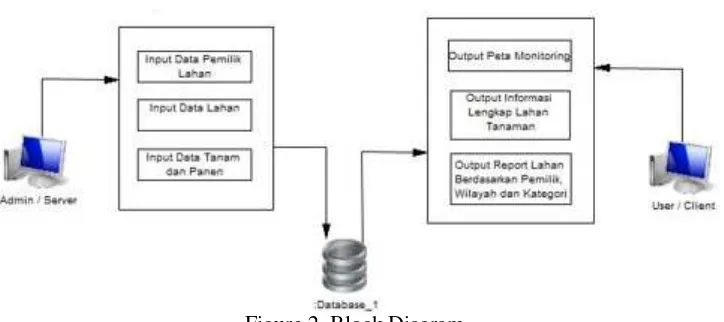
IJEO 48 E-ISSN : 2548-8295 Figure 2. Block Diagram
3.2 Actor
Actors interact with the system are shown in Table 1. There are two actors that play a role in the system and each actor has their own responsibility the the system.
Table 1. The description of actors that interact with the system
Actor Description
Guest
Guest is visitors of the Essential Plant Monitoring System. Guest can see all the
information available in the user interface that has been uploaded by admin but they can
not add, edit or delete the information to the system.
Admin Admin is an actor that controls all kinds of contents of the information system. Admin has the authority and responsibility to all the information contained in the information system.
3.3 Entity Relationship Diagram (ERD)
IJEO 49 E-ISSN : 2548-8295 Figure 3. ERD Schema
3.4 Use Case Diagram
The actions performed by the actors in the system in the form of Use Case diagram is shown in Figure 4. There are two actors who interact with the system, namely Admin as the system manager and general users. As a manager, Admin has the action to add the data in the database, edit the data, delete data that is not needed, and view information. The data is managed by Admin is all the data contained in the ERD scheme.
IJEO 51 E-ISSN : 2548-8295
3.5 Use Case Diagram
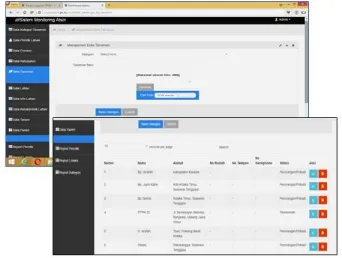
The main page of the system is designed to view the information about area and crops of essential. The user interface fitted by three main menu, namely Home, Monitoring and Report. The Log in menu is specially designed for Admin to open the system for managing data. The design of the main page display each menu of the system is shown in Figure 5.
Figure 5. User Interface design for the main page
IJEO 52 E-ISSN : 2548-8295 Figure 6. User interface design for Admin
4. CONCLUSION
This paper presents the design of the web based monitoring system for essential plant. The first step is conduct needs analysis through the study of literature, interviews and discussions. Analysis was done mainly to describe the needs of the database and the processes that occur in the form of ERD and Use Case. Then is continued by design process. The design mainly done for the system to run properly according analysis of system needs. This system is designed to be developed using Google technology, therefore it can be used to determine the distribution of essential plant and some information about the land. Such information includes crops, cultivation area, land characteristics, land owners, land managers, planting information, and harvesting.
REFERENCE
[1] Tanasale, Marlon. 2013. Aplikasi Perlakuan Bahan Baku dan Penyulingan Air – UAP Terhadap Rendemen dan Sifat Organnoleptik Minyak Atsiri. PPLH-SDA. Fakultas Pertanian Universitas Pattimura
IJEO 53 E-ISSN : 2548-8295 Mathematical and Control Applications in Agriculture and Horticulture. Matsuyama, Japan.
[4] Muawwal, Ahyar. 2016. Implementasi API GMAPS Untuk Estimasi dan Monitoring Hasil produksi Perkebunan Berbasis Mobile Recording.
[5] Jong J., J.T. van Buuren, and J.P.A. Luiten. 1996. Systematic approaches in water management: aquatic outlook and decision support systems combining monitoring, research, policy analysis and information technology. Water Science and Technology 34(12): 9-16.
[6] Dangolani, S. K. 2011. The Impact of information technology in banking system (A case study in Bank Keshavarzi IRAN). Procedia - Social and Behavioral Sciences 30:13-16. [7] Pai,F.Y. and K.I. Huang. 2011. Applying the technology acceptance model to the
introduction of healthcare information systems. Technological Forecasting and Social Change 78(4):650-660.
[8] Lawler, E.K., A. Hedge, and S. P.Veselinovic. 2011. Cognitive ergonomics, socio-technical systems, and the impact of healthcare information technologies. International Journal of Industrial Ergonomics 41(4):336-344.


