Journal of Business and Economics December 2009 Available online at:
Vol. 8 No. 2, p 131-138 [email protected]
ISSN: 1412-0070
Measuring the Efficiency of Indonesian Insurance Companies Using Data
Envelopment Analysis
Fanny Soewignyo*
Fakultas Ekonomi Universitas Klabat
The major aim of this research is to measure the relative efficiency of the six-selected Indonesia insurance companies listed in Indonesia Stock Exchange. Data envelopment analysis (DEA) method was used to measure the relative efficiency of the insurance companies using the input-oriented CCR model, with constant returns to scale (CRS) assumption, developed by Charnes, Cooper and Rhodes and the input-oriented BBC model with variable returns to scale (VRS) as spefified by Banker, Charnes and Cooper. The results indicate that several insurance companies are in need of improvements in various areas. DEA also points to the specific changes that must be made in the less productive insurance companies in order for them to catch up with their best practice peer group.
Key words: benchmarking, data analysis, DEA-CRS, DEA-VRS, efficiency measures, Indonesian insurance, technical efficiency
INTRODUCTION
The Indonesian insurance industry consists of large market participants but is still facing various problems in their growth especially the lack of understanding on the importance of insurance in their life. People are still focused on religious matters, mostly lacking in education, so that these lack of attention has slowed down the growth of the insurance business in Indonesia. As stated by the USAID, (June 2007), Indonesia’s insurance industry is very underdeveloped, resulting in less than 10% of Indonesians covered by insurance products, coverage that is desperately needed in a country prone to natural disasters and whose government is financially unable to provide protection. Reasons include a critical shortage of qualified employees who are educated in risk management and insurance and inadequate government regulations over the industry that need to be reformed.
Indonesia is a potential market for the insurance industry, although its growth is
*corresponding author: [email protected]
lagging behind those of other financial institutions such banks and multi finance institutions. The low penetration rate for insurance services has attracted many players from overseas to participate in Indonesia’s insurance industry. This is an indication that the Indonesia Insurance industry will continue to grow in the years ahead.
The insurance industry could develop if the situation could be changed by improving the services of the insurance companies and stepping up the promotion of their services. This industry has a chance to develop with the support of the government and related institutions. The understanding and measuring of productivity in the industry is important because productivity growth is a major source of over-all economic development and welfare improvement of both consumers and the producers. There is a need to evaluate the productivity and efficiency of Indonesia Insurance companies on how these firms are performing relative to their peers for inspection and improvement of performance.
financial statements publicly available at the Indonesia Stock Exchange. Specifically: To analyze the relative productivity and to determine the most efficient DMU (decision making unit) using Data Envelopment Analysis (DEA). To benchmark the efficient DMU against the non-efficient DMUs. To productivity in the long run. To the general public, this study is essential for giving insights about the status of the insurance industry. For the insurance companies, this study may assist them on how to compete effectively in the present business situation since they will know the strengths and weaknesses of their counterparts as these have performed in previous years. The findings of this study are deemed significant to fund managers in giving them inputs in identifying the areas where developments are needed to ensure the future of their plan holders and would be investors.
Scope and Limitation. The study inputs into outputs. It examined three inputs and one output.
Review of Related Literature. This study presents a review of efficiency studies conducted in the past in several industries around the world. A vast majority of methods for productivity and efficiency measures has employed DEA and other productivity and efficiency approaches. Charnes, et al. (1978) first described the DEA method to measure efficiency frontiers, based on mathematical programming model with assumed constant returns to scales (CRS), a model which had an input
orientation. Consequently, Banker, charnes and cooper (1984) proposed a variable returns to scale (VRS) model. Today, DEA is widely used by many scholars to measure efficiency in the profit sector. Berger & Humphrey (1997) document 130 studies on financial institutions including banks, bank branches, savings and loan institutions, credit unions and insurance companies.
The DEA idea consists in investigation of the complex object with set of inputs and outputs and in analysis of its activity in an environment of functioning. Efficiency here is defined as quotient form division of the sum of all outputs by the sum of all inputs. It defines the value of efficiency for each investigated object named decision-making unit (DMU), and then the comparison of supervision by the method of linear programming with using of various basic models and their variants is executed. DEA selects from the whole set the efficient DMUs by construction of efficiency frontier, and for others it defines a measure of their inefficiency. Criterion for revealing efficiency here is an achievement of Pareto efficiency. The detailed description of history, models and interpretations of DEA method is stated at Cooper, Seiford & Zhu (2004).
Vol. 8, 2009 Measuring the Efficiency of Indonesian Insurance 133 The DEA models differ by the
orientation of optimization, the form of production function, the type of scale effect and the other headings. According to Coelli et al. (2005) the choice orientation of model has insignificant influence as both variants estimate the same efficiency frontier and are defined with the same DMUs. The model orientation should be defined by the factors above those DMUs have greatest quantitative control.
Lo and Lu (2006) employed a two-stage DEA approach including profitability and marketability to explore the efficiency of financial holding companies (FHCs) in Taiwan. Factor-specific measures and BCC (Banker-Charnes-Cooper) model were combined together to identify the inputs/outputs that are most important and to distinguish those FHCs which can be treated as benchmarks. Results show that big-sized FHCs are generally more efficient than small-sized ones. The performance of the firm, even in technologically intensive industries, does not solely depend only on technological expertise. Competencies in areas such as marketing, general management, human resource management and dealing effectively with external stakeholders and government entities are crucial to competitive advantage (Prahalad & Hamel, 1990).
DATA SAMPLE AND METHODOLOGY
The data on input and output sourced out from the published annual financial reports of six samples that are publicly available from the website of Indonesia Stock Exchange. Using data envelopment analysis models, this study used three (3) inputs and 1 (one) output. In general, inputs used are (1) portion of authorized stock that the company has issued and received payment for. Underwriting expenses represent all the running expenses of the insurance company
relating to the operation. These input variables mentioned are the resources that have been utilized to produce a firm’s output.
Outputs represent those goods or services, which the clients of the companies are prepared to purchase, and the sale of these outputs generates revenue. The output used in this study is underwriting revenues that refer to the earnings of the business as a result of its operations. These represent those goods or services, which the clients of the companies are prepared to purchase, and the sale of these outputs generates revenue. The output used in this study is underwriting revenues that refer to the earnings of the business as a result of its operations.
These variables were employed in running the Data envelopment analysis (DEA). The inputs and output were used in the DEA model in identifying the company’s productivity and efficiency over the period of 2005-2006. All values have been converted into million rupiah. To be included in the data set used in this study, the insurance companies had to meet two conditions: first, that financial information is available in the Indonesia Stock Exchange for the period of 2005 to 2006; and, second, they do not have negative financial data. DEA requires that data set to be non-negative for the outputs and strictly positive for the inputs (Sarkis and Weinrach, 2001).
globally efficiently due to the scale size of the DMU. Thus, it is needed to characterize the scale efficiency of a DMU by the ratio of the two scores. The scale efficiency is defined by:
(1) The CCR score is called the (global) technical efficiency (TE), since it takes no account of scale effect. On the other hand, the BCC expresses the (local) pure technical efficiency (PTE) under variable returns-to-scale circumstances. (Cooper, Seiford & Tone, 2004). The slack-based measured of efficiency (SBM) deals with the input excesses and output shortfalls and uses the additive model to give a scalar measure ranging from 0 to 1 that encompassed all of
the inefficiencies that the model can identify was done to analyze the rooms for reducing inputs or increasing outputs for DMUs. (Cooper, Seiford & Tone, 2004).
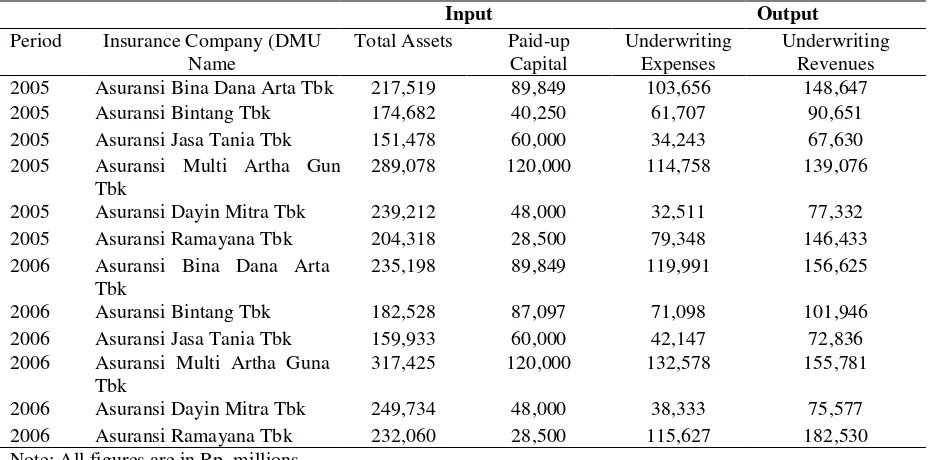
To get the percentage of slack: Input slack percentage = Input slac x 100. Actual input (actual or original data). As shown in table 1 for the list of six (6) sample insurance companies with the financial in this study, considering three (3) input variables and one (1) output variables and one (1) output variable. The variables were then subjected to the DEA method under the constant returns to scale (CRS) and variable return to scale (VRS) assumption for the twelve (12) pooled data or decision making units (DMUs).
Table 1. Actual Financial Data of the Selected Insurance Companies
Input Output
Period Insurance Company (DMU Name
Total Assets Paid-up Capital
Underwriting Expenses
Underwriting Revenues 2005 Asuransi Bina Dana Arta Tbk 217,519 89,849 103,656 148,647
2005 Asuransi Bintang Tbk 174,682 40,250 61,707 90,651
2005 Asuransi Jasa Tania Tbk 151,478 60,000 34,243 67,630
2005 Asuransi Multi Artha Guna Tbk
289,078 120,000 114,758 139,076
2005 Asuransi Dayin Mitra Tbk 239,212 48,000 32,511 77,332
2005 Asuransi Ramayana Tbk 204,318 28,500 79,348 146,433
2006 Asuransi Bina Dana Arta Tbk
235,198 89,849 119,991 156,625
2006 Asuransi Bintang Tbk 182,528 87,097 71,098 101,946
2006 Asuransi Jasa Tania Tbk 159,933 60,000 42,147 72,836
2006 Asuransi Multi Artha Guna Tbk
317,425 120,000 132,578 155,781
2006 Asuransi Dayin Mitra Tbk 249,734 48,000 38,333 75,577
2006 Asuransi Ramayana Tbk 232,060 28,500 115,627 182,530
Note: All figures are in Rp. millions
Empirical Results. A firm is said to display technical efficiency (TECRS) if it produces on the boundary of the production possibility set, i.e., it maximizes output with given inputs and after having chosen technology. This boundary of frontier is defined as the best practice observed assuming constant returns to scale. Meanwhile, technical efficiency can be
Vol. 8, 2009 Measuring the Efficiency of Indonesian Insurance 135 Table 2. Efficiency Summary DEA Efficiency Scores & Rankings – CRS Input
DMU No.
Period Bank (DMU Name)
Efficiency Scores
DEA Ranking
Reference Set (DMU No.)/Peer
1 2005 Asuransi Bina Dana Arta Tbk 0.88434 5 6,12
2 2005 Asuransi Bintang Tbk 0.78392 9 5,6
3 2005 Asuransi Jasa Tania Tbk 0.96269 4 5,6
4 2005 Asuransi Multi Artha Guna Tbk 0.66619 12 6,12
5 2005 Asuransi Dayin Mitra Tbk 1.00000 1 5
6 2005 Asuransi Ramayana Tbk 1.00000 1 6
7 2006 Asuransi Bina Dana Arta Tbk 0.84663 8 12
8 2006 Asuransi Bintang Tbk 0.77850 10 6,12
9 2006 Asuransi Jasa Tania Tbk 0.87217 6 5,6
10 2006 Asuransi Multi Artha Guna Tbk 0.66741 11 6,12
11 2006 Asuransi Dayin Mitra Tbk 0.86792 7 5,6
12 2006 Asuransi Ramayana Tbk 1.00000 1 12
Using the DEA – CRS input assumption, Table 2 presents that only three (3) DMUs: 5,6, 12 obtained efficiency scores of 1.00: Asuransi Dayin Mitra Tbk-2005, Asuransi Ramayana Tbk-2005 and Asuransi Ramayana Tbk-2006. In other words, these best practice DMUs generate revenues and provide services requiring fewer resources than do their peers. The other nine (9) DMUs: 1,2,3,4,7,8,9,10 and 11 obtained efficiency scores below 1.00. This indicates that they can make substantial improvements in terms of increasing
productivity. Table 2 includes peer groups (or reference sets) in addition to the efficiency scores obtained from DEA analysis. Here were note that the reference groups for DMU 4 (Asuransi Multi Artha Guna Tbk-2005) which is the least efficient (efficiency score of 0.66619) are DMU 6 and 12. DMU 1, 8 and 10 have the same reference groups (6 and 12) as DMU 4. The reference groups for DMU 2, 3, 9 and 11 are DMU 5 and 6, and DMU 7’s reference is DMU 12. It could be argued that the DEA results ranking the DMUs in terms of their operational efficiency.
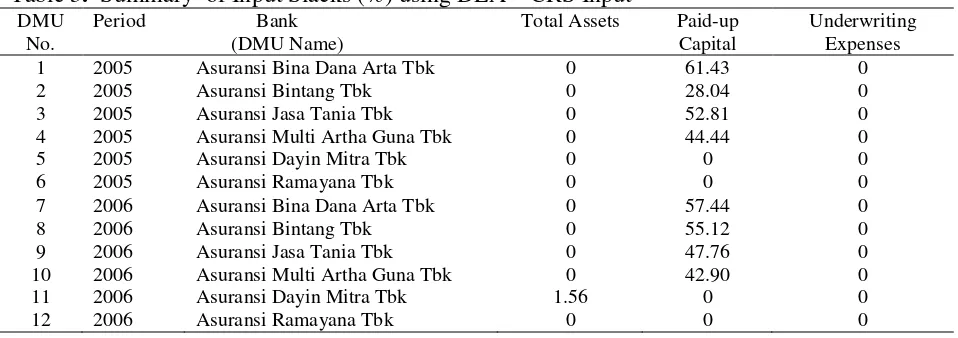
Table 3. Summary of Input Slacks (%) using DEA – CRS Input DMU
No.
Period Bank (DMU Name)
Total Assets Paid-up Capital
Underwriting Expenses
1 2005 Asuransi Bina Dana Arta Tbk 0 61.43 0
2 2005 Asuransi Bintang Tbk 0 28.04 0
3 2005 Asuransi Jasa Tania Tbk 0 52.81 0
4 2005 Asuransi Multi Artha Guna Tbk 0 44.44 0
5 2005 Asuransi Dayin Mitra Tbk 0 0 0
6 2005 Asuransi Ramayana Tbk 0 0 0
7 2006 Asuransi Bina Dana Arta Tbk 0 57.44 0
8 2006 Asuransi Bintang Tbk 0 55.12 0
9 2006 Asuransi Jasa Tania Tbk 0 47.76 0
10 2006 Asuransi Multi Artha Guna Tbk 0 42.90 0
11 2006 Asuransi Dayin Mitra Tbk 1.56 0 0
12 2006 Asuransi Ramayana Tbk 0 0 0
Table 3 shows the summary of input slacks (excess) with DEA-CRS Input. In 2005 and 2006, Asuransi Bina Dana Arta Tbk, Asuransi Bintang Tbk, Asuransi Jasa Tania Tbk, and Asuransi Multi Artha Guna posted excesses as obtained in the inputs for paid-up capital. While Asuransi Dayin Mitra Tbk–2006 incurred input slack (excess) in total assets. The result is consistent with
Table 4. Efficiency Summary DEA Efficiency Scores & Rankings – VRS Input
DMU No.
Period Bank (DMU Name)
Efficiency Score
DEA Ranking
Reference Set (DMU No.) / Peer
1 2005 Asuransi Bina Dana Arta Tbk 0.94713 9 6,12
2 2005 Asuransi Bintang Tbk 1.00000 1 2
3 2005 Asuransi Jasa Tania Tbk 1.00000 1 3
4 2005 Asuransi Multi Artha Guna Tbk 0.68973 11 3,6
5 2005 Asuransi Dayin Mitra Tbk 1.00000 1 5
6 2005 Asuransi Ramayana Tbk 1.00000 1 6
7 2006 Asuransi Bina Dana Arta Tbk 0.90201 10 6,12
8 2006 Asuransi Bintang Tbk 0.95595 8 3,6
9 2006 Asuransi Jasa Tania Tbk 0.96896 6 3,6
10 2006 Asuransi Multi Artha Guna Tbk 0.66937 12 6,12
11 2006 Asuransi Dayin Mitra Tbk 0.96210 7 5,6
12 2006 Asuransi Ramayana Tbk 1.00000 1 12
Using the DEA – VRS input assumption, Table 4 presents that there are five (5) DMUs: 2, 3, 5, 6 and 12 obtained efficiency scores of 1.00, namely: Asuransi Bintang Tbk-2005, Asuransi Jasa Tania Tbk-2005, Asuransi Dayin Mitra Tbk-2005, Asuransi Ramayana Tbk-2005 and Asuransi Ramayana Tbk-2006. In other words, these best practice DMUs generate revenues and provide services requiring fewer resources than do their peers. The other seven (7)
DMUs: 1, 4, 7, 8, 9, 10 and 11 obtained efficiency scores below 1.00. This indicates that they can make substantial improvements in terms of increasing productivity. Table 4 includes peer groups (or reference sets) in addition to the efficiency scores obtained from DEA analysis. Here we note that the reference groups for DMU 10, the least efficient (efficiency score of 0.66937) are DMU 6 and 12 with efficiency scores of 1.00.
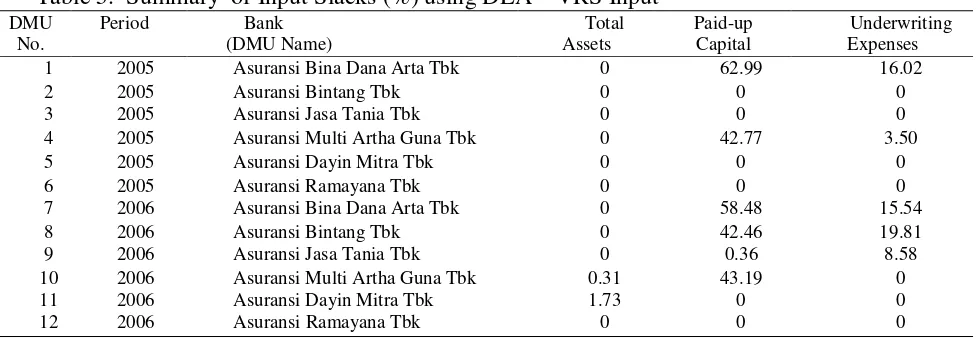
Table 5. Summary of Input Slacks (%) using DEA – VRS Input DMU
No.
Period Bank
(DMU Name)
Total Assets
Paid-up Capital
Underwriting Expenses
1 2005 Asuransi Bina Dana Arta Tbk 0 62.99 16.02
2 2005 Asuransi Bintang Tbk 0 0 0
3 2005 Asuransi Jasa Tania Tbk 0 0 0
4 2005 Asuransi Multi Artha Guna Tbk 0 42.77 3.50
5 2005 Asuransi Dayin Mitra Tbk 0 0 0
6 2005 Asuransi Ramayana Tbk 0 0 0
7 2006 Asuransi Bina Dana Arta Tbk 0 58.48 15.54
8 2006 Asuransi Bintang Tbk 0 42.46 19.81
9 2006 Asuransi Jasa Tania Tbk 0 0.36 8.58
10 2006 Asuransi Multi Artha Guna Tbk 0.31 43.19 0
11 2006 Asuransi Dayin Mitra Tbk 1.73 0 0
12 2006 Asuransi Ramayana Tbk 0 0 0
Table 5 presents the percentage of input reduction between efficient and inefficient firms. For total assets, 2 out of 12 DMUs have the presence of input slacks, namely: Asuransi Multi Artha Guna Tbk-2006 (0.31%) and Asuransi Dayin Mitra Tbk-2006 (1.73%). 5 out of 12 DMUs obtained input slacks for paid-up capital, namely: Asuransi Bina Dana Artha Tbk-2005 (62.99%), Asuransi Multi Artha Guna Tbk-
Arta-Vol. 8, 2009 Measuring the Efficiency of Indonesian Insurance 137 2006 (15.54%), Asuransi Bintang Tbk-2006
(19.81%) and Asuransi Jasa Tania Tbk-2006 (8.58%). The slack refers to input excess.
A firm must have a slack equal to zero. Beyond this is inefficiency.
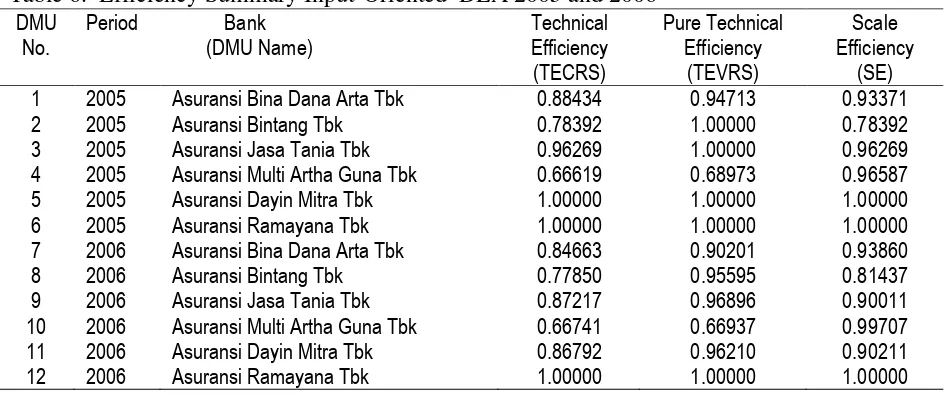
Table 6. Efficiency Summary Input-Oriented DEA 2005 and 2006
DMU
4 2005 Asuransi Multi Artha Guna Tbk 0.66619 0.68973 0.96587
5 2005 Asuransi Dayin Mitra Tbk 1.00000 1.00000 1.00000
6 2005 Asuransi Ramayana Tbk 1.00000 1.00000 1.00000
7 2006 Asuransi Bina Dana Arta Tbk 0.84663 0.90201 0.93860
8 2006 Asuransi Bintang Tbk 0.77850 0.95595 0.81437
9 2006 Asuransi Jasa Tania Tbk 0.87217 0.96896 0.90011
10 2006 Asuransi Multi Artha Guna Tbk 0.66741 0.66937 0.99707 11 2006 Asuransi Dayin Mitra Tbk 0.86792 0.96210 0.90211
12 2006 Asuransi Ramayana Tbk 1.00000 1.00000 1.00000
The summary results of running the two DEA models (CRS model and VRS model) are shown in Table 6 for 2005 and 2006 indicating that the performance of firms in TECRS and TEVRS show a variation. When CRS was assumed, only three (3) DMUs scored 1.00. These DMUs were Asuransi Dayin Mitra Tbk-2005, Asuransi Ramayana Tbk-2005 and Asuransi Ramayana Tbk-2006. On the other hand, when VRS was assumed there are two more DMUs scored 1.00. They are Asuransi Bintang Tbk-2005 and Asuransi Jasa Tania Tbk-2005.
The findings show that only Asuransi Dayin Mitra Tbk-2005, Asuransi Ramayana Tbk-2005 and Asuransi Ramayana Tbk-2006 posted a constant performance with fully low CRS score. This result indicates that they are operating locally efficiently but not globally efficiently due to the scale size. This is consistent with the study of lo and Lu (2006) on the efficiency of financial holding companies (FHCs) in Taiwan which indicates that bi-sized FHCs are generally more both the CCR and BCC scores, it is operating in the most productive scale size. If a DMU operating locally and globally efficiently. They are Asuransi Dayin Mitra Tbk-2005, Asuransi Ramayana Tbk-2005 and Asuransi Ramayana Tbk-2006.
Using DEA (input-oriented) CCR and BCC scores, Asuransi Ramayana Tbk shows as the best practice insurance company for the fiscal year 2005 and 2006 in generating revenues and providing services requiring fewer resources than do its peers. Asuransi Bintang Tbk and Asuransi Jasa Tania Tbk was operating locally efficient but not globally efficient in 2005. The other two companies, Asuransi Bina Dana Arta Tbk and Asuransi Multi Artha Guna Tbk show low BCC score and CCR score in both fiscal years indicating that they were operating locally and globally inefficient in both 2005 and 2006.
outcomes of a DEA assessment. Inefficient DMUs can learn from and emulate their efficient peers regarding what needs to be done to improve. Furthermore, operational practices identified as contributing to efficiency may be studied, and information gathered may be disseminated throughout the entire organisation that seeks to investigate, improve and grow. A review on the usage of indentified input resources to minimize input slacks in their is needed to be done.
REFERENCES
Banker, R. D., Charnes, A., & Cooper, W. W. (1984). Some model for estimating technical and Scale inefficiencies in data envelopment analysis. Management Science, 30, 1078-1092. Barros, C.P. (2005), Performance
measurement in tax offices with a stochastic frontier model. Journal of Economic Studies, Vol. 32 No. 6, 497 – 510.
Berger, A. N., & Humphrey, D. B. (1977). Efficiency of financial institutions: Internal survey and directions for future research. European Journal of Operational Research, 98, 175-213. Charnes, A., Cooper, W. W., & Rhodes, E.
(1978). Measuring efficiency of decision making Units. European Journal of Operational Research, 2, 429-44.
Coelli, T., Prasada Rao, D. & Battese, G. (2005), An introduction to efficiency and productivity analysis , Springer, New York, NY.
Cooper, W.W., Seiford, L.M., & Zhu, J. (2004). Handbook on data envelopment analysis. Boston, MA: Kluwer Academic Publishers.
Cooper, W.W., Seiford, L.M., & Tone, K. (2004). Data Envelopment analysis. A comprehensive Text with models, applications, references and DEA-Solver software. Boston, MA: Kluwer Academic Publishers.
Lo, S., & Lu, W. (2006), “Does size matter? Finding the profitability and marketability Benchmark of financial
holding companies”. Asia-Pacific
Journal of Operational Research, Vol. 23, 229-46.
Prahalad, C.K., & Hamel, G. (1990). The core competence of the corporation. Harvard Business Review, 68 (3), 79-91.
Sarkis, J., & Weinrach, J. (2001). Using data development analysis to evaluate environmentally Conscious waste treatment technology. Journal of Cleaner Production, Vol. 9, 417-27. USAID-Indonesia. (2007, June) Alliance for Indonesia insurance education. Retrieved
June 12, 2009, from