Abnormal glucose metabolism in non-diabetic patients
presenting with an acute stroke: prospective study and
systematic review
J.A. DAVE
1, M.E. ENGEL
2, R. FREERCKS
1, J. PETER
1, W. MAY
1, M. BADRI
2,
L. VAN NIEKERK
1and N.S. LEVITT
1From the
1Division of Diabetic Medicine and Endocrinology and
2Department of Medicine, Groote
Schuur Hospital, 7925 Cape Town, South Africa
Address correspondence to Dr J.A. Dave, Division of Diabetic Medicine and Endocrinology, Department of Medicine, J-floor, Old Main Building, Groote Schuur Hospital, Anzio Road, Observatory, 7925, Cape Town, South Africa. email: [email protected]
Received 21 August 2009 and in revised form 30 November 2009
Summary
Background:Non-diabetic patients presenting with an acute stroke often have hyperglycaemia. In most populations it is unknown whether the hypergly-caemia is transient and due to the acute stress response or whether it represents undiagnosed abnormal glucose metabolism.
Aim: To evaluate the prevalence and predictors of persistent hyperglycaemia in non-diabetic patients with an acute stroke.
Design:Prospective observational study.
Methods: Non-diabetic patients over 40 years old with an acute stroke were enrolled over a 2-year period. On admission patients were evaluated with an HbA1c and a 75 g oral glucose tolerance test (OGTT). The OGTT was repeated 3 months later. A meta-analysis was performed to interpret our results in the context of published data.
Results:One hundred and seven patients were ana-lysed. On admission 26 (24%) patients had diabetes,
39 (37%) had impaired glucose tolerance and 42 (39%) had normal glucose tolerance. Forty-four (68%) patients with hyperglycaemia on admission were re-investigated at least 3 months after discharge. Of these, 6 (14%) had diabetes, 12 (27%) had impaired glucose tolerance and 26 (59%) had normal glucose tolerance. A 2-h post-load glucose value 10 mmol/l predicted per-sistent hyperglycaemia with 72.2% sensitivity, 65.4% specificity and a positive predictive value and negative predictive value of 59.1 and 77.3%, respectively. A meta-analysis of prevalence data of impaired glucose metabolism in non-diabetic indi-viduals 3 months after having had an acute stroke revealed a combined prevalence of 58% (95% confidence interval 25.4–90.5%).
Conclusion: In this study hyperglycaemia in the setting of an acute stroke was transient in the majority of patients.
Introduction
There is a considerable global burden of diabetes. In the year 2000, an estimated 171 million people were affected by diabetes, whilst the excess global
mortality attributable to diabetes was 2.9 million. This accounted for 5.2% of all deaths.1This excess mortality was primarily due to cardiovascular dis-ease (CVD), and is likely to rise as an estimated
!The Author 2010. Published by Oxford University Press on behalf of the Association of Physicians. All rights reserved. For Permissions, please email: [email protected]
at National Guard Health Affairs (NGHA) on February 4, 2013
http://qjmed.oxfordjournals.org/
366 million people will have diabetes by the year 2030.2Diabetes also increases the risk of ischaemic stroke and is associated with a less favourable out-come than in people without diabetes. The import-ance of early initiation and maintenimport-ance of glycaemic control on all-cause mortality and myocardial infarction in people with diabetes has recently been demonstrated, adding to the well-recognized benefit of such control on micro-vascular complications.3–5Given these data, ideally diabetes should be diagnosed early, and treatment instituted prior to presentation with complications. Unfortunately this is often not the case. In a number of studies 50–60% of people who presented with an acute myocardial infarction were found to have un-diagnosed diabetes.6,7 In addition, many people with newly diagnosed diabetes have pre-existing
CVD as demonstrated in the
ADDITION-Cambridge screening and intervention study, in which 19% of screen positive people with diabetes had pre-existing CVD.8
Patients without known diabetes commonly have hyperglycaemia at presentation of an acute stroke, making the diagnosis of diabetes difficult as the hyperglycaemia may occur as an acute stress re-sponse,9–12 may represent previously undiagnosed impaired glucose metabolism13–16 or may be a
marker of infarct size.8,17,18 Although there is no evidence that rendering these patients euglycaemic is beneficial from the point of view of mortality and morbidity from the stroke, there is evidence that pre-venting persistent hyperglycaemia in patients with diabetes reduces microvascular disease and CVD.3,4,19It is therefore clinically important to rec-ognize these patients on admission so that they may benefit from long-term treatment with glucose low-ering agents. However, there is a paucity of data on predictors of persistent hyperglycaemia in patients presenting with an acute stroke who are not known to have diabetes. We therefore investigated the prevalence and predictors of persistent hypergly-caemia in these patients. Furthermore, since there is currently no systematic review of the published lit-erature on the prevalence of persistent hypergly-caemia in non-diabetic patients who have had an acute stroke, we analysed our results in the context of published data through a meta-analysis.
Methods
Patients
Patients without known diabetes who were admitted to two participating hospitals with a diagnosis of acute stroke at specific times between July 2004
and 2006 were approached for participation in this study. Exclusion criteria included: being<40 years
of age; having a haemaglobinopathy or chronic an-aemia; being on chronic systemic glucocorticoid therapy, or having received such therapy in the last 1 month; inability to give consent. Acute stroke was defined according to the World Health Organisation (WHO) criteria i.e. rapidly developing clinical symptoms or signs of focal disturbance of cerebral function, lasting more than 24 h, with no apparent cause other than vascular origin.20 The diagnosis of stroke was established by history and neurological examination. Confirmation by com-puted tomography was obtained in a minority of patients due to problems of access. The research protocol was approved by the University of Cape Town Research and Ethics committee.
Protocol
Each patient fulfilling the selection criteria and having signed informed consent was enrolled into the study within 2 days of admission. After a 10-h overnight fast a plasma glucose and HbA1c were
measured. Serum lipids were measured on Days 2 or 3 and a standard 75 g oral glucose tolerance test (OGTT) was performed on Days 3 or 4 of admission. During the acute admission the following sociode-mographic and clinical data was collected: age, gender, ethnicity, previous history of hypertension and dyslipidaemia, family history of diabetes, smok-ing, systolic blood pressure (BP), diastolic BP, height, weight and waist circumference. At least 3 months after discharge the OGTT was repeated only in those patients diagnosed with hypergly-caemia during the acute admission. A fasting serum insulin level was measured on the pre-test fasting blood and the degree of insulin resistance was estimated by the homeostasis model assessment (HOMA) method.21
Definitions: diabetes—fasting plasma glucose (FPG)7 mmol/l or 2-h plasma glucose during the
OGTT11.1 mmol/l; pre-diabetes—2-h plasma
glucose during the OGTT7.8 mmol/l
but<11.1 mmol/l [impaired glucose tolerance
(IGT)] or FPG5.6 mmol/l but <7.0 mmol/l
[im-paired fasting glucose (IFG)]; dysglycaemia—dia-betes plus pre-diadysglycaemia—dia-betes; normal glucose tolerance (NGT)—FPG<5.6 mmol/l or a 2-h plasma glucose
during the OGTT<7.8 mmol/l.22,23
Assays
Plasma glucose was measured using the glucose oxidase method on samples collected in fluoride tubes. HbA1c analysis was done by the Diabetes
Control and Complications Trial (DCCT) method,
at National Guard Health Affairs (NGHA) on February 4, 2013
http://qjmed.oxfordjournals.org/
with an upper range of 6.0%. Insulin was measured using a radioimmunoassay (Roche Modular E170).
Statistical analysis
Normality assumption was tested using Shapiro– Wilks test. Variables failing this assumption were transformed when appropriate. These variables are presented as median [interquartile range (IQR)] and were analysed using the non-parametric Mann– Whitney U-test. Categorical variables are presented as frequency (percentage) and were compared using the2or Fischer’s exact test. The relationships be-tween 3-month glycaemic status and biochemical parameters as explanatory variables were assessed using multiple and or logistic regression techniques. A receiver operating characteristic (ROC) curve was plotted to determine the cut-points for predictors of dysglycaemia and their sensitivity, specificity, and predictive values. Statistical analyses were per-formed using SPSS (version 16.0.1) for Windows (SPSS Inc.) and STATA (version 10.0).
Systematic review and meta-analysis
Review inclusion and exclusion criteria
Prospective cohort studies investigating the preva-lence of dysglycaemia assessed according to WHO and American Diabetes Association (ADA) criteria in non-diabetic individuals with acute stroke were eligible for inclusion.22,23Studies with missing admission data or having follow-up data <3 months were excluded, as were those of chronic stroke or acute stroke due to prosthetic valves.
Study identification and eligibility.
Two inde-pendent observers (J.A.D. and M.E.E.) identified stu-dies from the MEDLINE database (from its earliest date until December 2008) using a predetermined search strategy incorporating the terms ("GLUCOSE METABOLISM DISORDERS"[MESH] AND "CEREBROVASCULAR DISORDERS"[MESH]) NOT ("MYOCARDIAL ISCHEMIA"[MESH] OR "HEART DISEASES"[MESH]) limited to articles with abstracts of studies conducted in adult participants. This pro-cess was complemented by reviewing citations and searching in Google Scholar. Language of publica-tion was restricted to English articles only. Titles and abstracts were screened, and full text articles ob-tained from potentially eligible reports. We immedi-ately excluded editorials and review articles.Data extraction.
From each study, we (J.A.D. and M.E.E.) independently recorded year of publication, study design, origin and demographics of partici-pants, diagnostic criteria, disease information,prevalence and standard error of the estimate. Where not provided, confidence intervals (CIs) were incorporated into the formula, SE = (upper limit lower limit)/3.92.
Data synthesis.
Prevalence data from individual studies were combined by random-effects meta-analysis according to the Mantel–Haenszel method. Heterogeneity was evaluated using the 2-based Q statistic (significant for P<0.1). We also used the I2 statistic, considering values above 56% to be indicative of ‘notable’ heterogen-eity (Higgins). STATA software version 9.2 (STATA Corporation, College Station, Texas) was used to perform calculations and the meta-analysis and to produce the forest plots using the metan routine.Results
One hundred and twenty-one patients were en-rolled. Fourteen patients were excluded (one patient tested HIV-positive, three patients died before com-pleting the questionnaire or admission OGTT, nine patients did not have an OGTT during the acute admission and one patient withdrew from the study) leaving 107 eligible patients who were included in this report.
Acute admission
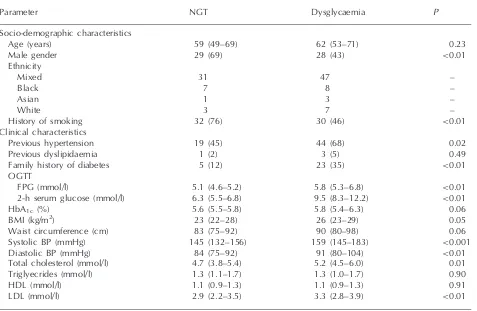
Baseline clinical and biochemical characteristics are summarized in Table 1. Sixty-five patients (61%) were dysglycaemic [26 (24%) had diabetes and 39 (37%) had pre-diabetes] and 42 (39%) had NGT. The dysglycaemic patients were more likely to be female (P<0.01), had previous hypertension (P= 0.02) and a family history of diabetes (P<0.01). In addition, they had higher systolic (P<0.001) and diastolic (P<0.01) BPs, a higher total cholesterol (P<0.01) and a higher low-density lipoprotein (LDL) cholesterol (P<0.01) than the pa-tients with NGT. Unexpectedly, the latter papa-tients were more likely to have ever smoked than the dys-glycaemic patients (P<0.01). This may be because more women were dysglycaemic and there were less women that ever smoked than men (P<0.0001).
Subsequent review
3 months after
discharge
Of the 65 patients with dysglycaemia on admission, 44 were re-investigated at 3 months after dis-charge; 41 with an OGTT and 3 patients with a FPG and HbA1c because they were on oral
at National Guard Health Affairs (NGHA) on February 4, 2013
http://qjmed.oxfordjournals.org/
hypoglycaemic agents (Table 2). The remaining 21 patients were not re-assessed due to death after dis-charge [13 (20%) patients: eight patients with dia-betes and five patients with pre-diadia-betes] and inadequate contact details [8 (12%) patients]. Eighteen (41%) of the 44 patients investigated re-mained dysglycaemic [6 (14%) had diabetes, 12 (27%) had pre-diabetes] and 26 (59%) had NGT (Table 2). The three patients on oral hypoglycaemic agents were considered to have diabetes as sup-ported by their elevated FPG and HbA1c despite
treatment (Patient A: FPG 6.6 mmol/l, HbA1c6.7%;
patient B: FPG 6.8 mmol/l, HbA1c 6.6%; patient C:
FPG 6.8 mmol/l, HbA1c 6.3%). Of the 26 patients
classified with diabetes during the acute admission, 5 (19%) remained diabetic, 6 (23%) had pre-diabetes and 6 (23%) had NGT (Table 3). In the 39 patients with pre-diabetes during the acute admission, 1 (3%) developed diabetes, 6 (15%) remained with pre-diabetes and 20 (51%) reverted to NGT (Table 3). Patients with dysglycaemia had a higher median HbA1c (5.95%, IQR 5.5–6.4 vs.
5.5%, IQR 5.2–6.1;P= 0.04) and median homeosta-sis model assessment of insulin resistance
(HOMA-IR) (3.5, IQR 2.7–4.7 vs. 1.4, IQR 0.9–2.2;
P0.001) than those with NGT, but age, gender, past history of hypertension or dyslipidaemia, family history of diabetes, current/previous smoking, body mass index (BMI), waist circumference, BP, triglycerides and high-density lipoprotein (HDL) did not differ between those with NGT or dysglycaemia.
On admission, patients that subsequently died had a significantly higher FPG than those alive at follow-up (10.43.9 mmol/l, 95% CI: 8.8; 12 vs. 8.63.3 mmol/l, 95% CI: 7.9; 9.3,
P= 0.043) but there was no significant difference in HbA1c.
Logistic regression analysis revealed the 2-h post-load glucose value on admission to be the only significant predictor of persistent dysglycaemia 3 months after discharge. A 2-h post-load glucose value 10 mmol/l predicted dysglycaemia with 72.2% sensitivity, 65.4% specificity and gave a posi-tive predicposi-tive value (PPV) and negaposi-tive predicposi-tive value (NPV) of 59.1 and 77.3%, respectively (Table 4). The area under the ROC curve was 0.76 (95% CI: 0.61–0.90).
Table 1 Characteristics of the study population during the acute admission
Parameter NGT Dysglycaemia P
Socio-demographic characteristics
Age (years) 59 (49–69) 62 (53–71) 0.23
Male gender 29 (69) 28 (43) <0.01
Ethnicity
Mixed 31 47 –
Black 7 8 –
Asian 1 3 –
White 3 7 –
History of smoking 32 (76) 30 (46) <0.01
Clinical characteristics
Previous hypertension 19 (45) 44 (68) 0.02
Previous dyslipidaemia 1 (2) 3 (5) 0.49
Family history of diabetes 5 (12) 23 (35) <0.01
OGTT
FPG (mmol/l) 5.1 (4.6–5.2) 5.8 (5.3–6.8) <0.01
2-h serum glucose (mmol/l) 6.3 (5.5–6.8) 9.5 (8.3–12.2) <0.01
HbA1c(%) 5.6 (5.5–5.8) 5.8 (5.4–6.3) 0.06
BMI (kg/m2) 23 (22–28) 26 (23–29) 0.05
Waist circumference (cm) 83 (75–92) 90 (80–98) 0.06
Systolic BP (mmHg) 145 (132–156) 159 (145–183) <0.001
Diastolic BP (mmHg) 84 (75–92) 91 (80–104) <0.01
Total cholesterol (mmol/l) 4.7 (3.8–5.4) 5.2 (4.5–6.0) 0.01 Triglyecrides (mmol/l) 1.3 (1.1–1.7) 1.3 (1.0–1.7) 0.90
HDL (mmol/l) 1.1 (0.9–1.3) 1.1 (0.9–1.3) 0.91
LDL (mmol/l) 2.9 (2.2–3.5) 3.3 (2.8–3.9) <0.01
Categorical variables presented asn(%) withP-values by the2test. Continuous variables presented as median (IQR) with
P-values by the Mann–Whitney U-test for non-parametric data. BP: blood pressure.
at National Guard Health Affairs (NGHA) on February 4, 2013
http://qjmed.oxfordjournals.org/
Systematic review and meta-analysis
The search strategy yielded 935 citations. Records were screened by title after which 48 articles were deemed to be potentially relevant. Abstracts were evaluated by two observers working independently and 43 studies were excluded; following full-text scrutiny, one publication was excluded, while for a further two, the full text was unavailable. Reasons for exclusion were known diabetics included (n= 3), no glycaemic data provided(n= 5), no admission OGTT and no follow-up data at3 months (n= 35).
Characteristics of the included studies
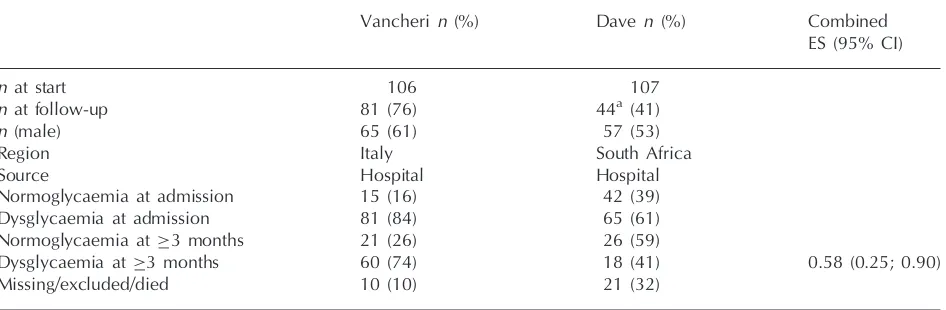
One publication (Vancheri) satisfied our inclusion criteria (Table 5). Together with our unpublished data, the eligible studies pertained to two distinct study populations comprising 213 participants with median ages of 71.0 and 61.0 years, respectively. The proportions of men were 61 and 53%,
Table 2 Characteristics of the subjects that were dysglycaemic on admission and who were re-tested after 3 months
Parameter NGT Dysglycaemia P
n 26 18
Age (years) 64.0 (52–72) 65 (53–73) 0.95
Female gender 13 (50) 13 (72) 0.14
Previous hypertension 18 (69) 12 (67) 0.86
History of smoking 11 (42) 11 (61) 0.22
Previous dyslipidaemia 2 (8) 1 (6) 0.64a
Family history of diabetes mellitus 7 (27) 5 (28) 0.95 Admission
BMI (kg/m2) 26 (23–29) 27 (24–30) 0.33
Waist circumference (cm) 93 (78–99) 93 (87–100) 0.90 Systolic BP (mmHg) 167 (150–191) 159 (140–210) 0.70 Diastolic BP (mmHg) 94 (85–104) 87 (76–104) 0.21
HbA1c(%) 5.5 (5.2–6.1) 6.0 (5.5–6.4) 0.04
OGTT
FPG (mmol/l) 5.7 (5.3–6.3) 6.4 (5.8–6.8) 0.15 2-h plasma glucose (mmol/l) 9.1 (8.2–10.3) 10.9 (9.4–14.4) 0.004 Total cholesterol (mmol/l) 5.5 (4.9–6.0) 5.3 (4.7–6.1) 0.69 Triglyecrides (mmol/l) 1.3 (1.1–1.5) 1.5 (1.2–2.3) 0.12
HDL (mmol/l) 1.1 (0.9–1.3) 1.1 (0.8–1.2) 0.39
LDL (mmol/l) 3.5 (3.0–4.1) 3.3 (2.9–3.9) 0.65
3 months
OGTT
FPG (mmol/l) 5.0 (4.8–5.3) 6.0 (5.6–6.6) <0.001
2-h plasma glucose (mmol/l) 5.7 (5.0–6.7) 8.4 (6.2–10.1) <0.001
Fasting serum insulin (mU/l) 6.5 (4.3–11.0) 14.4 (11.0–19.1) 0.001
HOMA 1.4 (0.9–2.2) 3.5 (2.7–4.7) <0.001
Time to re-testing (days) 147 (122–203) 130 (98–217) 0.41
Categorical variables presented as number (%) withP-values by the2test. Continuous variables presented as median (IQR)
withP-values by the Mann–Whitney Utest for non-parametric data. BP: blood pressure.
aFischer-exact test.
Table 3 Changing prevalence of glycaemic status of the dysglycaemic patients from admission to re-testing
Glycaemic status on admission n Glycaemic status3 months Died Lost to F/U
DM IGT NGT
Diabetes mellitus 26 5 (19) 6 (23) 6 (23) 5 (19) 4 (15)
IGT 39 1 (3) 6 (15) 20 (51) 8 (21) 4 (10)
Data aren(%). F/U: follow-up.
at National Guard Health Affairs (NGHA) on February 4, 2013
http://qjmed.oxfordjournals.org/
respectively. For the outcome of interest, a total of 125 subjects were included in the analysis. Both were observational studies conducted in Italy and South Africa, respectively and both classified im-paired glucose metabolism according to WHO and ADA criteria.
Meta-analysis of prevalence data of dysglycaemia in non-diabetic individuals 3 months after having had an acute stroke revealed a combined preva-lence of 58% (95% CI: 25.4–90.5%) (Table 5). Statistically significant heterogeneity [heterogeneity
2significant (P<0.01),I2>90%] was found across
the studies.
Discussion
In this prospective study, the second to evaluate glu-cose homeostasis in patients without a prior diagno-sis of diabetes and an acute stroke, using a FPG and
OGTT on admission and again within 3–12 months after discharge, 61% of patients were found to be dysglycaemic (24% had diabetes and 36% pre-diabetes) on admission. However, by 3–12 months after discharge the majority (59%) had NGT leaving an overall prevalence of persistent dys-glycaemia of 21% (7% with diabetes and 14% with pre-diabetes). The 2-h post-load blood glucose on admission was most predictive of dysglycaemia at 3 months.
Although the prevalence of dysglycaemia on ad-mission was high in this study, it was lower than that reported in the only other study using a FPG and OGTT to evaluate glucose homeostasis on admis-sion and again at least 3 months later.16 In that study, the prevalence of dysglycaemia on admission was 84.3% (45.8% had diabetes and 38.5% IGT). The higher prevalence may be due to the older age of their patients (69.6 years, IQR 63.2–76.7 vs. 61 years, IQR 51.0–71.0). Interestingly, the majority
Table 4 Sensitivity, specificity and predictive values of the 2-h post-load glucose on admission for predicting dysglycaemia
at3 months after discharge
Two-hour post-load glucose (mmol/l) on admission
Sensitivity (%) Specificity (%) PPV (%) NPV (%)
6 100.0 (82.4–100) 3.8 (0.7–18.9) 41.9 (28.4–56.7) 100.0 (20.7–100)
7 100.0 (82.4–100) 7.7 (2.1–24.1) 42.9 (29.1–57.8) 100.0 (34.2–100)
8 94.4 (74.2–99.0) 15.4 (6.2–33.5) 43.6 (29.3–59.0) 80.0 (37.6–96.4)
9 88.9 (67.2–96.9) 50.0 (32.1–67.9) 55.2 (37.6–71.6) 86.7 (62.1–96.3)
10 72.2 (49.1–87.5) 65.4 (46.2–80.6) 59.1 (38.8–76.7) 77.3 (56.6–89.9)
11 50.0 (29.0–71.0) 84.6 (66.50–93.9) 69.2 (42.4–87.3) 71.0 (53.4–83.9)
12 38.9 (20.3–61.4) 88.5 (71.0–96.0) 70.0 (39.7–89.2) 67.7 (50.8–80.9)
13 38.9 (20.3–61.4) 96.2 (81.1–99.3) 87.5 (52.9–97.8) 69.4 (53.1–82.0)
14 27.8 (12.5–50.9) 96.2 (81.1–99.3) 83.3 (43.7–97.0) 65.8 (49.9–78.8)
15 22.2 (9.0–45.2) 96.2 (81.1–99.3) 80.0 (37.6–96.4) 64.1 (48.4–77.3)
Table 5 General characteristics of studies included in the systematic review and meta-analysis
Vancheri n(%) Daven (%) Combined
ES (95% CI)
n at start 106 107
n at follow-up 81 (76) 44a (41)
n (male) 65 (61) 57 (53)
Region Italy South Africa
Source Hospital Hospital
Normoglycaemia at admission 15 (16) 42 (39)
Dysglycaemia at admission 81 (84) 65 (61)
Normoglycaemia at 3 months 21 (26) 26 (59)
Dysglycaemia at 3 months 60 (74) 18 (41) 0.58 (0.25; 0.90)
Missing/excluded/died 10 (10) 21 (32)
n: number; ES: effect size.
aOnly patients that were dysglycaemic at admission were re-evaluated.
at National Guard Health Affairs (NGHA) on February 4, 2013
http://qjmed.oxfordjournals.org/
(74%) of their patients with dysglycaemia on admis-sion remained dysglycaemic when re-tested 3 months after discharge (43% had diabetes and 31% IGT) leaving their overall prevalence of dysgly-caemia at 65% (37.5% with diabetes and 27.1% with IGT), suggesting a pre-existent abnormality of glucose metabolism in the majority of their patients. On the other hand, the majority of dysglycaemic patients in our study reverted to euglycaemia, indi-cating that the hyperglycaemia on admission was likely to be due to the acute stress response. It has been debated whether the acute stress response plays a significant physiological role, nevertheless, it is well-documented that the diabetogenic hor-mones cortisol and catecholamines are elevated in some patients with an acute stroke.11,12,24 Whilst even in a population-based survey in rural Tanzania 80% of subjects with IGT reverted to NGT within 5 days, partly attributable to the ‘orient-ing reflex’ in BP measurements in a population un-familiar with blood testing.25
Patients in developing countries present later in the course of their illness, which in the case of an acute stroke may result in a larger infarct area and higher blood glucose. The causal relationship between hyperglycaemia and larger infarcts remains unknown, but is speculated to be due to increased oxidative stress and inflammation found in the set-ting of hyperglycaemia.26 Interestingly, the patients in this study that died had a higher fasting blood glucose level on admission than those that survived yet there was no difference in HbA1c, suggesting
pre-stroke euglycaemia and possibly larger and more severe cerebral infarcts. This is consistent with the study by Murros et al. that showed that pre-stroke hyperglycaemia (as suggested by an increased HbA1c) did not have any predictive
value concerning stroke outcome but that post-stroke fasting hyperglycaemia correlated strongly with stroke severity and predicted stroke outcome.27 They suggest that a high fasting blood glucose after a stroke reflects a stress response to a more severe ischemic brain lesion. Other studies in animals and humans have shown an association between hyperglycaemia and worse outcome after stroke in terms of both mortality and morbidity.18,28–30
Our study differs from most other studies that have assessed hyperglycaemia in the acute stroke setting in that it was designeda priorito examine the ques-tion of persistent hyperglycaemia. For that reason, only patients with hyperglycaemia on admission were re-examined. However, we were only able to re-investigate 68% of the dysglycaemic patients as 13 (20%) had died and 8 (12%) were lost to follow-up. The latter observation is probably due
in large part to patients giving incorrect contact details so as to qualify for admission to their hospital of choice rather than the hospital closest to where they live. If one assumes that all those not re-examined became euglycaemic (best case scenario) or that they remained dysglycaemic (worst case scenario) then the lowest and highest prevalences of dysglycaemia are 28 and 60%, respectively. Even at 60%, the worst case scenario provides a much lower prevalence than described by Vancheri et al.16
A dearth of factors examined on admission (including age, gender, smoking, previous history of hypertension, family history of diabetes, BP, lipids, BMI, waist circumference, HbA1c, fasting
in-sulin and HOMA) proved to be predictive of dysgly-caemia at follow-up. Both the present study and that of Vancheri et al. found the 2-h post-load plasma glucose on admission to be most predictive of dys-glycaemia at 3 months. This may be somewhat sur-prising as the poor reproducibility of the 2-h post-load glucose would be expected to cast doubt on its ability to be a predictive test. The use of a composite score including multiple diabetes risk factors such as waist girth or BMI, family history of diabetes, age and levels of physical activity may prove to be more useful and its utility should be explored in a larger cohort. This would permit early introduction of appropriate glucose lowering therapy and attainment of euglycaemia or close to euglycaemia immediately after the stroke, with the recognized benefits.
We attempted to analyse our results in the context of existing studies. However this systematic review highlights the lack of well-designed prospective stu-dies utilizing both a FPG and 2-h post-load plasma glucose to identify dysglycaemic patients (as recom-mended by the WHO and ADA). We believe that most studies were likely to have missed patients with abnormal glucose metabolism on admission as they did not use a FPG and OGTT to diagnose dysgly-caemia. In addition, most studies do not have follow-up glycaemic data and are therefore unable to assess the prevalence of persistent dysglycaemia. The studies by Kernanet al.14and Grayet al.31 con-tain follow-up glycaemic data and are similar to those included in the meta-analysis, but are likely to have missed patients with abnormal glucose me-tabolism, as no OGTT was done on admission and only patients whose fasting blood glucose was within a specifically defined range were included. Lam et al. report a prevalence of 17 and 26% of diabetes and IGT, respectively in Chinese patients with a stroke and no prior diagnosis of diabetes.28As their report does not contain glycaemic data on ad-mission, it is not possible to determine whether their
at National Guard Health Affairs (NGHA) on February 4, 2013
http://qjmed.oxfordjournals.org/
reported prevalence is of persistent dysgycaemia or whether the dysglycaemia developed in these pa-tients as a result of the stroke i.e. less physical activ-ity, weight gain and the use of diabetogenic drugs such as b-blockers and/or thiazide diuretics. In our meta-analysis, the results showed significant hetero-geneity. Procedurally, the studies were similar in almost every respect and thus, we suspect that this variation is due to the difference in the number of participants for which follow-up data were avail-able. Nevertheless, a meta-analysis of these studies is still useful in providing an idea of the overall prevalence which indicates a combined prevalence of persistent dysglycaemia of 58%.
It is concerning that a significant number of stroke patients with no prior history of diabetes have their first clinical presentation of dysglycaemia as an acute stroke. It seems that opportunistic screening of individuals with risk factors for diabetes who attend a health service will allow for earlier diagno-sis and initiation of therapy and a chance to avert or delay micro and macrovascular complications. Indeed, the ADDITION-Cambridge study has shown that people with screen-detected type 2 dia-betes have an adverse cardiovascular risk profile and that a significant absolute reduction in this risk is achievable through multifactorial therapies.8 Since a proportion of hyperglycaemic non-diabetic stroke patients will have transient hyperglycaemia or prediabetes, it is important that these patients undergo strict lifestyle modification and are re-assessed with an OGTT at least 3 months after discharge.
In conclusion, we report a high prevalence of transient dysglycaemia in patients with an acute stroke. It is concerning that at least 21% of patients in our study had undiagnosed dysglycaemia. In agreement with studies post-myocardial infarction and in the absence of significant predictive factors we suggest a follow-up OGTT at least 3 months after discharge in hyperglycaemic acute stroke patients with no prior history of diabetes.
Acknowledgement
The authors wish to thank Dr Frances Wilson for helping with the recruitment of patients.
Funding
The Medical Research Council of South Africa and the University of Cape Town.
Conflict of interest: None declared.
References
1. Roglic G, Unwin N, Bennett PH, Mathers C, Tuommilehto J, Nag S,et al.The burden of mortality attributable to diabetes – realistic estimates for the year 2000. Diab Care 2005; 28:2130–5.
2. Wild S, Roglic G, Green A, Sicree R, King H. Global prevalence of diabetes–estimates for the year 2000 and projections for 2030. Diab Care 2004; 27:1047–53.
3. Intensive blood-glucose control with sulphonylureas or insu-lin compared with conventional treatment and risk of com-plications in patients with type 2 diabetes (UKPDS 33). UK Prospective Diabetes Study (UKPDS) Group. Lancet1998; 352:837–53.
4. Holman RR, Paul SK, Bethel MA, Matthews DR, Neil HAW. 10-year follow-up of intensive glucose control in type 2 dia-betes.New Engl J Med2008;359:1577–89.
5. Nathan DM, Cleary PA, Backlund JY, Genuth SM, Lachin JM, Orchard TJ,et al.Intensive diabetes treatment and cardiovas-cular disease in patients with type 1 diabetes.N Engl J Med 2005;353:2643–53.
6. Norhammar A, Tenerz A, Nilsson G, Hamsten A, Efendic S, Ryden L, et al. Glucose metabolism in patients with acute myocardial infarction and no previous diagnosis of diabetes mellitus: a prospective study. Lancet 2002; 359:2140–4.
7. Lankisch M, Fu¨th R, Gu¨ker H, Lapp H, Bufe A, Haastert B, et al. Screening for undiagnosed diabetes in patients with acute myocardial infarction. Clin Res Cardiol 2008; 97:753–9.
8. Echouffo-Tcheugui JB, Sargeant LA, Prevost AT, Williams KM, Barling RS, Butler R,et al.How much might cardiovascular disease risk be reduced by intensive therapy in people with screen-detected diabetes?Diabet Med2008; 25:1433–9.
9. Al Himyari FA, Abbas FN. Stress hyperglycemia in nondia-betic Iraqi patients presenting with acute stroke.Endocr Pract 2007;13:691–2.
10. Allport LE, Butcher KS, Baird TA, Macgregor L, Desmond PM, Tress BM,et al.Insular cortical ischemia is independently associated with acute stress hyperglycemia. Stroke2004;35:1886–91.
11. Christensen H, Boysen G, Johannesen HH. Serum-cortisol reflects severity and mortality in acute stroke. J Neurol Sci 2004;217:175–80.
12. O’Neill PA, Davies I, Fullerton KJ, Bennett D. Stress hormone and blood glucose response following acute stroke in the elderly.Stroke1991;22:842–7.
13. Lam KS, Ma JT, Woo E, Lam C, Yu YL. High prevalence of undiagnosed diabetes among Chinese patients with ischaemic stroke. Diab Res Clin Pract1991; 14:133–7.
14. Kernan WN, Viscoli CM, Inzucchi SE, Brass LM, Bravata DM, Shulman GI,et al.Prevalence of abnormal glucose tolerance following a transient ischemic attack or ischemic stroke. Arch Intern Med2005;165:227–33.
15. Gray CS, Scott JF, French JM, Alberti KGMM, O’Connell JE. Prevalence and prediction of unrecognised diabetes mellitus and impaired glucose tolrance following acute stroke. Age Ageing2004;33:71–7.
at National Guard Health Affairs (NGHA) on February 4, 2013
http://qjmed.oxfordjournals.org/
16. Vancheri F, Curcio M, Burgio A, Salvaggio S, Gruttadauria G, Lunetta MC,et al.Impaired glucose metabolism in patients with acute stroke and no previous diagnosis of diabetes mel-litus.QJM2005;98:871–8.
17. Candelise L, Landi G, Orazio EN, Boccardi E. Prognostic significance of hyperglycemia in acute stroke.Arch Neurol 1985;42:661–3.
18. Baird TA, Parsons MW, Phanh T, Butcher KS, Desmond PM, Tress BM,et al.Persistent poststroke hyperglycemia is inde-pendently associated with infarct expansion and worse clin-ical outcome.Stroke2003;34:2208–14.
19. Gray CS, Hildreth AJ, Sandercock PA, O’Connell JE, Johnston DE, Cartlidge NE,et al.Glucose-potassium-insulin infusions in the management of post-stroke hyperglycaemia: the UK Glucose Insulin in Stroke Trial (GIST-UK). Lancet Neurol2007;6:397–406.
20. Stroke—1989. Recommendations on stroke prevention, diag-nosis, and therapy. Report of the WHO Task Force on Stroke and other Cerebrovascular Disorders. Stroke 1989; 20:1407–1431.
21. Bonora E, Targher G, Alberiche M, Bonadonna RC, Saggiani F, Zenere MB,et al.Homeostasis model assessment closely mirrors the glucose clamp technique in the sssess-ment of insulin sensitivity – studies in subjects with various degrees of glucose tolerance and insulin sensitivity. Diab Care2000;23:57–63.
22. American Diabetes Association. Diagnosis and classification of diabetes.Diab Care2008;31:s62–7.
23. World Health Organization. Definition, Diagnosis and Classification of Diabetes Mellitus. Part I. Diagnosis and Classification of Diabetes Mellitus. Geneva, WHO, 1999.
24. Myers MG, Norris JW, Hachniski VC, Sole MJ. Plasma nor-epinephrine in stroke.Stroke1981;12:200–4.
25. Yudkin JS, Alberti KG, Mclarty DG, Swai AB. Impaired glu-cose tolerance.BMJ1990;301:397–402.
26. Be´meur C, Ste-Marie L, Montgomery J. Increased oxidative stress during hyperglycemic cerebral ischemia.Neurochem Int2007;50:890–904.
27. Murros K, Fogelholm R, Kettunen S, Vuorela AL, Valve J. Blood glucose, glycosylated haemoglobin, and outcome of ischemic brain infarction.J Neurol Sci1992;111:59–64.
28. Woo E, Chan YW, Yu YL, Huang CY. Admission glucose level in relation to mortality and morbidity outcome in 252 stroke patients.Stroke1988;19:185–91.
29. Pulsinelli W, Waldman S, Sigsbee B, Rawlinson D, Scherer P, Plum F. Experimental hyperglycemia and diabetes mellitus worsen stroke outcome. Trans Am Neurol Assoc 1980; 105:21–4.
30. Kagansky N, Levy S, Knobler H. The role of hyperglycemia in acute stroke.Arch Neurol2001;58:1209–12.
31. Gray CS, Scott JF, French JM, Alberti KG, O’Connell JE. Prevalence and prediction of unrecognised diabetes mellitus and impaired glucose tolerance following acute stroke. Age Ageing2004;33:71–7.
at National Guard Health Affairs (NGHA) on February 4, 2013
http://qjmed.oxfordjournals.org/