Produksi Tanaman Pangan
Production of Food Crops
2015
Nomor ISSN/
ISSN Number
: 2088-6993
Nomor Publikasi/
Publication Number
: 05110.1605
Katalog/
Catalog
: 5203014
Ukuran Buku/
Book Size
: 21 Cm x 29,7 Cm
Jumlah Halaman/Total Pages: xvi
ii
+ 1
55
halaman/pages
Naskah/
Manuscript
:
Subdirektorat StatistikTanaman Pangan
Subdirectorate of Food Crops Statistics
Gambar Kulit/
Cover Design
:
Subdirektorat StatistikTanaman Pangan
Subdirectorate of Food Crops Statistics
Diterbitkan oleh/Published by:
© Badan Pusat Statistik -
BPS-Statistics Indonesia
Dicetak oleh -
Printed by
:
CV. Tapasuma Ratu Agung
...
Dilarang mengumumkan, mendistribusikan, mengomunikasikan, dan/atau
menggandakan sebagian atau seluruh isi buku ini untuk tujuan komersial
tanpa izin tertulis dari Badan Pusat Statistik
Prohibited to announce, distribute, communicate, and/or copy part or all of this
book for commercial purposes without permission from BPS-Statistics Indonesia
Tim PenyuSun/
Compiler Team
Pengarah/
Advisor
: Hermanto, S.Si, MM
Penyunting/
Editor: Hermanto, S.Si, MM
Dr. Kadarmanto, M.A
Penulis/
Writer
: Widyo Pura Buana, S.Si, MMG, MT
Hariyanto, S.ST, M.Si
Iswadi, S.Si, M.NatResEcon
Retno Poerwaningsih, S.ST
Dena Drajat, S.ST, SE, M.Si
Mega Hartini, S.Si
Ratna Rizki Amalia, S.ST
Vita Fitrianingrum, A.Md
Kadir, S.ST
Simon Halomoan Siagian, SE
Ni Gusti Putu Ayu Lestari, S.ST
Octavia Rizky Prasetyo, S.ST
KATA PENGANTAR
Badan Pusat Statistik bekerja sama dengan Direktorat Jenderal Tanaman Pangan,
Kementerian Pertanian, setiap tahun melakukan pengumpulan data produksi tanaman pangan,
yang mencakup produksi padi dan palawija (jagung, kedelai, kacang tanah, kacang hijau, ubi kayu,
dan ubi jalar). Data produksi tanaman pangan ini bersumber dari luas panen yang dilaporkan oleh
Mantri Tani/Kepala Cabang Dinas (KCD) dan data produktivitas per hektar yang dihasilkan dari
survei ubinan yang dilakukan oleh KCD dan Koordinator Statistik Kecamatan (KSK).
Buku publikasi Produksi Tanaman Pangan tahun 2015 ini menyajikan data luas panen,
produktivitas, produksi, dan luas tanam, untuk melengkapi publikasi produksi tanaman pangan
yang diterbitkan 3 kali setahun (ARAM, ASEM dan ATAP). Produksi tanaman pangan merupakan
perkalian antara luas panen dan produktivitas. Data yang disajikan diharapkan dapat memenuhi
kebutuhan para pengguna data produksi tanaman pangan. Saran dan kritik yang membangun
dari pengguna publikasi ini sangat diharapkan untuk penyempurnaan publikasi yang akan datang.
Jakarta, September 2016
KEPALA BADAN PUSAT STATISTIK
REPUBLIK INDONESIA
Dr. Suhariyanto
P R E F A C E
BPS-Statistics Indonesia in cooperation with Directorate General of Food Crops, Ministry
of Agriculture, carries out data collection on food crops which cover paddy and secondary food
crops (maize, soybeans, peanuts, mungbeans, cassavas, and sweet potatoes) annually. Food
crops production data mainly consists of harvested area reported by Agricultural Extention
Services and productivity (yield per hectare), which is obtained through Crop Cutting Survey done
by Agricultural Extention Services and Subdistrict Statistics Coordinators.
This publication refers to the 2015 final figure of food crops production which consist of
harvested area, productivity, production, and planted area. The production is generated by
multiplying between harvested area and productivity. Hopefully, this publication will be a great
help to food crops production data users. Suggestions are greatly appreciated to improve this
publication in the future.
Jakarta, September 2016
BPS-STATISTICS INDONESIA
DAFTAR ISI
C O N T E N T S
Halaman
Page
KATA PENGANTAR/PREFACE
...
iii
DAFTAR ISI/CONTENTS
...
v
DAFTAR GAMBAR/LIST OF FIGURES
...
vi
DAFTAR TABEL/LIST OF TABLES
...
viii
DAFTAR LAMPIRAN/LIST OF APPENDIX
...
xv
I
PENDAHULUAN/INTRODUCTION
...
1
1.1
Dasar Pelaksanaan/
Legal Basis
...
1
1.2
Data yang Dikumpulkan/
Information Collected
...
3
1.3
Konsep dan Definisi/
Concepts and Definitions
...
4
II
METODOLOGI/METHODOLOGY
...
7
2.1
Metode Pengumpulan Data Luas Tanaman
Method of Crops Area Data Collection
...
7
2.2
Metode Pengumpulan Data Produktivitas
Method of Productivity Data Collection
...
9
2.3
Pengolahan Data dan Penghitungan Produksi
Data Processing and Production Computation
...
11
III
PERKEMBANGAN PRODUKSI TANAMAN PANGAN/TREND OF FOOD
CROPS PRODUCTION
...
13
3.1
Produksi Padi/
Production of Paddy
...
13
3.2
Produksi Jagung/
Production of Maize
...
18
3.3
Produksi Kedelai/
Production of Soybeans
...
23
3.4
Produksi Kacang Tanah/
Production of Peanuts ...
28
3.5
Produksi Kacang Hijau/
Production of Mungbeans
...
33
3.6
Produksi Ubi Kayu/
Production of Cassavas
...
38
3.7
Produksi Ubi Jalar/
Production of Sweet Potatoes
...
43
IV
PERBANDINGAN INTERNASIONAL/INTERNATIONAL
COMPARISON
...
...
DAFTAR GAMBAR
LIST OF FIGURE
Gambar
Halaman
Figure
Page
1
Perkembangan Produksi Padi, 2014
–
2015
Trend of Paddy Production, 2014
–
2015 ...
14
2
Peta Sebaran Produksi Padi di Indonesia Tahun 2015
Map of the Distribution of Paddy Production in 2015 ...
17
3
Pola Panen Padi, 2014
–
2015
Paddy Harvesting Pattern, 2014
–
2015
...
18
4
Perkembangan Produksi Jagung, 2014
–
2015
Trend of Maize Production, 2014
–
2015 ...
19
5
Peta Sebaran Produksi Jagung di Indonesia Tahun 2015
Map of the Distribution of Maize Production in 2015
...
22
6
Pola Panen Jagung, 2014
–
2015
Maize Harvesting Pattern, 2014
–
2015
...
23
7
Perkembangan Produksi Kedelai, 2014
–
2015
Trend of Soybeans Production, 2014
–
2015 ...
24
8
Peta Sebaran Produksi Kedelai di Indonesia Tahun 2015
Map of the Distribution of Soybeans Production in 2015
...
27
9
Pola Panen Kedelai, 2014
–
2015
Soybeans Harvesting Pattern, 2014
–
2015
...
28
10
Perkembangan Produksi Kacang Tanah, 2014
–
2015
Trend of Peanuts Production, 2014
–
2015 ...
29
11
Peta Sebaran Produksi Kacang Tanah di Indonesia Tahun 2015
Map of the Distribution of Peanuts Production in 2015
...
32
12
Pola Panen Kacang Tanah, 2014
–
2015
Peanuts Harvesting Pattern, 2014
–
2015
...
33
13
Perkembangan Produksi Kacang Hijau, 2014
–
2015
Trend of Mungbeans Production, 2014
–
2015 ...
34
14
Peta Sebaran Produksi Kacang Hijau di Indonesia Tahun 2015
Map of the Distribution of Mungbeans Production in 2015
...
37
15
Pola Panen Kacang Hijau, 2014
–
2015
16
Perkembangan Produksi Ubi Kayu, 2014
–
2015
Trend of Cassavas Production, 2014
–
2015
...
39
17
Peta Sebaran Produksi Ubi Kayu di Indonesia Tahun 2015
Map of the Distribution of Cassavas Production in 2015
...
42
18
Pola Panen Ubi Kayu, 2014
–
2015
Cassavas Harvesting Pattern, 2014
–
2015
...
43
19
Perkembangan Produksi Ubi Jalar, 2014
–
2015
Trend of Sweet Potatoes Production, 2014
–
2015 ...
44
20
Peta Sebaran Produksi Ubi Jalar di Indonesia Tahun 2015
Map of the Distribution of Sweet Potatoes Production in 2015
...
47
21
Pola Panen Ubi Jalar, 2014
–
2015
Sweet Potatoes Harvesting Pattern, 2014
–
2015
...
48
22
Produktivitas (ku/ha) pada 30 Negara Produsen Padi Terbesar di
Dunia, 2014
Productivity (qu/ha) of the Top 30 Countries in Paddy Production in the
World, 2014 ...
50
23
Produktivitas (ku/ha) pada 30 Negara Produsen Jagung Terbesar di
Dunia, 2014
Productivity (qu/ha) of the Top 30 Countries in Maize Production in the
World, 2014 ...
51
24
Produktivitas (ku/ha) pada 30 Negara Produsen Kedelai Terbesar di
Dunia, 2014
Productivity (qu/ha) of the Top 30 Countries in Soybeans Production in
the World, 2014 ...
52
25
Produktivitas (ku/ha) pada 30 Negara Produsen Kacang Tanah
Terbesar di Dunia, 2014
Productivity (qu/ha) of the Top 30 Countries in Peanuts Production in
the World, 2014 ...
54
26
Produktivitas (ku/ha) pada 30 Negara Produsen Kacang Hijau Terbesar
di Dunia, 2013
Productivity (qu/ha) of the Top 30 Countries in Mungbeans Production
in the World, 2013 ...
55
27
Produktivitas (ku/ha) pada 30 Negara Produsen Ubi Kayu Terbesar di
Dunia, 2014
Productivity (qu/ha) of the Top 30 Countries in Cassavas Production in
the World, 2014 ...
56
28
Produktivitas (ku/ha) pada 30 Negara Produsen Ubi Jalar Terbesar di
Dunia, 2014
Productivity (qu/ha) of the Top 30 Countries in Sweet Potatoes
DAFTAR TABEL
LIST OF TABLE
Tabel
Halaman
Table
Page
1.1
Perkembangan Luas Panen, Produktivitas, dan Produksi Padi Menurut
Wilayah, 2014
–
2015
Trend of
Harvested Area, Productivity, and Production of Paddy by
Region, 2014
–
2015
...
15
1.2
Perkembangan Luas Panen, Produktivitas, dan Produksi Padi Menurut
Subround
, 2014
–
2015
Trend of
Harvested Area, Productivity, and Production of Paddy by
Subround, 2014
–
2015
...
15
1.3
Perkembangan Produksi Padi Menurut Provinsi, 2013-2015
Trend of Paddy production by Province, 2013-2015 ...
16
2.1
Perkembangan Luas Panen, Produktivitas, dan Produksi Jagung
Menurut Wilayah, 2014
–
2015
Trend of
Harvested Area, Productivity, and Production of Maize by
Region, 2014
–
2015
...
20
2.2
Perkembangan Luas Panen, Produktivitas, dan Produksi Jagung
Menurut
Subround
, 2014
–
2015
Trend of
Harvested Area, Productivity, and Production of Maize by
Subround, 2014
–
2015
...
20
2.3
Perkembangan Produksi Jagung Menurut Provinsi, 2013-2015
Trend of Maize Production by Province, 2013-2015
...
21
3.1
Perkembangan Luas Panen, Produktivitas, dan Produksi Kedelai
Menurut Wilayah, 2014
–
2015
Trend of
Harvested Area, Productivity, and Production of Soybeans by
Region, 2014
–
2015
...
25
3.2
Perkembangan Luas Panen, Produktivitas, dan Produksi Kedelai
Menurut
Subround
, 2014
–
2015
Trend of
Harvested Area, Productivity, and Production of Soybeans by
Subround, 2014
–
2015
...
25
3.2
Perkembangan Produksi Kedelai Menurut Provinsi, 2013-2015
Trend of Soybeans Production by Province, 2013-2015
...
26
4.1
Perkembangan Luas Panen, Produktivitas, dan Produksi Kacang Tanah
Menurut Wilayah, 2014
–
2015
Trend of
Harvested Area, Productivity, and Production of Peanuts by
4.2
Perkembangan Luas Panen, Produktivitas, dan Produksi Kacang Tanah
Menurut
Subround
, 2014
–
2015
Trend of
Harvested Area, Productivity, and Production of Peanuts by
Subround, 2014
–
2015
...
30
4.3
Perkembangan Produksi Kacang Tanah Menurut Provinsi, 2013-2015
Trend of Peanuts Production by Province, 2013-2015
...
31
5.1
Perkembangan Luas Panen, Produktivitas, dan Produksi Kacang Hijau
Menurut Wilayah, 2014
–
2015
Trend of Harvested Area, Productivity, and Production of Mungbeans
by Region, 2014
–
2015
...
35
5.2
Perkembangan Luas Panen, Produktivitas, dan Produksi Kacang Hijau
Menurut
Subround
, 2014
–
2015
Trend of Harvested Area, Productivity, and Production of Mungbeans
by Subround, 2014
–
2015
...
35
5.3
Perkembangan Produksi Kacang Hijau Menurut Provinsi, 2013-2015
Trend of Mungbeans Production by Province, 2013-2015 ...
36
6.1
Perkembangan Luas Panen, Produktivitas, dan Produksi Ubi Kayu
Menurut Wilayah, 2014
–
2015
Trend of Harvested Area, Productivity, and Production of Cassavas by
Region, 2014
–
2015
...
40
6.2
Perkembangan Luas Panen, Produktivitas, dan Produksi Ubi Kayu
Menurut
Subround
, 2014
–
2015
Trend of Harvested Area, Productivity, and Production of Cassavas by
Subround, 2014
–
2015
...
40
6.3
Perkembangan Produksi Ubi Kayu Menurut Provinsi, 2013-2015
Trend of Cassavas Production by Province, 2013-2015 ...
41
7.1
Perkembangan Luas Panen, Produktivitas, dan Produksi Ubi Jalar
Menurut Wilayah, 2014
–
2015
Trend of Harvested Area, Productivity, and Production of Sweet
Potatoes by Region, 2014
–
2015
...
45
7.2
Perkembangan Luas Panen, Produktivitas, dan Produksi Ubi Jalar
Menurut
Subround
, 2014
–
2015
Trend of Harvested Area, Productivity, and Production of Sweet
Potatoes by Subround, 2014
–
2015
...
45
7.3
Perkembangan Produksi Ubi Jalar Menurut Provinsi, 2013-2015
Trend of Sweet Potatoes Production by Province, 2013-2015
...
46
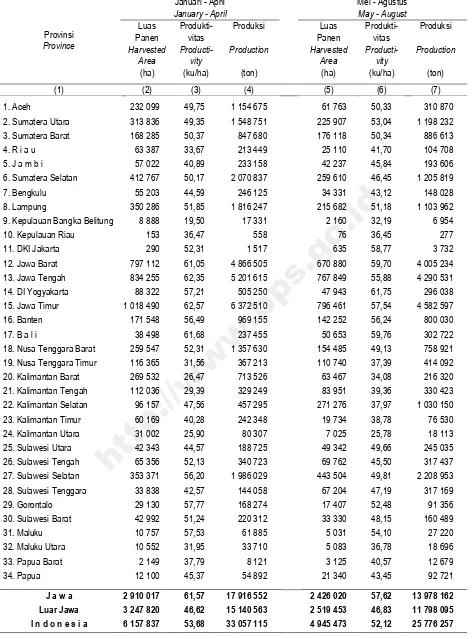
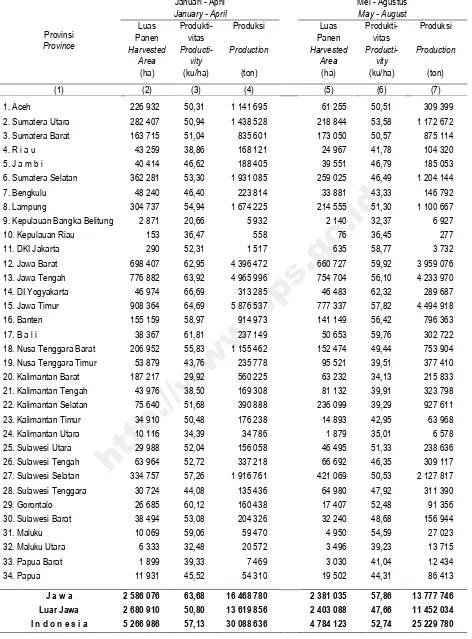
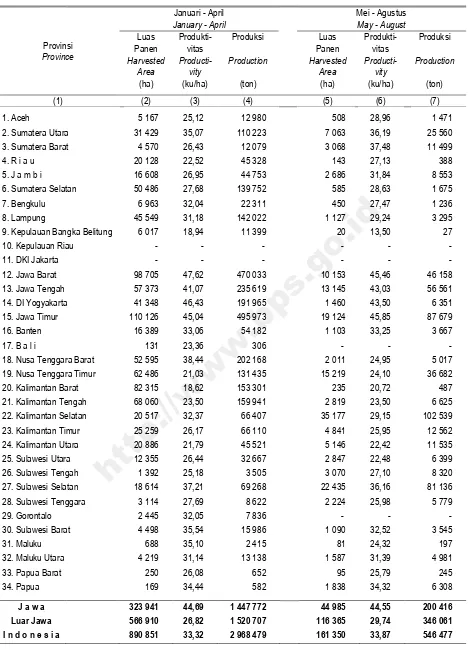
8.1
Luas Panen, Produktivitas, dan Produksi Padi Menurut Provinsi dan
Subround
, 2015
Harvested Area, Productivity, and Production of Paddy by Province and
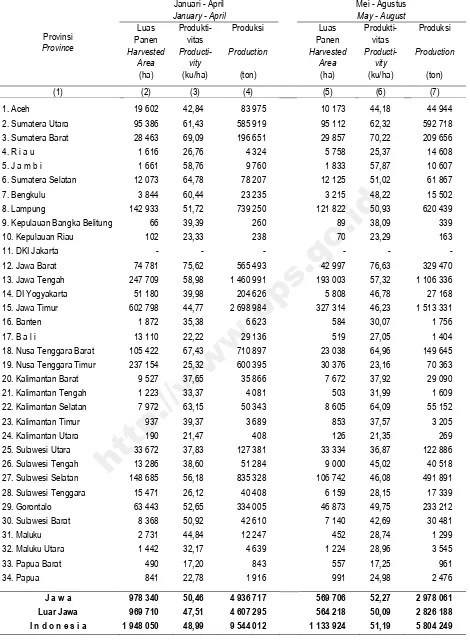
8.2
Luas Panen, Produktivitas, dan Produksi Padi Sawah Menurut Provinsi
dan
Subround
, 2015
Harvested Area, Productivity, and Production of Wetland Paddy by
Province and Subround, 2015
...
62
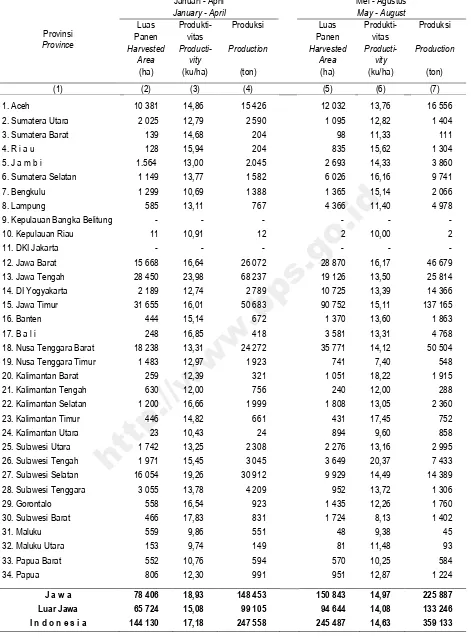
8.3
Luas Panen, Produktivitas, dan Produksi Padi Ladang Menurut Provinsi
dan
Subround
, 2015
Harvested Area, Productivity, and Production of Dryland Paddy by
Province and Subround, 2015
...
64
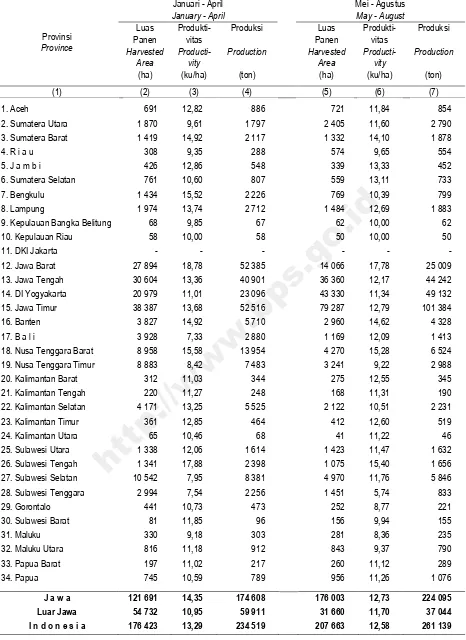
8.4
Luas Panen, Produktivitas, dan Produksi Jagung Menurut Provinsi dan
Subround
, 2015
Harvested Area, Productivity, and Production of Maize by Province and
Subround, 2015
...
66
8.5
Luas Panen, Produktivitas, dan Produksi Kedelai Menurut Provinsi dan
Subround
, 2015
Harvested Area, Productivity, and Production of Soybeans by Province
and Subround, 2015
...
68
8.6
Luas Panen, Produktivitas, dan Produksi Kacang Tanah Menurut
Provinsi dan
Subround
, 2015
Harvested Area, Productivity, and Production of Peanuts by Province
and Subround, 2015
...
70
8.7
Luas Panen, Produktivitas, dan Produksi Kacang Hijau Menurut
Provinsi dan
Subround
, 2015
Harvested Area, Productivity, and Production of Mungbeans by
Province and Subround, 2015
...
72
8.8
Luas Panen, Produktivitas, dan Produksi Ubi Kayu Menurut Provinsi
dan
Subround
, 2015
Harvested Area, Productivity, and Production of Cassava by Province
and Subround, 2015
...
74
8.9
Luas Panen, Produktivitas, dan Produksi Ubi Jalar Menurut Provinsi
dan
Subround
, 2015
Harvested Area, Productivity, and Production of Sweet Potatoes by
Province and Subround, 2015
...
76
9.1
Luas Tanam Padi dan Palawija Menurut Provinsi (hektar), 2015
Planted Area of Paddy and Secondary Food Crops by Province
(hectare), 2015
...
78
9.2
Luas Panen Padi dan Palawija Menurut Provinsi (hektar), 2015
Harvested Area of Paddy and Secondary Food Crops by Province
(hectare),
2015
...
80
10.1
Luas Tanam Padi Menurut Provinsi dan Bulan Tanam (hektar), 2015
10.2
Luas Tanam Padi Sawah Menurut Provinsi dan Bulan Tanam (hektar),
2015
Planted Area of Wetland Paddy by Province and Planting Month
(hectare), 2015
...
84
10.3
Luas Tanam Padi Ladang Menurut Provinsi dan Bulan Tanam (hektar),
2015
Planted Area of Dryland Paddy by Province and Planting Month
(hectare), 2015
...
86
10.4
Luas Tanam Jagung Menurut Provinsi dan Bulan Tanam di Indonesia
(hektar), 2015
Planted Area of Maize by Province and Planting Month
(hectare), 2015
...
88
10.5
Luas Tanam Kedelai Menurut Provinsi dan Bulan Tanam (hektar), 2015
Planted Area of Soybeans by Province and Planting Month
(hectare),
2015
...
90
10.6
Luas Tanam Kacang Tanah Menurut Provinsi dan Bulan Tanam
(hektar), 2015
Planted Area of Peanuts by Province and Planting Month
(hectare),
2015
...
92
10.7
Luas Tanam Kacang Hijau Menurut Provinsi dan Bulan Tanam (hektar),
2015
Planted Area of Mungbeans by Province and Planting Month
(hectare), 2015
...
94
10.8
Luas Tanam Ubi Kayu Menurut Provinsi dan Bulan Tanam (hektar),
2015
Planted Area of Cassavas by Province and Planting Month
(hectare),
2015
...
...
96
10.9
Luas Tanam Ubi Jalar Menurut Provinsi dan Bulan Tanam (hektar),
2015
Planted Area of Sweet Potatoes by Province and Planting Month
(hectare), 2015
...
98
11.1
Luas Panen Padi Menurut Provinsi dan Bulan Panen (hektar), 2015
Harvested Area of Paddy by Province and Harvesting Month
(hectare),
2015
...
100
11.2
Luas Panen Padi Sawah Menurut Provinsi dan Bulan Panen (hektar),
2015
Harvested Area of Wetland Paddy by Province and Harvesting Month
11.3
Luas Panen Padi Ladang Menurut Provinsi dan Bulan Panen (hektar),
2015
Harvested Area of Dryland Paddy by Province and Harvesting Month
(hectare), 2015
...
104
11.4
Luas Panen Jagung Menurut Provinsi dan Bulan Panen (hektar), 2015
Harvested Area of Maize by Province and Harvesting Month
(hectare),
2015
...
106
11.5
Luas Panen Kedelai Menurut Provinsi dan Bulan Panen (hektar), 2015
Harvested Area of Soybeans by Province and Harvesting Month
(hectare), 2015
...
108
11.6
Luas Panen Kacang Tanah Menurut Provinsi dan Bulan Panen (hektar),
2015
Harvested Area of Peanuts by Province and Harvesting Month
(hectare), 2015
...
110
11.7
Luas Panen Kacang Hijau Menurut Provinsi dan Bulan Panen (hektar),
2015
Harvested Area of Mungbeans by Province and Harvesting Month
(hectare), 2015
...
112
11.8
Luas Panen Ubi Kayu Menurut Provinsi dan Bulan Panen (hektar),
2015
Harvested Area of Cassavas by Province and Harvesting Month
(hectare), 2015
...
114
11.9
Luas Panen Ubi Jalar Menurut Provinsi dan Bulan Panen (hektar), 2015
Harvested Area of Sweet Potatoes by Province and Harvesting Month
(hectare), 2015
...
116
12.1
Data Runtun Luas Panen, Produktivitas, dan Produksi Padi Menurut
Subround,
2000−2015
Series Data of Harvested Area, Productivity, and Production of Paddy
by Subround, 2000−2015
...
118
12.2
Data Runtun Luas Panen, Produktivitas, dan Produksi Padi Sawah
Menurut
Subround
, 2000−2015
Series Data of Harvested Area, Productivity, and Production of Wetland
Paddy by
Subround, 2000−2015
...
120
12.3
Data Runtun Luas Panen, Produktivitas, dan Produksi Padi Ladang
Menurut
Subround
, 2000−2015
Series Data of Harvested Area, Productivity, and Production of Dryland
Paddy by Subround, 2000−2015
...
122
12.4
Data Runtun Luas Panen, Produktivitas, dan Produksi Jagung Menurut
Subround
, 2000−2015
12.5
Data Runtun Luas Panen, Produktivitas, dan Produksi Kedelai Menurut
Subround
, 2000−2015
Series Data of Harvested Area, Productivity, and Production of
Soybeans by Subround, 2000−2015
...
126
12.6
Data Runtun Luas Panen, Produktivitas, dan Produksi Kacang Tanah
Menurut
Subround
, 2000−2015
Series Data of Harvested Area, Productivity, and Production of Peanuts
by Subround, 2000−2015
...
128
12.7
Data Runtun Luas Panen, Produktivitas, dan Produksi Kacang Hijau
Menurut
Subround
, 2000-2015
Series Data of Harvested Area, Productivity, and Production of
Mungbeans by Subround, 2000-2015
...
130
12.8
Data Runtun Luas Panen, Produktivitas, dan Produksi Ubi Kayu
Menurut
Subround
, 2000−2015
Series Data of Harvested Area, Productivity, and Production of
Cassavas by
Subround, 2000−2015
...
132
12.9
Data Runtun Luas Panen, Produktivitas, dan Produksi Ubi Jalar
Menurut
Subround
, 2000−2015
Series Data of Harvested Area, Productivity, and Production of Sweet
Potatoes by Subround, 2000−2015
...
134
13.1
Data Luas Panen, Produktivitas, dan Produksi Padi menurut Negara di
Dunia, 2014
Data of Harvested Area, Productivity, and Production of Paddy by
Country, 2014 ...
136
13.2
Data Luas Panen, Produktivitas, dan Produksi Jagung menurut Negara
di Dunia, 2014
Data of Harvested Area, Productivity, and Production of Maize by
Country, 2014 ...
137
13.3
Data Luas Panen, Produktivitas, dan Produksi Kedelai Menurut Negara
di Dunia, 2014
Data of Harvested Area, Productivity, and Production of Soybeans by
Country, 2014 ...
138
13.4
Data Luas Panen, Produktivitas, dan Produksi Kacang Tanah Menurut
Negara di Dunia, 2014
Data of Harvested Area, Productivity, and Production of Peanuts by
Country, 2014 ...
139
13.5
Data Luas Panen, Produktivitas, dan Produksi Kacang Hijau Menurut
Negara di Dunia, 2014
Data of Harvested Area, Productivity, and Production of Mungbeans by
Country, 2014 ...
140
13.6
Data Luas Panen, Produktivitas, dan Produksi Ubi Kayu Menurut
Negara di Dunia, 2014
Data of Harvested Area, Productivity, and Production of Cassavas by
Country, 2014 ...
141
13.7
Data Luas Panen, Produktivitas, dan Produksi Ubi Jalar Menurut
Negara di Dunia, 2014
Data of Harvested Area, Productivity, and Production of Sweet
Potatoes by Country, 2014 ...
142
DAFTAR LAMPIRAN
LIST OF APPENDIX
Halaman
Page
1
Daftar SP-PADI
SP-PADI Form
...
144
2
Daftar SP-PALAWIJA
SP-PALAWIJA Form
...
146
3
Daftar SUB-S
SUB-S Form
...
148
1.1.
Dasar Pelaksanaan
Pengumpulan data produksi tanaman
pangan diselenggarakan oleh Badan Pusat
Statistik bekerja sama dengan Direktorat
Jenderal Tanaman Pangan, Kementerian
Pertanian. Dasar pelaksanaan pengumpulan
dan pengolahan data produksi tanaman
pangan adalah:
1.1.
Legal Basis
The food crops production data
collection is carried out by the BPS - Statistics
Indonesia in cooperation with the Directorate
General
of
Food
Crops,
Ministry
of
Agriculture. The survey is based on:
a.
Undang-Undang Nomor 16 Tahun 1997,
tentang Statistik.
a. Statistics Law No.16, 1997.
b. Keputusan Menteri Pertanian Nomor 527
/ Kpts / DP / 11 / 1970 tanggal 9
November 1970.
b. The Agricultural Minister's Decree No. 527
/ Kpts / DP / 11 / 1970, November 9, 1970.
c. Instruksi bersama Direktur Jenderal
Pertanian Tanaman Pangan dan Kepala
Biro
Pusat
Statistik
Nomor
SK
47/DDP/XI/1972 tanggal 20 November
1972.
c. The joint instruction of Directorate General
of Food crops and Director General of the
Central Bureau of Statistics No. SK 47 / DDP
/ XI / 1972, November 20, 1972.
d. Instruksi Menteri Ekonomi, Keuangan
dan
Industri
No.IN/05/MEKUIN/1/73
tanggal 23 Januari 1973.
d. The instruction of the Minister of
Economics, Finance and Industry No. IN /
05 / MEKUIN / 1/73, January 23, 1973.
e. Instruksi Menteri Dalam Negeri Nomor 3
tahun 1973.
e. The instruction of the Minister of Home
Affairs No. 3 of 1973.
PENDAHULUAN
INTRODUCTION
f.
Instruksi bersama Direktur Jenderal
Pertanian Tanaman Pangan dan Kepala
Biro Pusat Statistik
Nomor
tanggal 23 Juni 1975.
f.
The joint instruction of the Director
General of Food Crops and Director
General of the Central Bureau of Statistics
No
June 23, 1975.
g.
Instruksi bersama Direktur Jenderal
Pertanian Tanaman Pangan dan Kepala
Biro Pusat Statistik
Nomor
tanggal 17 Desember 1984.
g.
The joint instruction of the Director
General of Food Crops and Director
General of Central Bureau of Statistics
No
December 17, 1984.
h.
Instruksi bersama Direktur Jenderal
Pertanian Tanaman Pangan dan Kepala
Biro Pusat Statistik
Nomor
tanggal 7 Agustus 1987.
h.
The joint instruction of the Director
General of Food Crops and Director
General of the Central Bureau of Statistic
No
August 7, 1987.
i.
Surat Menteri Sekretaris Negara No.
R-200 / M.Sesneg / 4 /1988 tanggal 26 April
1988.
i.
Decision of the Minister of State Secretary
1.2.
Data yang Dikumpulkan
Data pokok tanaman pangan yang
dikumpulkan adalah luas tanaman (luas
tanam, luas panen, luas puso) dan
produktivitas (hasil per hektar). Sementara
data produksi tanaman pangan merupakan
hasil perkalian antara luas panen dan
produktivitas.
Data
luas
tanaman
dikumpulkan setiap bulan oleh Mantri
Pertanian/Kepala
Cabang
Dinas
(KCD)
menggunakan Daftar PADI dan
SP-PALAWIJA. Pengumpulan data produktivitas
tanaman pangan dilakukan melalui Survei
Ubinan oleh Koordinator Statistik Kecamatan
(KSK) dan KCD dengan menggunakan Daftar
SUB-S. Pengumpulan data produktivitas
dilakukan melalui pengukuran langsung pada
plot ubinan berukuran 2,5 m x 2,5 m
dilakukan pada waktu panen petani. Jenis
daftar yang digunakan dan frekuensi
pengumpulan data tanaman pangan adalah
sebagai berikut:
1.2.
Information Collected
The main food crops data collected
consist of area of crops (planted area,
harvested area, and damaged area) and
productivity (yield per hectare). Food crops
production is generated by harvested area
multiplied by productivity. The crops area
data is collected every month by the
Agricultural Extension Services (called KCD
for Kepala Cabang Dinas) and reported in
Agriculture Statistics Form called SP-PADI
and SP-PALAWIJA. Productivity is collected
through the Crop Cutting Survey using
SUB-S form done by SUB-Sub District SUB-Statistics
Coordinator and the Agricultural Extension
Services. The productivity data collection is
conducted by a direct measurement in 2.5 m
x 2.5 m crop cutting plot at the time when
farmers are harvesting their crops. Type of
form and frequency of food crops data
collection are presented in the following
table:
Laporan luas tanaman padi
Areas of paddy report
SP
–
PALAWIJA
Bulanan
Monthly
Laporan luas tanaman palawija
Areas of secondary food crops report
SUB
–
S
Subround
Keterangan hasil ubinan padi dan palawija
Information of crop cutting of paddy and
secondary food crops
1.3.
Konsep dan Definisi
Konsep dan definisi yang digunakan
dalam pengumpulan data luas tanaman adalah
sebagai berikut:
a.
Padi sawah
adalah padi yang ditanam di
lahan sawah.
Lahan sawah
adalah lahan
pertanian yang berpetak-petak dan dibatasi
oleh pematang (galengan), saluran untuk
menahan/menyalurkan air, yang biasanya
ditanami padi sawah tanpa memperhatikan dari
mana diperolehnya atau status lahan tersebut.
Termasuk di sini lahan yang terdaftar di Pajak
Hasil Bumi, Iuran Pembangunan Daerah, lahan
bengkok, lahan serobotan, lahan rawa yang
ditanami padi dan lahan bekas tanaman
tahunan yang telah dijadikan sawah, baik yang
ditanami padi maupun palawija. Lahan sawah
mencakup irigasi, tadah hujan, rawa pasang
surut, dan rawa lebak.
1.3.
Concepts and Definitions
Concepts and definitions used in the
area of crops data collection are as follows:
a.
Wetland paddy is paddy which is
planted on wet rice field.
Wet rice field is
agricultural land that is separated by plots
and bounded by small dykes to resist/flow
water, where the main crop is usually
wetland paddy without considering the
status of the land. It includes the land that
is registered at land income tax office,
regional
development
retribution,
'bengkok' land, illegal ownership, swamps
for rice cultivation, and annual crops former
land that is planted both paddy dan
secondary crops. Wet rice field covers
irrigated rice fields, rain fed, ebb and flow
swamp, and lowland swamp.
b.
Padi ladang
adalah padi yang ditanam di
lahan bukan sawah.
b.
Dryland paddy
is paddy which is
planted on garden, dry field, or shifting
cultiva-tion.
c.
Luas bersih
adalah luas sawah secara
keseluruhan (luas kotor) dikurangi dengan luas
pematang/galengan dan luas saluran air.
c.
Net area is the whole rice field area
(gross area) deducted by dykes and
waterworks area.
d.
Luas panen berhasil (luas panen)
adalah
luas tanaman yang dipungut hasilnya setelah
tanaman tersebut cukup umur dan hasilnya
paling sedikit 11% dari keadaan normal. Khusus
untuk jagung dan kedelai, luas tanaman yang
d.
Harvested area is area of crop
which is harvested after the crop come of
age. The successful harvest includes plant
which could not be fully harvested (at least
11
percent
of
normal
production).
dipanen adalah yang bertujuan menghasilkan
pipilan kering (jagung) dan biji kering (kedelai).
harvested area is area that produces dry
loose (maize) and dry shelled (soybeans).
e.
Luas panen muda
adalah luas tanaman
yang dipungut hasilnya dengan tujuan tidak
menghasilkan pipilan kering (jagung) atau biji
kering (kedelai). Sedangkan khusus untuk
tanaman
baby corn
tidak tercakup dalam
pengumpulan data tanaman pangan.
e.
Harvested area of unripe crops is
area of crop that is harvested not in form of
dry loose (maize) and dry shelled
(soybeans). Baby corn, is not included in
food crops data collection.
f.
Luas panen untuk hijauan pakan ternak
adalah luas tanaman jagung yang dipungut
hasilnya dalam bentuk daun, batang dan buah
(seluruh bagian tanaman) dengan tujuan
digunakan untuk pakan ternak.
f.
Harvested area for livestock fodder
is area where plant is harvested in form of
leaves, stalk, and fruit (entire part of plant)
with purpose for livestock fodder.
g.
Luas tanam
adalah luas tanaman yang
betul-betul ditanam (sebagai tanaman baru)
pada bulan laporan, baik penanaman yang
bersifat normal maupun penanaman yang
dilakukan untuk mengganti tanaman yang
dibabat/dimusnahkan karena terserang OPT
atau sebab-sebab lain.
g.
Planted area is area of real new
crop planted in the reporting month,
either to start normal cultivation or to
substitute damaged plant (replanting) due
to pest attack or other causes, including
area for new plants that are demolished in
the same month.
h.
Bentuk Produksi
Bentuk produksi tanaman pangan yang
disajikan dalam publikasi ini adalah sebagai
berikut:
h.
Form of Production
Forms of production presented in
this publication are as follows:
1. Paddy :Dry unhusked paddy
7. Sweet Potatoes :Fresh roots sweet
Potatoes
Pengumpulan data luas tanaman dan
data produktivitas (Survei Ubinan) dilakukan di
seluruh wilayah Republik Indonesia.
2.1.
Metode
Pengumpulan
Data
Luas
Tanaman
Pengumpulan data luas tanaman dengan
menggunakan Daftar SP-PADI dan SP-PALAWIJA
dilakukan secara lengkap melalui pendekatan
area di seluruh kecamatan. Data luas tanaman
padi dan palawija diperoleh dengan cara
penaksiran sebagai berikut:
Area of crops and productivity data
collection (Crop Cutting Survey) are carried
out in all region of the Republic of
conducted
in
complete
enumeration
through area approach in all sub districts.
Pada
desa/kelurahan
yang
sudah
mempunyai pengairan teknis, sawah dalam
desa/kelurahan tersebut biasanya dibagi dalam
beberapa blok pengairan, kemudian tanggal
penanaman ditentukan untuk setiap blok
pengairan. Berdasarkan volume air yang
dialirkan, dapat diperkirakan luas tanamannya.
Misalnya sawah Desa A mempunyai 3 blok
pengairan. Volume air yang tersedia dalam desa
tersebut bisa mengairi sawah 3 hektar dalam
waktu 1 minggu. Untuk menggarap sawah blok
1 diperlukan pengairan selama 2 minggu,
a.
Using irrigation block system
In a village which has technical
irrigation, wet rice field is divided into some
irrigation blocks, and the planting date
then is determined for each irrigation block.
Based on the water volume, the crops area
can be estimated. For example, wet rice
field has 3 irrigation blocks. It has been
known water volume available in the
village can water 3 hectares of rice field in
a week. It has also been known that it needs
2 weeks to water block 1, 3 weeks to water
block 2, and 1 week to water block 3. From
METODOLOGI
METHODOLOGY
untuk blok 2 diperlukan pengairan selama 3
minggu dan untuk blok 3 diperlukan pengairan
selama 1 minggu. Dari informasi di atas dapat
diperkirakan luas tanaman yang ada di sawah
Desa A secara keseluruhan: 2 x 3 hektar + 3 x
3 hektar + 1 x 3 hektar = 18 hektar.
b.
Laporan petani kepada Kepala Desa/Lurah
the above information, it can be estimated
that area of crops in the village is: 2 X 3
hectares + 3 X 3 hectares + 1 X 3 hectares =
18 hectares.
b.
Farmers reports to head of village
Petani biasanya melaporkan luas tanaman
kepada Kelompok/Kontak Tani lebih dahulu,
selanjutnya Kelompok/Kontak Tani melaporkan
kepada Kepala Desa/Lurah. Tetapi ada juga
petani yang langsung melaporkan kepada
Kepala
Desa/Lurah
tanpa
melalui
Kelompok/Kontak Tani.
Farmers usually report their area of
crops to farmer group at first, then the
group will report it to the head of village.
However, some farmers sometimes report
their area directly to the head of village.
c.
Banyaknya benih yang digunakan
Berdasarkan
banyaknya
benih
yang
digunakan, petugas akan bisa mengetahui luas
tanaman. Misalnya, untuk satu hektar padi
sawah digunakan benih sebanyak 30 kg gabah
(tergantung pada kebiasaan daerah
masing-masing). Apabila jumlah benih yang digunakan
pada desa/kelurahan tersebut sebanyak 150 kg
gabah, maka perkiraan luas tanaman di desa
tersebut adalah 150/30 x 1 ha = 5 ha.
c.
The seed utilized
Based on the seed utilized, area of
crops can be estimated. For Example, it has
been known that a hectare of wet rice field
needs seed as much as 30 kilograms (
subject to local habits). If the seed utilized
in the village is as much as 150 kilograms,
the estimated area of wet rice field in the
village is 150/30 x 1 hectare = 5 hectares
d.
Eye estimate
(pandangan mata)
berdasarkan luas baku
Metode
ini
dilakukan
dengan
cara
perkiraan
berdasarkan
pencatatan
yang
dilakukan oleh pegawai / petugas desa /
kelurahan, dengan syarat bahwa luas baku
lahan telah diketahui terlebih dahulu dan yang
d.
Eye estimate, based on the real
area
This method is done by utilizing the
village official records. This method must
be done by an expert and the real area of
the field has already been known.
Penjelasan:
1)
Tanaman yang diperhitungkan luas tanamannya
adalah
tanaman
yang
jarak
tanamnya
maksimum 3 kali jarak tanam normal.
2)
Tanaman yang ditanam di galengan/pematang
apabila hanya ditanam satu baris saja, maka luas
tanamannya tidak dilaporkan.
3)
Dalam menaksir luas tanaman campuran tidak
diperkirakan berapa bagian yang ditanami
tanaman yang lain, tetapi
menurut luas bidang
yang ditanami dengan catatan jarak tanamnya
maksimum 3 kali jarak tanam normal. Bila jarak
tanam (jarak melintang dan membujur) lebih
dari 3 kali dari jarak tanam normal, maka luas
tanaman tersebut tidak perlu dilaporkan.
Notes:
1)
The crop whose area is being estimated is
planted with space amongst crops not
more than 3 times of normal space.
2)
The area of crops that is planted on one row
of small dykes/bund is not counted.
3)
Area of mix crops estimation is conducted
without considering of the area of
accompanying crop.The estimation only
considers the area of the whole field with
planting space not more than 3 times of
normal planting space. If planting space (lie
athwart and lie alongside) is more than 3
times of normal planting space, the area is
not counted.
e.
Sumber informasi lain
Sumber
informasi
lain
yang
dapat
digunakan sebagai dasar atau rujukan dalam
memperoleh data luas, antara lain Penyuluh
Pertanian Lapangan (PPL), Petugas Pengawas
Benih, dan lain-lain.
e.
Other information sources
Other information sources that can be
used as a base or reference in obtaining
area data are Agricultural Supervisor, Seed
Supervisor, etc.
2.2.
Metode
Pengumpulan
Data
Produktivitas
Pengumpulan data produktivitas tanaman
pangan dilakukan secara sampel melalui Survei
Ubinan dengan pendekatan rumah tangga.
Pengumpulan data produktivitas dilakukan
dengan metode pengukuran langsung pada plot
ubinan terpilih.
2.2.
Method
of
Productivity
Data
Collection
Food crops productivity data is
collected
using
household
approach
through the Crop Cutting Survey. The
productivity
is
estimated
by
direct
measurement in the selected crop cutting
plot.
a.
Kerangka sampel
Kerangka sampel yang digunakan dalam
Survei Ubinan adalah kerangka sampel untuk
penarikan sampel desa/kelurahan, kerangka
sampel blok sensus (daftar Blok sensus hasil
Sensus Penduduk 2010 (SP 2010)), dan
kerangka sampel untuk penarikan sampel
rumah tangga yang berisi daftar nama kepala
rumah tangga hasil pemutakhiran rumah
tangga yang dilengkapi dengan informasi
perkiraan bulan panen.
a.
Sampling frame
Sampling frame used in Crop Cutting
Survey consists of sampling frame for
village samples selection, sampling frame
for census block (census block list from the
2010 Population Census ), and sampling
frame for household samples selection that
consists of household head name and
information about the estimated harvest
month resulting from the household
updating.
b.
Rancangan penarikan sampel
Rancangan penarikan sampel yang
digunakan adalah rancangan penarikan sampel
five stage sampling design.
Tahap pertama
, dari kerangka sampel desa
dipilih sejumlah desa secara
PPS (Probability
Proposional to Size) dengan
size banyaknya
petani tanaman pangan.
Tahap kedua
, dari setiap desa/kelurahan
terpilih, dipilih 1 (satu) blok sensus secara
PPS
dengan
size jumlah petani tanaman pangan.
Pada setiap blok sensus terpilih dilakukan
pemutakhiran rumah tangga.
Tahap ketiga,
berdasarkan hasil pemutakhiran
rumah tangga, dipilih rumah tangga yang akan
panen
pada
subround
tertentu
secara
sistematik.
Tahap keempat,
dari setiap rumahtangga
terpilih, dipilih satu petak secara acak untuk
dilakukan ubinan.
b.
Sampling design
Sampling design used is five stage
sampling design.
First stage
, from village sampling frame
several villages are proportionally choosen
(Probability Proposional to Size) with the
number of food crops farmer as the size.
Second stage
, in each selected village, a
census block is proportionally selected by
using the number of food crops farmer as
the size. In every selected census block, the
household updating is then conducted.
Third stage,
based on the household
updating, several households that will
harvest on the designated subround are
systematically drawn.
Fourth stage,
in
every selected household,
one swath is randomly, selected.
Fifth stage,
on selected swath, 2.5 x 2.5 m
2Tahap kelima,
pada petak terpilih, dipilih satu
plot berukuran 2,5 x 2,5 m
2untuk dilakukan
pengukuran
produktivitas
(ubinan)
dan
pengumpulan data lainnya yang berkaitan
dengan produktivitas. Khusus untuk tanaman
padi sawah dan jagung strata kelompok
varietasnya adalah hibrida dan inbrida.
and collecting other information relating to
productivity. For wetland paddy and maize,
strata are constructed based on varieties
such as hibrida and inbrida.
2.3.
Pengolahan Data dan Penghitungan
Produksi
a.
Luas panen
Luas panen tingkat kabupaten/kota
merupakan penjumlahan luas panen tingkat
kecamatan. Luas panen tingkat provinsi
merupakan
rekapitulasi
angka
tingkat
kabupaten/kota. Demikian juga luas panen
tingkat nasional merupakan penjumlahan luas
panen seluruh provinsi.
2.3.
Data Processing and Production
Computation
a.
Harvested area
Harvested area at district level is the
summation of all harvested area at sub
district level. Harvested area at province
level is aggregated figures from districts
figures. Likewise, the national level figures
is the aggregation of province level figures.
b.
Produktivitas
Penghitungan
produktivitas
tingkat
provinsi dilakukan sebagai berikut:
b.
Productivity
Productivity at province level is
calculated as follows:
k
Y
=
Rata-rata produktivitas pada provinsi ke-k
Average of productivity in the k
th- province
Y
ki=
Produktivitas hasil ubinan ke-i pada provinsi ke-k
Productivity of the i
thcutting plot in the k
th- province
n
k=
Banyaknya ubinan pada provinsi ke-k
c.
Produksi
Produksi tingkat provinsi adalah hasil
perkalian
luas
panen
(bersih)
dengan
produktivitas. Sementara itu, untuk produksi
tingkat nasional merupakan penjumlahan
produksi seluruh provinsi.
c.
Production
Province level production is obtained
by
multiplying
harvested
area
and
productivity. Meanwhile, production at
national level is the summation of all
production at province level.
Produksi padi tahun 2015 mengalami
peningkatan
sebesar
6,42
persen
dibandingkan dengan produksi tahun 2014.
Demikian juga untuk produksi jagung, kedelai,
dan kacang hijau meningkat masing-masing
sebesar 3,18 persen; 0,86 persen; dan 10,99
persen. Sedangkan produksi kacang tanah, ubi
kayu, dan ubi jalar tahun 2015 mengalami
penurunan masing-masing sebesar 5,24
persen; 6,98 persen; dan 3,57 persen.
In
2015,
production
of
paddy
increased by 6.42
percent compared to the
2014 production. Similarly the production of
maize, soybeans, and mungbeans increase by
3.18 percent; 0.86 percent; and 10.99
percent, respectively. Meanwhile production
of peanuts, cassavas, and sweet potatoes in
2015 decreased by 5.24 percent; 6.98
percent; and 3.57 percent, respectively.
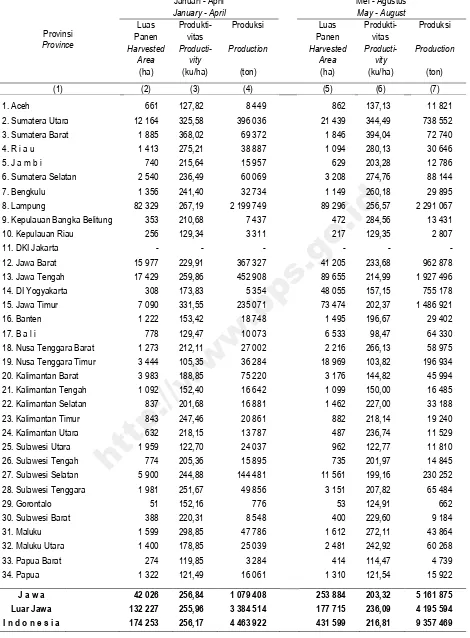
3.1.
Produksi Padi
Produksi padi tahun 2015 sebesar
75,40 juta ton gabah kering giling (GKG),
mengalami peningkatan sebesar 4,55 juta ton
(6,42 persen) dibandingkan tahun 2014.
Kenaikan produksi padi terjadi di Pulau Jawa
sebanyak 2,31 juta ton dan di luar Pulau Jawa
sebanyak 2,24 juta ton. Kenaikan produksi
terjadi karena adanya kenaikan luas panen
seluas 0,32 juta hektar (2,31 persen) dan
produktivitas sebesar 2,06 kuintal/hektar
(4,01 persen).
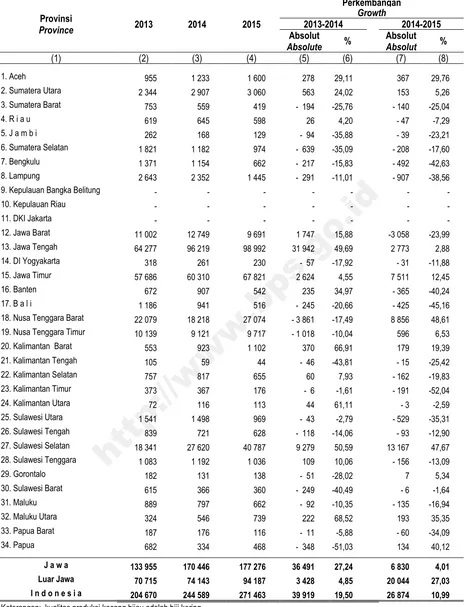
Kenaikan produksi padi tahun 2015 yang
relatif besar terdapat di Provinsi Jawa Tengah,
Jawa Timur, Sumatera Selatan, Aceh, dan
Sumatera Utara (Tabel 1.3).
3.1.
Production of Paddy
In 2015, paddy production was 75.40
million tons of dry unhusked paddy, 4.55
million tons (6.42 percent) increase from the
2014 production. The increase occurred in
2.06 quintal per hectare (4.01 percent).
The relatively large increase of paddy
production occurred in some provinces such
as Jawa Tengah, Jawa Timur, Sumatera
Selatan, Aceh, and Sumatera Utara (Table
1.3).
PERKEMBANGAN PRODUKSI TANAMAN PANGAN
TREND OF FOOD CROPS PRODUCTION
Gambar
1.
Perkembangan Produksi Padi, 2014
–
2015
Figure
Trend of Paddy Production, 2014
–
2015
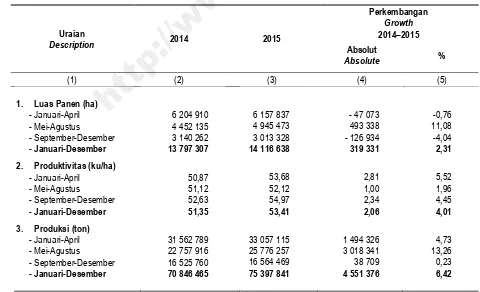
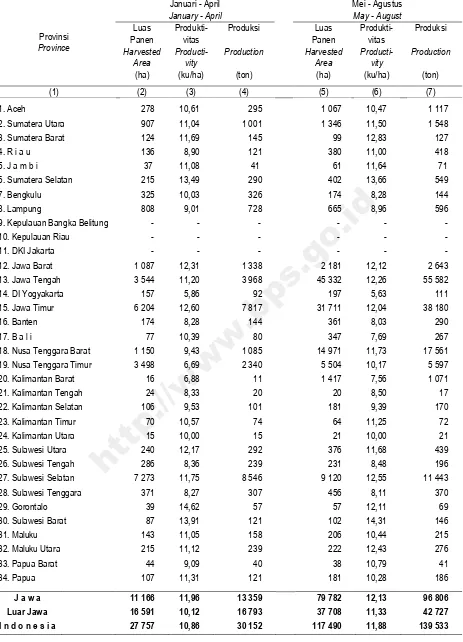
Kenaikan produksi padi tahun 2015
sebanyak 4,55 juta ton (6,42 persen) terjadi
pada
subround Januari
–
April, Mei
–
Agustus,
dan September
–
Desember masing-masing
sebanyak 1,49 juta ton (4,73 persen); 3,02 juta
ton (13,26 persen); dan 0,04 juta ton (0,23
persen), dibandingkan dengan produksi pada
subround
yang sama tahun 2014
(year-on-year).
The increasing paddy production of
4.55 million tons (6.42 percent) in 2015
occurred in every subround, namely January
–
April May-August, and September-December
by 1.49 million tons (4.73 percent); 3.02
million tons (13.26 percent); and 0.04 million
tons (0.23 percent), respectively, compared
to the production in the same subround in
Tabel
1.1
Perkembangan Luas Panen, Produktivitas, dan Produksi Padi Menurut Wilayah, 2014–2015 Table Trend of Harvested Area, Productivity, and Production of Paddy by Region, 2014–2015
Uraian
Description 2014 2015
Perkembangan
2. Produktivitas (ku/ha) Productivity (qu/ha)
Keterangan : bentuk produksi padi adalah Gabah Kering Giling (GKG) Note : the paddy production form is dry unhusked paddy
Tabel
1.2
Perkembangan Luas Panen, Produktivitas, dan Produksi Padi Menurut Subround, 2014–2015
Table Trend of Harvested Area, Productivity, and Production of Paddy by Subround,2014–2015
Uraian
Description 2014 2015
Perkembangan
2. Produktivitas (ku/ha) Productivity (qu/ha)
Keterangan : bentuk produksi padi adalah Gabah Kering Giling (GKG) Note : the paddy production form is dry unhusked paddy
Tabel
1.3. Perkembangan Produksi Padi Menurut Provinsi, 2013-2015
Table Trend of Paddy Production by Province, 2013-2015
Provinsi Keterangan: kualitas produksi padi adalah Gabah Kering Giling (GKG)
Note : the paddy production form is dry unhusked paddy