Full Terms & Conditions of access and use can be found at
http://www.tandfonline.com/action/journalInformation?journalCode=cbie20
Bulletin of Indonesian Economic Studies
ISSN: 0007-4918 (Print) 1472-7234 (Online) Journal homepage: http://www.tandfonline.com/loi/cbie20
Indonesia's Trade and Price Interventions: Pro-Java
and Pro-Urban
Jorge García García
To cite this article:
Jorge García García (2000) Indonesia's Trade and Price Interventions:
Pro-Java and Pro-Urban, Bulletin of Indonesian Economic Studies, 36:3, 93-112
To link to this article:
http://dx.doi.org/10.1080/00074910012331338993
Published online: 18 Aug 2006.
Submit your article to this journal
Article views: 69
View related articles
INDONESIA’S TRADE AND PRICE
INTERVENTIONS: PRO-JAVA AND PRO-URBAN
Jorge García García
*
The World Bank, Washington DC
In 1987 and 1995 Indonesia’s price and trade policies (intervention regime) increased the income of Java’s urban centres and reduced that of people living in rural Java and the other islands. This happened because the regime protected manufacturing activities, most of them located in Jakarta, Bandung and Surabaya, and taxed primary sector based activities, located outside urban Java. It protected some primary sector based activities directly, but the entire intervention regime, with manufacturing protection included, taxed them. As a result, regions deriving income from primary sector based activities lost. Indonesia’s intervention regime is regressive: it transfers income from poorer to richer regions. This regime and its effects on regional incomes continue. Governments have designed programs to raise the income of Eastern Indonesia, but have omitted the most effective instrument: opening the economy to international competition. A serious attempt to reduce regional income disparities should begin by eliminating barriers to international trade.
INTRODUCTION
94 Jorge García García
have grown faster, and regional income inequalities could have fallen faster, if the country had adopted a more open trade regime, and if the government had not controlled the price and trade of selected products from the primary sector (agriculture, forestry, fishing and mining). This paper looks at how trade and price policies (the ‘intervention regime’) affected regional incomes.
In what follows I show that the intervention regime has favoured Java and taxed the non-Java provinces. This has occurred because provinces have different factor endowments, and productive activities have enjoyed different rates of protection. Java has a large labour/land ratio and produces most of Indonesia’s manufacturing output, while the Outer Islands—Sumatra, Kalimantan and Eastern Indonesia (Nusa Tenggara, Sulawesi, Maluku and Irian Jaya)—have a small labour/land ratio and a large natural resource endowment (land, forest, fisheries, mining, oil and gas), and produce most of the country’s output from natural resources. Interventions have protected manufacturing 10 times as much as they have protected agriculture and forestry, and have taxed the oil, gas and mining sectors. The intervention regime has thus favoured urban over rural people, manufacturing over activities in the primary sector, and Java over Bali, Sumatra and Eastern Indonesia. The taxation of the Eastern Indonesian provinces is more striking, because they have the lowest per capita income and the highest incidence of poverty in the country.
From a regional perspective, Indonesia’s intervention regime is regressive: it transfers income from the poorer to the richer regions. The intervention regime has caused losses to the Outer Islands and held back their development relative to what it could have been. Although Java has gained at the expense of the Outer Islands it has lost, in a way, relative to its potential. Java, and Indonesia, could have grown faster had there been a more open trade regime. The farmers and rural workers of Java could have been better off, and so could the people in the Outer Islands, had there been fewer interventions in price and trade.
for regions to produce tradable commodities, and offers conclusions based on the results. The term ‘region’ is used in this paper to refer not to provinces but to islands (e.g. Java) and island groups (e.g. Nusa Tenggara).
THE DISTRIBUTION AND LOCATION OF PRODUCTION
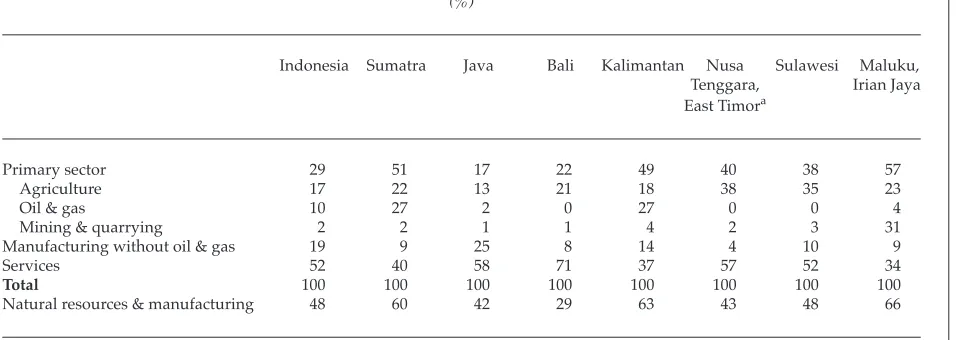
Natural resources constitute an important source of income and employment in Indonesia. Activities directly related to the primary sector generate about 30% of the country’s GDP (table 1), 50% or more of the GRDP (Gross Regional Domestic Product) of Sumatra, Kalimantan, Irian Jaya (sometimes referred to in post-Soeharto Indonesia as Papua) and Maluku, and about 40% of the GRDP of Sulawesi and Nusa Tenggara. Only in Java and Bali does the primary sector generate less than 25% of GRDP. Most of Indonesia’s modern industries and infrastructure are concentrated in three metropolitan–industrial areas in Java (Greater Jakarta, Bandung and Greater Surabaya).1 The manufacturing sector of
West Java, Jakarta and East Java produces about 60% of the non-oil and gas manufacturing GDP of Indonesia. I emphasise the origin of output from the primary sector because it has implications for analysing the structure of incentives and the regional distribution of income, as the next sections will show.
TRADE AND PRICE INTERVENTIONS AND REGIONAL INCOMES: A SIMPLE MODEL
In this section I look at how interventions in the markets for agricultural and non-agricultural goods affect the incentives to produce and the distribution of income among regions. First, I explain briefly what the direct and indirect interventions are. Second, I examine how these interventions affect the incentives to produce between natural resource based activities and manufacturing, in Indonesia and by region. Third, I look at how interventions affect the distribution of income between urban and rural people and among islands.
96
Jo
rg
e G
ar
cía G
ar
cía
TABLE 1 Share of Sectors in Regions’ Average Real GDP, 1993–95 (%)
Indonesia Sumatra Java Bali Kalimantan Nusa Sulawesi Maluku, Tenggara, Irian Jaya East Timora
Primary sector 29 51 17 22 49 40 38 57
Agriculture 17 22 13 21 18 38 35 23
Oil & gas 10 27 2 0 27 0 0 4
Mining & quarrying 2 2 1 1 4 2 3 31
Manufacturing without oil & gas 19 9 25 8 14 4 10 9
Services 52 40 58 71 37 57 52 34
Total 100 100 100 100 100 100 100 100
Natural resources & manufacturing 48 60 42 29 63 43 48 66
aIn 1987 and 1995, for which Fane and Phillips and Fane and Condon estimated rates of protection, and in 1997, when this paper was
written, the Indonesian government set the trade and price policy regime for East Timor, which de facto was a province of Indonesia at that time.
and oranges), and subsidies to inputs (fertilisers and irrigation water). Import tariffs and quantitative import restrictions have applied to manufacturing products. Prohibitions to export wood and logs have applied to the forestry sector. Pertamina (the state-owned oil company) has had the monopoly over the oil and gas market. Other interventions enforced by the central, regional and local governments have also affected the incentives to produce across sectors and regions, but their impact has tended to be lower than those listed above.2 The collection of price
and trade interventions is referred to in this paper as the ‘intervention regime’, and the net effect of this regime on the price of a commodity (or the output of a sector or a region) determines its total impact on the income of factors of production in an activity or a region. The paper thus measures the impact of the intervention regime on the value added (income of factors of production—land, labour and capital) of regions, and establishes in which regions value added has increased and decreased because of the interventions.
Interventions to stimulate the production of certain goods have dif-ferential impacts across regions on the incentives to produce. Thus, I need a number that summarises the effect of interventions on the net income of the region. That number is the net rate of protection to tradable activi-ties, which I calculate as a weighted average of the rates of effective pro-tection (ERP: the percentage change in factor income) to manufacturing and primary sector activities for each region. The weights are the shares of manufacturing (α) and primary sector activities (1 – α) in the region’s tradable GDP. The effective rate of protection to value added in region J,
vJ, is defined as
vJ =αvMJ +(1−α)vPSJ (1),
where M represents manufacturing and PS the primary sector.
The net effective rate of protection to value added in region J relative to value added in region K is
If vJ/K > 0, region J gains from the interventions and, obviously, region
98 Jorge García García
NET RATES OF PROTECTION AND THE PRO-URBAN BIAS OF THE INTERVENTION REGIME
In this section I discuss first how the intervention regime has affected the structure of protection across activities in Indonesia. For this exercise I use the estimates of effective rates of protection from Fane and Phillips (1991) for 1987 and from Fane and Condon (1996) for 1995.3 Fane and
Phillips estimated rates of protection for 138 sectors in 1987, and Fane and Condon estimated rates of protection for 131 sectors in 1995. To compare the evolution of protection and its effects on incentives and income distribution between 1987 and 1995, I grouped the information for 138 sectors from Fane and Phillips into the 131 sectors of Fane and Condon. The weights for grouping the sectors are the share of each sector’s value added in the group’s value added at free trade prices. Table 2 presents the effective rates of protection in 1987 and 1995 for each group. The results set out in table 2 show the government’s overwhelming promotion of the industrial sector. Although agricultural policies sought to promote agricultural activities, they fell far behind the protection to manufacturing. Government policies taxed the oil, gas and mining sectors. Interventions thus discriminated against primary sector activities and in favour of manufacturing. Under this structure of protection it can hardly be argued that incentives in the economy favoured the agricultural sector, let alone the oil and mining sectors. In favouring manufacturing over agriculture, the intervention regime also advantaged the urban sector
TABLE 2 Effective Rates of Protection by Main Sector, 1987 and 1995 (%)
1987 1995
Agriculture 4 –4
Oil & gas –11 –6
Mining & quarrying –27 –8
Manufacturing 110 5
over the rural. However, discrimination against primary sector activities was reduced between 1987 and 1995, largely because the effective rate of protection for manufacturing fell from 110% in 1987 to 5% in 1995.
Despite its economic transformation, Indonesia continues to be a largely agrarian society, and a large part of its population still derives its income from agricultural activities.4 For this reason, it is important to
know how the reduction in discrimination affected the different activi-ties within agriculture; in particular, it would be interesting to know whether the intervention regime discriminated against labour-intensive activities in 1995 as much as it did in 1987. To answer this question, I calculated the net rate of taxation of agriculture and its subsectors rela-tive to manufacturing. The net tax on agriculture (and its subsectors) is defined as
where vArepresents the effective rate of protection of agriculture and vM
represents the effective rate of protection of manufacturing. Table 3 presents the net rates of protection for agriculture and its subcomponents. The first row shows a sharp decline in the taxation of agriculture, from 50% in 1987 to 9% in 1995, although the taxation still exists. Thus, rural people continue losing, but much less in 1995 than they did in 1987. Table 3 also shows that interventions taxed all agricultural activities in
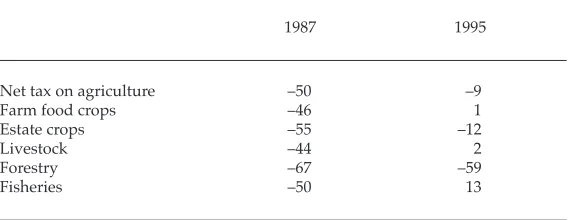
TABLE 3 The Urban Bias of the Intervention Regime: Net Rates of Taxation of Agricultural Activities Relative to Manufacturing, 1987 and 1995
(%)
1987 1995
Net tax on agriculture –50 –9
Farm food crops –46 1
Estate crops –55 –12
Livestock –44 2
Forestry –67 –59
Fisheries –50 13
100 Jorge García García
1987, but provided a small to moderate protection of food crops, livestock and fisheries in 1995 (1%, 2% and 13% respectively), while continuing to tax forestry and estate crops (59% and 12% respectively). Because the bulk of people employed in agriculture work in farm food crops and estate crops, and the taxation of these subsectors fell substantially during the period 1987–95, it can be said that the bias of the intervention regime against rural people has declined sharply.
PROTECTION AND INCOME DISTRIBUTION BY REGION
This section discusses how the intervention regime affected regional rates of protection and the distribution of income by region. The results show that the intervention regime increased the income of Java and reduced that of the other islands. This may seem obvious to those who know Indonesia well but, to my knowledge, these are the first results that show how much the intervention regime affects the pattern of regional incomes. I hope that these results will encourage others to do more detailed studies of how policies for external and domestic trade influence the pattern of regional incomes and the incentives to produce across regions. I first explain how I calculated rates of protection for regions and then identify the winners and losers from the intervention regime and the extent of their gains and losses.
Calculating Regional Rates of Protection
To calculate the impact of the national intervention regime on regional
incomes and on the rates of protection (incentives to produce) in the
regions, I proceeded in two steps. First, I calculated rates of protection by national accounts sector in each region. Second, I used the calculated rates of protection for the sectors in each region to calculate that region’s rate of protection.
Rates of Protection by National Accounts Sector. I calculated these rates using data from Fane and Condon (1996),5 who had calculated rates of
manufacturing, quarrying and non-oil mining). I grouped the manufacturing of oil and gas in the primary sector because I wanted to separate activities based on natural resources from those that did not depend on them. The manufacturing sector of the national accounts stands alone as manufacturing.6
After mapping sectors of the input–output table into sectors of the national accounts, I began calculating the effective rate of protection for the manufacturing category and for each component of the primary sector category. The effective rate of protection for the primary sector category is a weighted average of the rates for mining, agriculture, and oil and gas. In turn, the rate for each of mining, agriculture, and oil and gas is a weighted average of the rates for the subsectors in the national accounts that constitute each of them (appendix 1); the weight is the share of each component of mining, agriculture, and oil and gas in their value added at international prices from the 1990 input–output table. The rate of protection for the five subgroups of agriculture, and for oil, gas, mining and quarrying, is a weighted average of the rates of protection for each of their members, the weights being the share of their value added in total value added at international prices.
Regional Rates of Protection. I calculated the regional rate of protection for the primary sector category as a weighted average of the national rates of protection of the nine sectors that make up the category, the weights being the share of each sector in the GDP of the region. I calculated the regional rate of protection for manufacturing as follows. First, I mapped the sectors of the input–output table into sectors of the International Standard Industrial Classification (ISIC) at the three-digit level. Second, I calculated national rates of protection for ISIC sectors as a weighted average of the rates of protection for their input–output components, the weight being the share of value added of the sector in the input–output table in the value added of its respective ISIC sector. Value added is measured at 1990 international prices. Third, I calculated the regional rate of protection for manufacturing as a weighted average of the ISIC national
102
Jo
rg
e G
ar
cía G
ar
cía
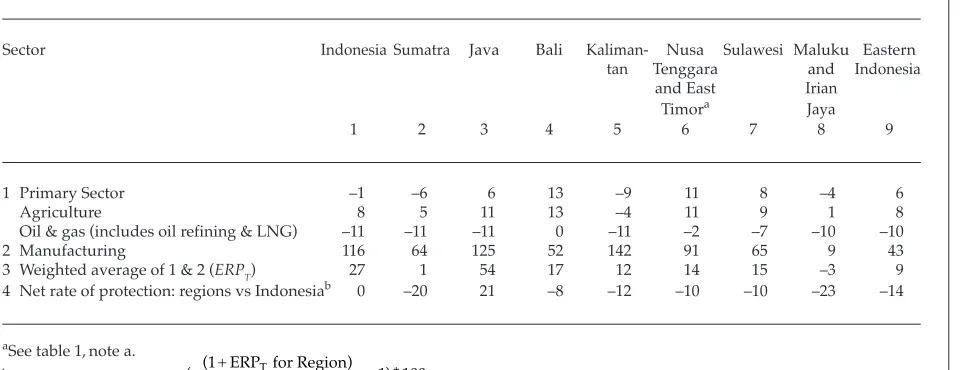
TABLE 4 Effective Rates of Protection and Net Impact of Interventions on Regional Income, 1987 (%)
Sector Indonesia Sumatra Java Bali Kaliman- Nusa Sulawesi Maluku Eastern
tan Tenggara and Indonesia
and East Irian
Timora Jaya
1 2 3 4 5 6 7 8 9
1 Primary Sector –1 –6 6 13 –9 11 8 –4 6
Agriculture 8 5 11 13 –4 11 9 1 8
Oil & gas (includes oil refining & LNG) –11 –11 –11 0 –11 –2 –7 –10 –10
2 Manufacturing 116 64 125 52 142 91 65 9 43
3 Weighted average of 1 & 2 (ERPT) 27 1 54 17 12 14 15 –3 9
4 Net rate of protection: regions vs Indonesiab 0 –20 21 –8 –12 –10 –10 –23 –14
aSee table 1,note a.
bNet Rate of Protection =
( (1+ ERP for Region) ) *
(1+ ERP for Indonesia)
T
T
Winners and Losers from the Intervention Regime
This section presents estimates of rates of protection by region, and of the effect of this protection on the real income of regions; it discusses how changes in the rates of protection altered the regional distribution of income between 1987 and 1995. Tables 4 and 5 present the rates of protection and the change in regions’ value added in 1987 and 1995 respectively. Rows 1–3 of each table show the rates of protection for the primary sector, manufacturing and the two sectors combined. Row 4 shows by how much the intervention regime artificially increased (+) or reduced (–) the real value added of each region relative to the value added in the primary and manufacturing sectors of Indonesia. The numbers in rows 1, 2 and 4 of tables 4 and 5 show that interventions benefited Java relative to the other islands, that they protected manufacturing about 15 times as much as they protected agriculture, and that they taxed the oil, gas and mining sectors. The intervention regime thus favoured manufacturing over primary sector activities, urban people over rural people, and Java over Sumatra, Bali, Kalimantan and Eastern Indonesia. I first discuss the results for 1987 (table 4), then examine the evolution of incentives and the distribution of income between 1987 and 1995, and look at the pro-urban bias of the intervention regime.
Interventions and Income Distribution in 1987. Table 4 shows the effective rates of protection for the primary and manufacturing sectors of Indonesia and of each region. Column 1 shows the rates for Indonesia, and columns 2–8 summarise the results by region. The data in column 1 show that interventions taxed Indonesia’s primary sector at 1% and protected (subsidised) the manufacturing sector by 116%. The two sectors combined received a rate of protection of 27%. Within the primary sector the rates of protection differed substantially: interventions protected agriculture by 8% and taxed oil, gas and mining by 11%. Interventions protected agriculture in all regions but Kalimantan, and taxed oil and gas production in all regions (Bali neither produces nor refines oil).
104
Jo
rg
e G
ar
cía G
ar
cía
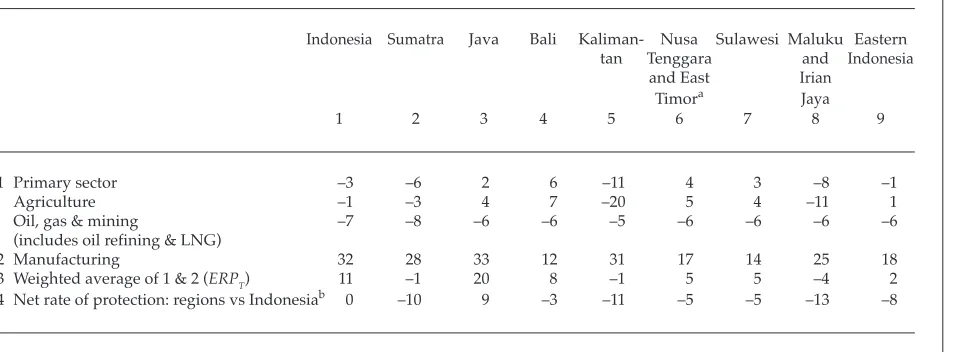
TABLE 5 Effective Rates of Protection and Net Impact of Interventions on Regional Income, 1995a
(%)
Indonesia Sumatra Java Bali Kaliman- Nusa Sulawesi Maluku Eastern tan Tenggara and Indonesia
and East Irian
Timora Jaya
1 2 3 4 5 6 7 8 9
1 Primary sector –3 –6 2 6 –11 4 3 –8 –1
Agriculture –1 –3 4 7 –20 5 4 –11 1
Oil, gas & mining –7 –8 –6 –6 –5 –6 –6 –6 –6
(includes oil refining & LNG)
2 Manufacturing 32 28 33 12 31 17 14 25 18
3 Weighted average of 1 & 2 (ERPT) 11 –1 20 8 –1 5 5 –4 2
4 Net rate of protection: regions vs Indonesiab 0 –10 9 –3 –11 –5 –5 –13 –8
aSee table 1,note a.
sectors of Java by 20%, Bali by 8%, and Sulawesi, Nusa Tenggara and East Timor by 5%, and taxed them in Kalimantan and Sumatra by 1% and in Maluku and Irian Jaya by 4%.
The reforms in the trade regime reduced the incentives to produce in Java relative to the other regions. Compare, for example, Java and Sumatra: in 1987 interventions reduced value added in Sumatra by 20%, while they increased it in Java by 21%. In 1995 interventions reduced value added in Sumatra by 9%, while they only increased it in Java by 9%. Similar results hold for the other regions. But despite the improved conditions for producers in the manufacturing and primary sectors outside Java, the intervention regime continued taxing value added in these sectors in regions other than Java. These regions would be better off in the absence of interventions.
Eastern Indonesia. The government has stated its desire to develop Eastern Indonesia, and many ideas have been proposed to achieve that objective. What is interesting to note in this context is that analysts have ignored the impact of the intervention regime on the regional distribution of income (Jones and Raharjo 1995; Sondakh 1996). The previous paragraphs and the results in tables 4 and 5 show how the intervention regime reduced the income of the islands outside Java and Bali. It thus seems reasonable to suggest that the government could help promote the development of Eastern Indonesia by removing the onerous taxes on this region imposed through the intervention regime. In 1987 the intervention regime taxed value added in the primary and manufacturing sectors of Eastern Indonesia by 14%. As the government reduced interventions between 1987 and 1995 by liberalising the trade regime, it reduced the tax on the region’s value added to 8%. From a regional perspective, the intervention regime acts like a Robin Hood in reverse: it takes income away from the poor and gives it to the rich.
106
Jo
rg
e G
ar
cía G
ar
cía
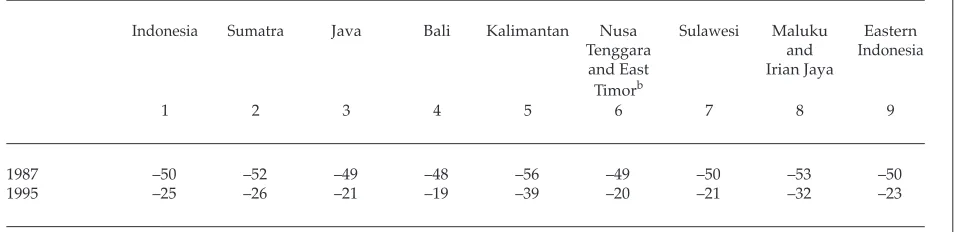
TABLE 6 The Urban Bias of the Intervention Regime: Net Rate of Protection to Agriculture Relative to Manufacturing, 1987 and 1995a
(%)
Indonesia Sumatra Java Bali Kalimantan Nusa Sulawesi Maluku Eastern
Tenggara and Indonesia
and East Irian Jaya
Timorb
1 2 3 4 5 6 7 8 9
1987 –50 –52 –49 –48 –56 –49 –50 –53 –50
1995 –25 –26 –21 –19 –39 –20 –21 –32 –23
aNet Rate of Protection to Agriculture =
(( )
( ) ) *
1
1 1 100
+
+ −
v v A
M , where vA and vM represent the effective rates of protection to agriculture and manufacturing.
of agricultural value added in 1987 and 1995 by region. The numbers in rows 1 and 2 show that the intervention regime taxed agricultural value added in Indonesia and all its regions.7 In 1987 it taxed value added in
Indonesian agriculture by 50%, while by region the rates of taxation varied between 56% in Kalimantan and 48% in Bali; the intervention regime taxed agriculture in Eastern Indonesia by 50%.
The reforms of the trade and price policy regime between 1987 and 1995 reduced the discrimination against non-urban areas, with the net tax rate on Indonesian agriculture falling to 25%. Although taxation fell, tax rates of 25% on agricultural value added are high, and distort relative prices in a significant manner. Protection of manufacturing caused the high taxation of agriculture (compare lines 1 and 3 of tables 4 and 5); even ‘low’ rates of manufacturing protection, like the 32% calculated for 1995, can reduce the incentives to produce in the non-urban sector. The government has expressed interest in improving the welfare of people in rural areas and has programs that aim to do this, but some of its actions, like the protection of manufacturing, achieve the opposite effect, thereby nullifying the effects of specific interventions to favour the agricultural sector. Thus, a policy aimed at improving living conditions in rural areas must be looked at in conjunction with policies that protect activities in urban areas. A clean way to start reducing the discrimination against the rural sector would be to reduce the protection to manufacturing activities, most of them located in the three large urban centres of Java: Jakarta, Bandung and Surabaya.
Further Issues for Analysis
108 Jorge García García
attempted to eliminate part of this problem by estimating rates of protection for manufacturing by region, I have not covered the various distortions in agricultural markets at the regional level. Future research on the area of trade distortions should consider the different incentives and taxes to activities and products that prevail in each region. In many instances, the differences in incentives result from regulations that provincial and local governments impose (Pomeroy 1997; Quizon et al.
1997; García García 1997).
CONCLUSION
This paper has shown that activities in Indonesia’s primary sector lose from the intervention regime. Although in the primary sector policies specific to agriculture tend to protect that sector (see, for example, Erwidodo and Trewin 1996; Gonzales et al. 1993), the interventions in manufacturing offset the effects of these and, as a result, agriculture loses from the interventions as a whole. The paper also identifies the regions that lose and gain from interventions in the agriculture, manufacturing, and oil, gas and mining sectors. The intervention regime has protected the urban sector of Java but taxed Sumatra, Kalimantan, the Eastern Islands, and the rural sector of Java. The protection of manufacturing, located mostly in Java, has taxed activities that produce exportable goods and services and caused income losses for the rest of Indonesia. Although Java has gained, most of the gains have gone to its urban sector, while its rural sector has suffered from discrimination against primary sector activities; the subsidies to rice production and other agriculture based activities have not offset the losses from the implicit tax imposed by the intervention regime. The truth is that indirect interventions have distorted the incentives to produce among activities in Java; rural people and agricultural activities have lost relative to urban people and manufacturing activities.
natural resource based activities can increase their productivity and output, but that potential can best be achieved under agricultural institutions and policies different from those prevailing today. As D. Gale Johnson points out (1997: 11), ‘the major factors that limit the growth of food production in developing countries are knowledge and research, the availability of non-farm inputs at reasonable prices and the governmental policies that affect incentives. If policies provide for the first two and do not discriminate against agriculture in trade and macroeconomic policies farmers will do the rest.’ This applies well to Indonesian farmers and to people in the poorest provinces of Indonesia. If the intervention regime does not discriminate against primary sector based activities, people outside Java and rural people in Java will do what needs to be done to improve their lot.
NOTES
* Revised version of ‘Trade and Price Policies: Incentives or Disincentives for Indonesian Agriculture?’, written while the author was posted in The World Bank’s Jakarta office, and presented at the conference ‘Sustaining Economic Growth in Indonesia: A Framework Towards the Twenty First Century’, held in Jakarta in December 1997. The findings, interpretation and conclusions represent the author’s views, and not necessarily those of the World Bank, its Executive Directors or the countries they represent. I would like to thank George Fane and an anonymous referee for their comments on an earlier version of this paper. George Fane provided the data on valued added by sector from the input–output table which permitted recalculation of my original rates of protection by region.
1 The central statistics agency, BPS (Statistics Indonesia), generates information (but does not publish it) on value added in manufacturing by metropolitan areas. The information can be obtained from the tapes of the industrial surveys. 2 A good account of the regulations affecting productive activities can be found
in World Bank (1994, 1995, 1996, 1997).
3 Wymenga (1990) estimated the structure of protection in Indonesia for 1989. I have omitted these estimates from the discussion because two points in time, 1987 and 1995, suffice for my purposes.
4 I have looked at agriculture only, because it employs about 45% of the labour force; by contrast, mining employs about 1% (World Bank 1997: appendix table 1.3).
110 Jorge García García
6 BPS divides manufacturing into two sectors: oil and gas manufacturing and the rest of manufacturing. In this paper the rest of manufacturing constitutes the manufacturing category. Oil and gas manufacturing is classified in the natural resource based category.
7 This result holds whether agricultural incentives are measured relative to protection for manufacturing in the region or in Indonesia.
REFERENCES
Booth, Anne (1990), ‘The Tourism Boom in Indonesia’, Bulletin of Indonesian Economic Studies 26 (3): 45–73.
Erwidodo and Ray Trewin (1996), ‘The Social Welfare Impact of Indonesian Dairy Policies’, Bulletin of Indonesian Economic Studies 32 (3): 55–85.
Fane, George, and Chris Phillips (1991), ‘Effective Protection in Indonesia in 1987’, Bulletin of Indonesian Economic Studies 27 (1): 105–26.
Fane, George, and Timothy Condon (1996), ‘Trade Reform in Indonesia, 1987–95,’ Bulletin of Indonesian Economic Studies 32 (3): 33–55.
García García, Jorge (1997), Rural Markets and Local Institutions in Indonesia: The Case of the Provinces of Jambi and East Nusa Tenggara, Jakarta (mimeo). García García, Jorge, and Lana Soelistianingsih (1998), ‘Why Do Differences in Provincial Incomes Persist in Indonesia?’, Bulletin of Indonesian Economic Studies 34 (1): 55–93.
Gonzales, Leonardo, Faisal Kasryno, N. Perez and M. Rosegrant (1993), Economic Incentives and Comparative Advantage in Indonesian Food Crop Production, Research Report 93, International Food Policy Research Institute, Washington DC.
Hill, Hal (ed.) (1991), Unity and Diversity: Regional Economic Development in Indonesia since 1970, Oxford University Press, Singapore.
—— (1996), The Indonesian Economy since 1966: Southeast Asia’s Emerging Giant, Cambridge University Press, New York.
Johnson, D. Gale (1997), ‘Agriculture and the Wealth of Nations’, American Economic Review 87 (2): 1–11.
Jones, Gavin, and Yulfita Raharjo (eds) (1995), People, Land and Sea: Development Challenges in Eastern Indonesia, Australian National University, Canberra. Krongkaew, Medhi (1994), ‘Income Distribution in East Asian Countries: An
Update’, Asian-Pacific Economic Literature 8 (2): 58–73.
Pangestu, Mari, and Boediono (1986), ‘Indonesia: The Structure and Causes of Manufacturing Sector Protection’, in Christopher Findlay and Ross Garnaut (eds), The Political Economy of Manufacturing Protection: Experiences of ASEAN and Australia, Allen and Unwin, Sydney.
Pomeroy, J. (1997), Distribution Systems for Selected Commodities: A Summary of Survey Results from Several Provinces, Trade Implementation and Policy Project, USAID, Ministry of Industry and Trade, Jakarta (mimeo).
Quizon, Jaime, Hania Rahma and Nina Toyamah (1997), Regional Regulations and Agricultural Commodity Price Distortions: A Study of Four Indonesian Provinces, The World Bank and Center for Policy and Implementation Studies, Jakarta (mimeo).
Sondakh, Lucky (1996), ‘Agricultural Development in Eastern Indonesia: Performance, Issues and Policy Options’, in Colin Barlow and Joan Hardjono (eds), Indonesia Assessment 1995: Development in Eastern Indonesia, Research School of Pacific and Asian Studies, Australian National University, Canberra, and Institute of South East Asian Studies, Singapore: 141–63.
Spillane, James (1994), Pariwisata Indonesia: Siasat Ekonomi and Rekayasa Kebudayaan, Monografi Lembaga Studi Realino 5, Penerbit Kanisius, Yogyakarta. World Bank (1981), Indonesia: Selected Issues of Industrial Development and Trade
Strategy, Annex 2, The Foreign Trade Regime, Report No. 3182-IND, Washington DC.
—— (1994), Indonesia: Stability, Growth and Equity in Repelita VI, Report No. 12857-IND, 20 July, Washington DC.
—— (1995), Indonesia: Improving Efficiency and Equity: Changes in the Public Sector’s Role, Report No. 14006-IND, 24 July, Washington DC.
—— (1996), Indonesia: Dimensions of Growth, Report No. 15383-IND, 7 May, Washington DC.
—— (1997), Indonesia: Sustaining High Growth with Equity, Report No. 16433-IND, 30 May, Washington DC.
Wymenga, Paul S.J. (1990), The 1989 Structure of Protection in Indonesia, Industry Analysis Project, Centre for Data Processing and Analysis, Ministry of Industry, Working Paper No. 17, January, Jakarta.