Full Terms & Conditions of access and use can be found at
http://www.tandfonline.com/action/journalInformation?journalCode=cbie20
Bulletin of Indonesian Economic Studies
ISSN: 0007-4918 (Print) 1472-7234 (Online) Journal homepage: http://www.tandfonline.com/loi/cbie20
How Not to Industrialise? Indonesia's Automotive
Industry
Haryo Aswicahyono
To cite this article: Haryo Aswicahyono (2000) How Not to Industrialise? Indonesia's
Automotive Industry, Bulletin of Indonesian Economic Studies, 36:1, 209-241, DOI:
10.1080/00074910012331337843
To link to this article: http://dx.doi.org/10.1080/00074910012331337843
Published online: 21 Aug 2006.
Submit your article to this journal
Article views: 219
View related articles
HOW NOT TO INDUSTRIALISE?
INDONESIA’S AUTOMOTIVE INDUSTRY
Haryo Aswicahyono*
Centre for Strategic and International Studies (CSIS), Jakarta
M. Chatib Basri and Hal Hill
Australian National University
This paper examines the development of the Indonesian automotive industry since 1970. After giving an overview of trends and a comparative East Asian assessment, we investigate ownership patterns, the political economy of intervention and key structural features of the industry. Output grew rapidly in the three decades to 1997; there was a significant increase in technological capacity; and some firms in the components and commercial vehicle sectors were approaching international efficiency. However, the highly interventionist policy regime has resulted in an inefficient industry characterised by ‘back-to-front’ industrialisation, uneconomic production runs and minuscule exports. The industry’s fundamental weaknesses were exposed by the crisis of 1997–99. Looking beyond the current difficulties, the future challenge will be to develop a globally efficient and integrated industry.
INTRODUCTION
Aswicahyono, Basri and Hill 210
(principally Japanese) knowhow. One consequence of this intervention is that it has probably attracted more rent seeking activity than any other major manufacturing activity in the country. It has consistently received very high levels of import protection. By the mid 1990s, the Soeharto family and their immediate associates had begun to enter the industry, most conspicuously in the case of the ill-fated national car (mobnas) initiative.
Despite the rapid growth of output from 1967 to 1997, and much improved production capabilities, the industry’s development record has been very disappointing. This is a classic case of an infant industry which has failed to grow up—a bayi yang sudah tua (‘an old baby’), as it is sometimes referred to in Indonesia. High protection and intense regulation have resulted in a fragmented industrial structure in which few if any firms have production runs that approach minimum efficient scale, and an environment where political–bureaucratic connections are the most important arbiter of commercial success. Like the nation’s aircraft industry, this has been another case of ‘back-to-front’ industrialisation, in which assembly activities have been promoted prior to the establishment of a well-developed supplier base. In the process, Indonesia has missed out on the opportunity to become Southeast Asia’s leading automotive nation. That position is now clearly occupied by Thailand, which in the early 1990s was able to switch more quickly from import substitution to export orientation, and to attract large foreign investments in anticipation of a more open ASEAN market for the industry.
There are, of course, some exceptions to this negative assessment of the industry. Some technological learning has undoubtedly taken place behind the industry’s high protective barriers. Indonesia is now quite efficient in the production of commercial vehicles (notably the Toyota Kijang), where a larger market and less model proliferation have resulted in higher productivity. The range and quality of components has increased immeasurably, and some components firms are efficient and export-oriented, a trend that is likely to accelerate post-crisis. The motor cycle industry has been much more successful (Thee 1997): a small number of firms servicing the large domestic market have been able to achieve scale economies and quite high levels of local content, to the point where they are probably internationally competitive.
industry, resulting in the closure and amalgamation of several uneconomic plants. The issue is whether the industry can adapt to these changes and create a new, internationally competitive industry, comprising a small number of assemblers and models, and an efficient supplier base.
Our paper is organised as follows. In the following section we provide an overview of the industry and place the Indonesian industry in comparative East Asian perspective. We then trace the evolution of the industry from the 1970s, examining in particular the interplay between general economic conditions and the industry’s policy environment. Next, there is an examination of the interrelated issues of the policy framework and ownership structures. We investigate the industry’s structure, before assessing future prospects and options in a concluding section.
KEY FEATURES OF THE INDUSTRY
The automotive industry has at least six important characteristics—most of them universally significant.
• It is scale-intensive, particularly in some major manufacturing activities such as chassis and engine construction.
• It is generally technology and capital-intensive, again particularly in certain manufacturing subsectors.
• There is pronounced product differentiation, as illustrated by the importance of brand-name recognition in the industry.
• The industry comprises a diverse collection of interrelated subsectors, of greatly varying technological, capital and scale intensity.
• In consequence especially of the first three factors, the industry is almost completely dominated by multinational corporations (MNCs); globally, it is one of the most highly concentrated industries in the world.
A
swic
ahy
o
no
, B
as
ri and
Hill
212
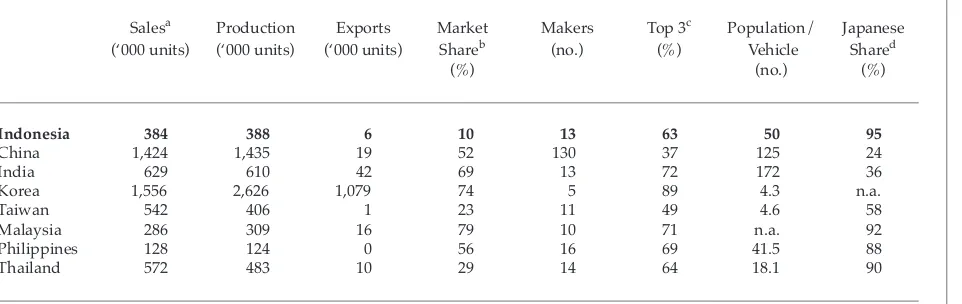
TABLE 1 Comparative Indicators for the Asian Auto Industry, 1995
Salesa Production Exports Market Makers Top 3c Population/ Japanese
(‘000 units) (‘000 units) (‘000 units) Shareb (no.) (%) Vehicle Shared
(%) (no.) (%)
Indonesia 384 388 6 10 13 63 50 95
China 1,424 1,435 19 52 130 37 125 24
India 629 610 42 69 13 72 172 36
Korea 1,556 2,626 1,079 74 5 89 4.3 n.a.
Taiwan 542 406 1 23 11 49 4.6 58
Malaysia 286 309 16 79 10 71 n.a. 92
Philippines 128 124 0 56 16 69 41.5 88
Thailand 572 483 10 29 14 64 18.1 90
aRefers to sales in the domestic market and includes imports.
bRefers to passenger car sales as a percentage of total vehicle sales.
cRefers to the share of production of the three largest assemblers.
dRefers to the share of Japanese manufacturers in the domestic market.
invariably begets more intervention, as the politically well-connected are attracted to the rents on offer.
East Asian experiences with the automotive industry exemplify many of these characteristics, while also drawing attention to the region’s diverse policy regimes and approaches (Abrenica 1998). At least four broad policy models are apparent. One is typified by Japan and South Korea, which have developed their industries behind prohibitive import barriers while actively importing foreign technology, and which at some point were able to achieve international efficiency levels and switch from import substitution to export orientation. A second group of small economies—notably Hong Kong and Singapore—effectively abandoned the industry, although some components sectors remain. A third group— Taiwan, Thailand and Malaysia—has maintained high levels of protection for periods of time, though not at the level of Japan and Korea, and has gradually become more internationally oriented. This is, however, a diverse group of economies, and there are substantial differences among them. For example, Malaysia has become more protectionist for periods, in pursuit of its national car scheme, whereas the other two have been reducing their import barriers. Taiwan has a highly developed, export-oriented components industry, some of which is R&D-intensive. A fourth general policy model includes the very recent liberalisers, countries that consistently adhered to high levels of protection until the late 1990s. Indonesia and the Philippines are the major examples. The diverging fortunes of their automotive industries (until recently) has reflected primarily domestic economic conditions.
Table 1 provides a brief comparative picture of the automotive industry, pre-crisis, in developing Asia.1 Several features of the Indonesian
Aswicahyono, Basri and Hill 214
abroad—is one of the key themes of the industry’s development over the past three decades.
THE DEVELOPMENT OF THE INDUSTRY
The automotive industry is one of Indonesia’s oldest manufacturing activities, dating back to the establishment in 1928 of a General Motors (GM) assembly plant in Tanjung Priok, Jakarta.2 For the next 40 years,
however, the industry experienced little sustained growth, owing to the Great Depression, war, the independence struggle and the uncertain post-independence business climate. There were some attempts to develop the industry as part of the 1950s Benteng industrialisation program, but these were half-hearted and amounted to little. In 1961, for example, it was reported that almost all production activities had ceased, apart from the assembly of government vehicles under various official aid programs. A survey of the 21 assembly firms registered in 1968 found that only six were actually producing vehicles—the others presumably were either dormant or engaged only in trading.
By the late 1960s, as Hansen (1971) shows, the industry was small and technologically primitive. The annual market size was 10,000–15,000 units, far below the level needed to support just one plant of efficient size. The supplier base was extremely limited: there was no international-quality stamping plant, foundries could not meet acceptable international-quality control standards, high-quality steel production was not available, there was no industrial paint work capacity, and very few electronic components were produced locally. Even tyre and battery supplies were erratic.
In 1976, a detailed ‘deletion program’ was introduced under which, for each major group of vehicles, the government began to specify which components had to be produced locally. This initiative quickly intensified (Witoelar 1983). Initially, in 1977, paint, tyres and batteries were targeted. Thereafter, annual targets were drawn up, covering engines and transmissions, brakes, axles and a wide range of components by 1984. In an effort to promote subcontracting arrangements and small–medium enterprises, local sourcing was in addition tied to procurement from unrelated enterprises; that is, for a number of components in-house manufacture was prohibited. Priority was also given to commercial over passenger vehicles, through lower import duties on components and lower sales/value added taxes on final products.3
These targets were generally not met, partly because they were too ambitious, and partly because the recession of the mid 1980s resulted in a sharp decline in domestic demand. But the primary focus on local content was maintained until 1993, when a more market-oriented (but still heavily regulated) incentives approach was adopted.
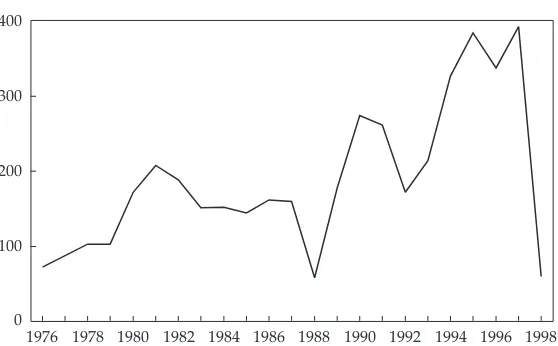
Figure 1 charts the industry’s development from the 1976 policy initiative to the economic crisis of 1998. Until the crisis, output grew
FIGURE 1 Indonesian Automobile Production, 1976–98 (‘000 units)
Source: Gaikindo (Association of Indonesian Automotive Industries).
1976 1978 1980 1982 1984 1986 1988 1990 1992 1994 1996 1998 100
Aswicahyono, Basri and Hill 216
quickly but erratically. Annual fluctuations largely reflected the combined impact of three factors: the business cycle (itself much influenced by international oil prices through to the mid 1980s), the industrial policy regime and domestic credit conditions. From less than 10,000 units in 1970, production grew rapidly to over 70,000 by the time of the 1976 decision, and to over 200,000 in 1981. It then began to taper off from about 1982 in response to softening oil prices and the government’s fiscal austerity measures. These factors precipitated a major slump in the industry in 1986–88. It picked up again quickly between 1989 and 1991 in response to deregulation reforms and accelerating economic growth, slumped back during the early 1990s credit squeeze, but then more than doubled between 1992 and 1995. Until the early 1980s, the government was a major consumer of the industry’s output, both directly and through the state enterprise sector. Many of these cars were subsequently sold to civil servants at heavily discounted prices. Since that time, the private sector has been the primary engine of demand growth.
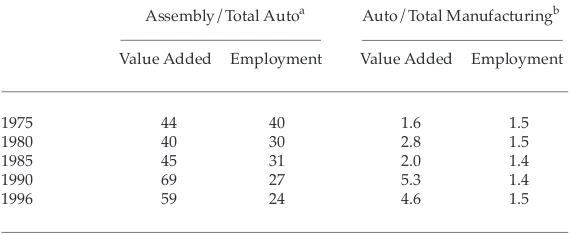
Over the period 1975–96, the industry’s share of manufacturing output (excluding the oil processing industry and firms with fewer than 20 employees) rose from 1.6% to 4.6%. The employment share remained constant at about 1.5%, indicating the industry’s rapidly rising capital intensity. The 1998–99 crisis hit the industry very hard: consumer demand collapsed and, with weak export capacity, output temporarily slumped to mid 1970s levels. This production collapse was quickly transmitted to the components sector. In early 1999, firms with ‘dedicated’ supplier relationships (i.e. supplying only the auto assemblers) were said to be operating at just 10–15% of capacity, in contrast to more diversified producers, including exporters, whose capacity utilisation was around 70%.4 Production began to recover in 1999, albeit to levels still well below
the pre-crisis volume, and exports increased modestly. We return to the latter point below.
It is useful in passing to draw a sharp distinction between the record of the automotive (i.e. 4-wheeler) and motor cycle industries. The latter has developed into an efficient industry, in which ex-factory costs are approximately internationally competitive, and a modest export capacity has developed (Thee 1997). The key difference between the two is that the motor cycle industry does not exhibit extreme and uneconomic market fragmentation: there is a large domestic market for motor cycles; there are just four major producers; and much of the production technology is simpler. Local content programs have been introduced, but it can be argued that these have not pushed the process of backward integration much faster than would have occurred anyway. Viable subcontracting networks have also proliferated. One should not draw the inference that intervention has been more ‘clever’ in this case. Rather, the motor cycle industry’s success has been due largely to fortuitous circumstances—a much larger domestic market base, and fewer international manufacturers.
OWNERSHIP AND INTERVENTION:
THE POLICY REGIME
Ownership
There are two key features of ownership patterns in the automotive industry: foreign, particularly Japanese, ownership; and a small number of local joint venture participants. The former is typical of most developing countries. The particularly high levels of Japanese involvement (the highest share in East Asia, as shown in table 1) reflect the very close commercial relationship between the two countries when major decisions about the industry’s future development were being taken. The second characteristic derives in part from the highly regulated environment, in which the government virtually selected the major domestic business groups who were to participate in the industry.
Aswicahyono, Basri and Hill 218
from 1974 a much more restrictive posture was adopted for assemblers, and for a period no new foreign equity investment in the industry was permitted. Thus, over the ensuing decade of rapid growth, foreign partners in the main were forced to enter the market through licensing and other non-equity arrangements. From the mid 1980s the policy approach again became more liberal and, particularly after the 1994 deregulation package, foreign ownership levels began to rise.5 Entry to
the components sector has generally been less restrictive, and in technologically less demanding segments there are some domestically owned firms that do not have formal tie-ups with foreign firms.6
Table 2 presents estimates of the relative size of foreign firms in the auto industry in the 1990s, including motor cycles for comparison. There are substantial differences among sectors, reflecting the combined interplay of policy and competitive advantage factors. The auto industry generally displays higher foreign ownership levels than motor cycles. This is principally the result of the more liberal 1990s policy regime, coinciding with the entry after 1994 of several firms with foreign equity. Ownership patterns in the motor cycle industry, in spite of its very rapid growth before the crisis, were quite stable: the four to five firms which had dominated the industry from the late 1970s continued to be pre-eminent, and there were no new entrants (apart from a short-lived and
TABLE 2 Foreign Ownership in the Automotive Industry, 1990–96a
(% of relevant industry total)
Firms Value Added Employment
Autos
Assembly 21 68 55
Body manufacture 2 19 6
Components 17 51 26
Motor cycles
Assembly 37 10 35
Components 13 35 35
aThe data refer to unweighted averages. The respective ISIC codes for the five
sectors are 38431, 38432, 38433, 38441 and 38442.
ill-fated attempt just before the crisis to develop a ‘national’ motor cycle, akin to the mobnas). Within autos, foreign firms were more important in assembly and components, and less so in technologically simpler body manufacturing activities. By contrast, these firms’ share of value added in the motor cycles components sector was higher than that of assembly, owing to new entrants into components during a period of more relaxed ownership requirements. Foreign firms are very much larger and more capital-intensive than their domestic counterparts in the auto industry, whereas the differences are not so consistently pronounced in motor cycles.7
This is not the place to examine in any detail the relationship between Indonesian and Japanese partners in the industry. But it is sufficient to note that rapid output growth and high levels of protection placed very little stress on most of these joint ventures, notwithstanding occasional Indonesian complaints about the slow pace of technology transfer, and Japanese frustration with local technical and managerial capabilities. There was really only one major dispute among parties from 1970 until the crisis of 1997.8
A
swic
ahy
o
no
, B
as
ri and
Hill
220
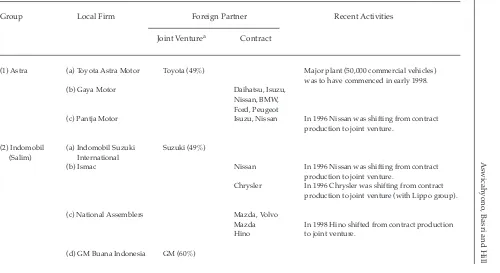
TABLE 3 Major Auto Manufacturers in Indonesia
Group Local Firm Foreign Partner Recent Activities
Joint Venturea Contract
(1) Astra (a) Toyota Astra Motor Toyota (49%) Major plant (50,000 commercial vehicles) was to have commenced in early 1998. (b) Gaya Motor Daihatsu, Isuzu,
Nissan, BMW, Ford, Peugeot
(c) Pantja Motor Isuzu, Nissan In 1996 Nissan was shifting from contract production to joint venture.
(2) Indomobil (a) Indomobil Suzuki Suzuki (49%) (Salim) International
(b) Ismac Nissan In 1996 Nissan was shifting from contract production to joint venture.
Chrysler In 1996 Chrysler was shifting from contract production to joint venture (with Lippo group).
(c) National Assemblers Mazda, Volvo
Mazda In 1998 Hino shifted from contract production Hino to joint venture.
w No
t t
o
I
nd
us
trialis
e?
I
nd
o
nes
ia’
s A
ut
o
m
o
tive I
nd
us
try
221
Group Local Firm Foreign Partner Recent Activities
Joint Venturea Contract
(3) Krama Yudha (a) Krama Yudha Kesuma Mitsubishi Motor
(b) Krama Yudha Ratu Mitsubishi Motor
(4) Imora Prospect Motor Honda
(5) Bimantara (a) German Motor Mercedes Benz (33.5%)
(b) Tricitra Karya Hyundai In 1996 Hyundai was shifting from contract production to joint venture.
(6) Starsauto Starsauto Dinamika Daewoo In 1998 Daewoo shifted from contract produc-tion to joint venture.
(7) Humpus Kia-Timor Motors Kia (35%) Local partner, Timor Putra Nasional, approved as the national car manufacturer.
aFigures in parentheses refer to the foreign partner’s equity stake.
Aswicahyono, Basri and Hill 222
Close high-level bureaucratic connections and a willingness to invest in uneconomic plants behind high protective barriers have been the sine qua non for local firms’ entry into the assembly sector of the industry (see Chalmers 1996). A major player since the late 1960s has been the Astra group, founded by William Soeryadjaya, who has long had close connections to certain military figures and senior officials of the then Ministry of Industry (Chalmers 1996; Sato 1996). The group entered the industry in 1968 when it assumed control of PT Gaya Motor, and it flourished after developing close ties with Toyota in 1969. For much of the New Order period Astra was considered to be one of the more ‘professional’ of Indonesia’s corporations: its ties to the Soeharto family were not strong; its founder was a seventh generation Sino-Indonesian who spoke no Chinese; and the group had demonstrated a commitment to an open management style, including promotion based on merit (irrespective of ethnicity), and to developing local technological capabilities. By the 1970s, foreign firms were vying to establish joint ventures with it, and it was regarded as the best hope for Indonesia to develop an internationally efficient auto industry. These hopes were dashed in 1992 when, in order to bail out son Edward’s Bank Summa, the Soeryadjaya family lost most of its equity stake in Astra. By the mid 1990s the company was effectively run by the Soeharto investment company Nusamba, and Bob Hasan was chairman of the board.
Among the other major players, Ibnu Sutowo, former head of the state-owned oil company Pertamina and long-time confidant of Soeharto, was a key figure in the Krama Yudha group in earlier years, although these ties were severed by the 1980s. Liem Sioe Liong’s Salim group, Indonesia’s largest conglomerate during the Soeharto era, and famous for its palace connections, entered the industry in the 1970s with the production of Suzuki and Volvo, and expanded its interests through the Indomobil group in the 1980s (Sato 1993). The Volkswagen brand was produced by a company owned by an army foundation (Yayasan Kostrad). During the 1990s, the Soeharto children became major players in the industry, with Bimantara taking over the licences for Mercedes Benz and Hyundai, in addition to Tommy Soeharto’s infamous Timor episode.
Protection and Lobbying
to produce negative value added at international prices (see, for example, Gray 1982). There are no recent estimates available, a factor complicated by the presence of non-tariff barriers, some of which are firm-specific in nature. But at least until the crisis-induced trade reforms, we can safely assume that effective protection remained very high, especially for the assemblers.
An official predisposition to intervention, the involvement of powerful political players, and foreign investors content to reap the benefits of a small but highly protected market laid the basis for 25 years of intense regulation. These processes were, moreover, mutually reinforcing: nationalist ambitions to establish an automobile industry were the initial trigger for protection, and the resulting rents attracted politically powerful investors. Thus, both the ‘national interest’ and ‘lobbying’ models of protection are relevant to understanding the nature and extent of industry protection. There was a gradual and partial drift towards liberalisation in the 1990s, but it is testimony to the power of these vested interests that it took a deep economic crisis for major reforms to be instituted.
A number of factors explain the halting steps towards reform during the 1990s. On the one hand, there were pressures for liberalisation from a variety of sources. Domestically, these came from other, by now ‘reformed’, sectors and reform-oriented policy makers (though not, notably, from the Ministry of Industry and Trade). Some key players in the industry recognised the inevitability of reform, and the larger firms felt more confident of their capacity to adjust. The nature of the lobbying processes began to change also, as the close, highly personalistic relationships of the 1970s and early 1980s between firm owners and key officials of the Ministry of Industry and Trade weakened and a new generation of more professional managers began to run the industry. Moreover, the opposition to liberalisation by the foreign (Japanese) principals had diminished by then, as they were promoting various regional integration schemes in the industry. Internationally, there was pressure for reform (or at least the prospect of it) being exerted by the ASEAN Free Trade Area (AFTA) in particular, but also by the Asia Pacific Economic Cooperation (APEC) forum and the World Trade Organisation (WTO), while Thailand’s major liberalisation of the early 1990s set a major competitive challenge.
Aswicahyono, Basri and Hill 224
next few years. A 1995 package attempted to recognise Indonesia’s commitments to AFTA and APEC, by scheduling maximum duties of 40%, 25% and 15% on the import of CBU vehicles, CKD kits and components respectively by 2003.9 However, Indonesia persisted in
placing the industry on its ‘temporary exclusion list’ in AFTA negotiations. Just when it appeared that there were real prospects of significant liberalisation, however, Soeharto family business interests entered the industry in brazen and spectacular fashion. In 1996 the government announced plans to establish a program that would lead to full domestic production of a ‘national car’ (mobil nasional, or mobnas). The program envisaged an accelerated local content target (of 20%, 40% and 60% at the end of the first, second and third years of production) in exchange for ‘pioneer status’ (which entailed full exemption from all import duties and the waiving of the luxury car tax) and financial assistance. Immediately afterwards, the government announced that the youngest son of then President Soeharto, Tommy, was to be solely responsible for implementation of the program, with his (unfortunately named) PT Timor Putra Nasional. The project quickly became mired in controversy, even before the economic crisis and political upheaval killed it. Its foreign partner, Kia of Korea, was on the verge of bankruptcy. Japan, the US and
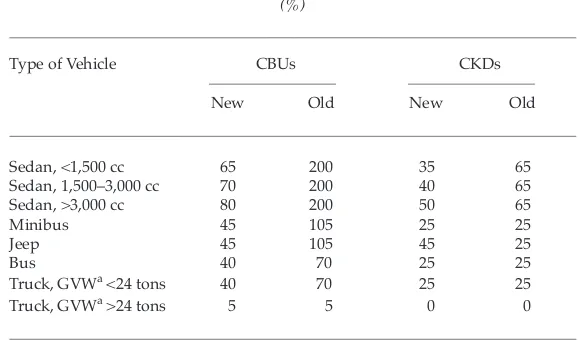
TABLE 4 Tariff Rates under the June 1999 Tariff Reform (%)
Type of Vehicle CBUs CKDs
New Old New Old
Sedan, <1,500 cc 65 200 35 65
Sedan, 1,500–3,000 cc 70 200 40 65
Sedan, >3,000 cc 80 200 50 65
Minibus 45 105 25 25
Jeep 45 105 45 25
Bus 40 70 25 25
Truck, GVWa <24 tons 40 70 25 25
Truck, GVWa >24 tons 5 5 0 0
aGross vehicle weight.
the EU filed complaints with the WTO, which were eventually successful. And, despite very low prices, the Timor’s sales record was disappointing, owing to consumer uncertainty about service and supplies and to political opposition at the blatant display of patronage.
The most recent period has been dominated by the economic crisis, and the subsequent policy response. In particular, as part of the IMF package and political reforms, there is a commitment to rapid liberalisation: the national car program has been abandoned, local content goals have been dropped, non-tariff barriers are being removed, and the dispersion of tariffs is being reduced. The June 1999 tariff reform has resulted in significant reductions in tariff rates for both CKD and CBU imports, across virtually all vehicle categories and sizes (see table 4). Substantial protection remains for the industry, however, and it remains to be seen whether even these modest reforms will be sustained as economic recovery proceeds and the external pressure for reform abates.
STRUCTURE OF THE INDUSTRY
In this section we look in more detail at some major structural and developmental features of the industry.
Major Sectors
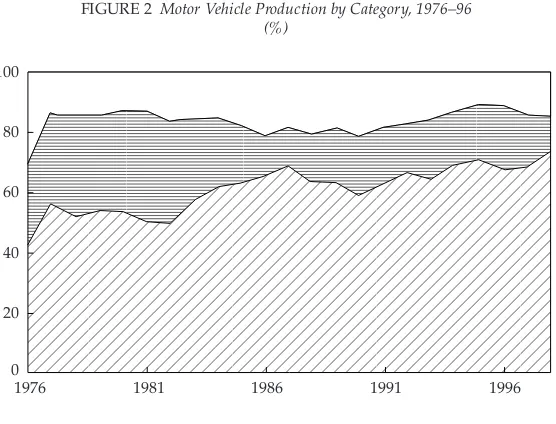
As noted above, the industry comprises three quite distinct sectors: passenger cars, commercial vehicles and components. During the early stage of the industry’s development, in the 1970s and early 1980s, the components sector—mostly replacement parts, of variable quality—was larger than the assembly sector. But during the next decade the latter grew much more quickly as the government’s promotional measures took effect, and by 1990 assembly value added was more than double that of components (table 5). However, in the 1990s this trend was reversed again, as growing industrial competence, rising local content ratios, increasing investment from Japanese producers and modest exports all propelled the components sector.10
Aswicahyono, Basri and Hill 226
Their dominance is not hard to explain: they are cheaper to produce, owing to simple designs and larger production runs; they have received preferential sales tax (and sometimes import duty) treatment; they are able to target both the personal and commercial markets; and they are better suited to Indonesian market conditions, in particular given poor roads and their flexible carrying capacity.
Market Structure
As noted, the Indonesian auto industry is characterised by extreme market fragmentation, especially in passenger car assembly, with the result that no producer is able to exploit scale economies adequately. This fragmentation is the direct result of the government’s regulatory regime, in particular the high levels of protection. Moreover, in spite of the rapid growth in domestic demand through to the crisis, there was no sign of any pronounced consolidation within the industry. While some very small and uneconomic assemblers had closed, the government was also promoting its national car scheme, and in the process attracting still more entrants to the industry.
TABLE 5 Value Added and Employment in the Auto Industry, 1975–96 (%)
Assembly/Total Autoa Auto/Total Manufacturingb
Value Added Employment Value Added Employment
1975 44 40 1.6 1.5
1980 40 30 2.8 1.5
1985 45 31 2.0 1.4
1990 69 27 5.3 1.4
1996 59 24 4.6 1.5
aRefers to the share of the assembly sector in total auto industry value added and
employment.
bRefers to the share of the auto industry in total (non-oil) manufacturing value
added and employment.
A few figures illustrate just how serious the problem is. In 1983, seven years after the beginnings of the systematic import substitution strategy, annual production was about 155,000 units. There were then estimated to be more than 40 assemblers, associated with foreign firms from 12 countries, producing some 50 makes and 140 models (Hill 1984). By the mid 1990s, the situation had improved little in the passenger car sector, where there were 17 makes for a market of about 40,000–50,000 units. The largest firm, Toyota, produced just 8,600 vehicles in 1996, followed by Honda with 6,350 units. Apart from the ill-fated Timor (6,000 units in 1996), all the other firms produced less than 4,000 units; three (Daihatsu, Mazda and Nissan) rolled out 1,000 or less. Moreover, these are aggregate figures: most manufacturers produce more than one model, resulting in still further fragmentation.11
In the commercial vehicle sector, there are not the same ludicrously uneconomic production runs: the market is larger (around 300,000 units annually, pre-crisis), there are fewer producers, and they have fewer models. But the scale is still small by international best-practice standards. Thus, in the major market segment—light commercial vehicles—there
FIGURE 2 Motor Vehicle Production by Category, 1976–96 (%)
Source: Gaikindo.
;;;;; ;;;;; ;;;;;
;;;;; ;;;;;
Sedan Commercial (categories II–V)
Light commercial (category I)
; ; ;
1976 1981 1986 1991 1996
Aswicahyono, Basri and Hill 228
FIGURE 3 Import Intensity of the Automotive Industry, 1981–96
Source: BPS; authors’ calculations.
Imports/(imports + value added) Imports/(imports + gross output) 81 82 83 84 85 86 87 88 89 90 91 92 93 94 95 96 0
30 60 90 120
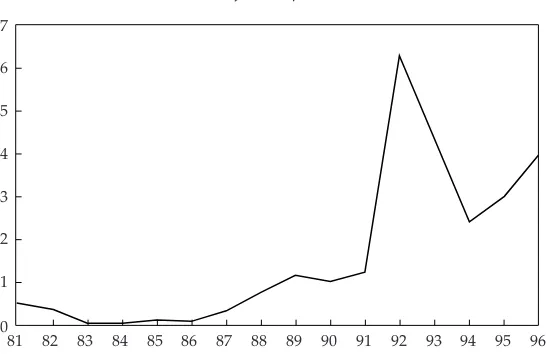
FIGURE 4 Export Share of Vehicles and Components, 1981–96 (% of total exports)
Source: BPS; authors’ calculations. 0
1 2 3 4 5 6 7
were eight assemblers, with the market dominated by Toyota (31% of the total), Suzuki (21%) and Isuzu (19%). Each of these firms produced just one major model (Kijang, Panther and Carry respectively). With production in the mid 1990s of about 80,000, 65,000 and 60,000 units respectively, all three firms were beginning to approach the lower threshold of efficient production. However, higher local content requirements had also pushed them into the manufacture and assembly of components and production stages for which scale economies are more significant.
International Dimensions
Reflecting its industrial infancy, a limited skill base and perverse intervention, the auto industry has always been an import-intensive activity with a very small export base. As noted, in the 1960s and 1970s the industry consisted of little more than assemblers of imported kits and a small, basic components industry. Much of the latter was geared to the repair and replacement markets, and did not meet the assemblers’ quality control requirements. During the 1980s, however, local content ratios began to increase significantly (see next section) and import intensity declined. Exports remained very small.
Figures 3 and 4 and table 6 chart these trends. The import intensity of the automotive industry has been declining steadily (figure 3), while the share of output exported has remained minuscule, rising from less than 1% throughout most of the 1980s to around 4–5% in the 1990s (figure 4). Almost all of the decline in import dependence occurred in the assembly sector (table 6): the share of imports in assemblers’ intermediate inputs fell from 80% to 30% between 1980 and 1995, reflecting the combination of regulatory pressures and opportunities for economic import substitution. However, the share of imports in components manufacture changed very little. Components firms have not been subject to the same direct pressure for local content as the assemblers, and they have shifted over time into technologically more demanding products. During the 1990s, almost 90% of imported components consisted of three product categories: combustion engines and parts, steering equipment, and other parts.
Aswicahyono, Basri and Hill 230
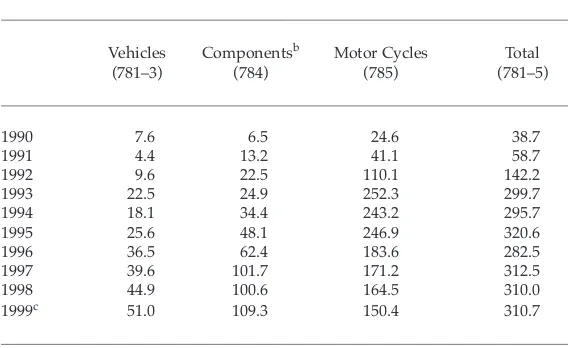
TABLE 7 Automotive Exports by Value, 1990–99a
($ million)
Vehicles Componentsb Motor Cycles Total
(781–3) (784) (785) (781–5)
1990 7.6 6.5 24.6 38.7
1991 4.4 13.2 41.1 58.7
1992 9.6 22.5 110.1 142.2
1993 22.5 24.9 252.3 299.7
1994 18.1 34.4 243.2 295.7
1995 25.6 48.1 246.9 320.6
1996 36.5 62.4 183.6 282.5
1997 39.6 101.7 171.2 312.5
1998 44.9 100.6 164.5 310.0
1999c 51.0 109.3 150.4 310.7
aFigures in parentheses refer to Standard International Trade Classification (SITC)
codes.
bIncludes components for all motorised vehicles. c1999 data are through to September.
Source: BPS, Ekspor, various issues.
TABLE 6 Share of Imports in Total Intermediate Inputs, 1980–95a (%)
Components Assembly
1980 88 81
1985 74 66
1990 82 48
1995 89 30
aImported intermediate inputs as a share of total intermediate inputs.
But this is unlikely to have been a significant factor, as other countries with foreign-dominated industries have recorded much stronger growth, and Indonesia’s more competitive motor cycle industry has also been able to export on a larger scale. Following the onset of the crisis, things are beginning to change, albeit slowly. The collapse in domestic demand and increased competitiveness in the wake of the large rupiah devaluation have pushed firms outwards. Those with a foreign equity presence, a technology licensing agreement or some other international connection have generally done better. The switch to exports will obviously take time but, as table 7 indicates, there is already some supply-side response. Compared to the last pre-crisis year, 1996, in 1999 (and extrapolating from data for the first nine months) vehicle exports had almost doubled, and components had more than doubled. Motor cycles were up marginally, but still below the peak year of 1993.
Encouraging though these figures are, Indonesia is well behind Thailand. Thailand’s exports of cars were estimated to have reached 120,000 units in 1999, a ten-fold increase over 1996. Exports of components are also increasingly rapidly, while several new export-oriented FDI projects are about to come on stream (FEER, 14/10/99). Indonesia’s more restrictive foreign investment regime, its smaller export base, its weaker components sector and its deeper financial and political crises all account for the difference.
Subcontracting, Vertical Linkages and Local Content
Vertical interfirm linkages and subcontracting networks have proliferated in the automotive industry. This is as would be expected—the government’s regulatory provisions have pushed firms in this direction, and there have been ample opportunities for import substitution as the local market has grown and Indonesia’s industrial competence has developed.
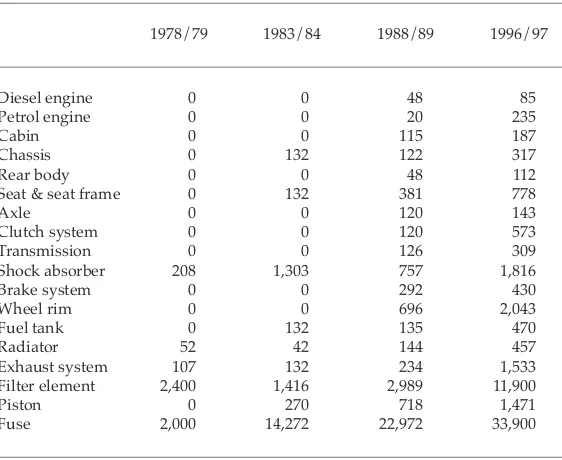
The range of locally produced components has risen dramatically over the past 30 years. By the mid 1990s, local production had extended to many items not produced 20 years ago, including shock absorbers, exhaust systems, filters, pistons, petrol and diesel engines, axles, transmissions, steering systems, safety glass, high-quality forged parts, wiring harnesses and aluminium wheel rims. Table 8 demonstrates these trends.12 Very few components were produced even in the late 1970s. By
Aswicahyono, Basri and Hill 232
This strong growth is reflected in rapidly rising local content ratios. By the mid 1990s these had reached comparatively high levels in some cases, but with significant variations among firms (table 9). Thus the average for sedans was 11%, but one firm exceeded 40%. Owing to their larger production runs and simpler manufacturing processes, light commercial vehicles generally achieved quite high levels, averaging 40%, though with sizeable interfirm variations. The larger the vehicle, the lower the local content, but all commercial vehicles were well above passenger sedans in local content. Motor cycles and scooters were higher still, owing to their much larger production runs and simpler technologies. It should be emphasised, of course, that these local content ratios are generally crudely calculated, and that they are not in any sense a ‘performance indicator’. Indeed, higher ratios may well be associated with greater inefficiency in some cases.
TABLE 8 Production of Selected Components by Quantity, 1978/79 to 1996/97 (‘000)
1978/79 1983/84 1988/89 1996/97
Diesel engine 0 0 48 85
Petrol engine 0 0 20 235
Cabin 0 0 115 187
Chassis 0 132 122 317
Rear body 0 0 48 112
Seat & seat frame 0 132 381 778
Axle 0 0 120 143
Clutch system 0 0 120 573
Transmission 0 0 126 309
Shock absorber 208 1,303 757 1,816
Brake system 0 0 292 430
Wheel rim 0 0 696 2,043
Fuel tank 0 132 135 470
Radiator 52 42 144 457
Exhaust system 107 132 234 1,533
Filter element 2,400 1,416 2,989 11,900
Piston 0 270 718 1,471
Fuse 2,000 14,272 22,972 33,900
The nature of the assembler–supplier relationship has varied greatly. Much of the official thinking in the 1970s envisaged Japanese-style subcontracting networks, characterised by stable, durable and intense ties between the two groups of firms, and in which the assemblers would be the dynamic agents of technology transfer to clusters of small–medium components manufacturers. There are such cases, especially where employees of assembler companies have established their own supplier operation tied exclusively to their former employer. However, such instances are rather rare. The more common pattern is for both parties to engage in opportunistic behaviour: relationships are typically shallow, short term and non-exclusive, quite different from those found in Japan (Sato 1998a: 125 ff).
The reasons for these differences are not difficult to explain. With a highly segmented and small market, supplier firms in Indonesia seeking to achieve scale economies are forced to serve several assemblers.13
Assemblers have tended to eschew long-term relationships with Indonesia’s myriad small-scale producers of low-quality replacement parts, owing to these firms’ high mortality rates and to the difficulties associated with appropriating the returns from investment in their skill base. As noted, foreign investors who are unable to secure majority ownership are reluctant to transfer technology. The government’s industrial extension efforts have also been weak and sporadic. Moreover,
TABLE 9 Local Content Ratios, 1995 (%)
Average Range
Commercial vehicles
I <5 tons 40 5–48
II 5–10 tons 34 23–34
III 10–24 tons 32 29–35
IV >24 tons 20 2–31
Sedans 11 5–42
Motor cycles 68 68
Scooters n.a. 39–49
Aswicahyono, Basri and Hill 234
many of the assemblers themselves possess limited technological capacity, and are therefore not in a position to act as agents of technology transfer. Indeed, in some cases the technology flows operate in the reverse direction, especially where the suppliers are joint ventures with foreign companies. Finally, some argue that Indonesia’s ‘business culture’, with (it is alleged) its emphasis on short-term, opportunistic behaviour, is not well suited to the establishment of longer-term ties. How much this characteristic, if correct, is deep-rooted, and how much it reflects specific features of the business environment during the Soeharto period, is a subject of future research.
Here, too, the government’s policies could hardly be judged successful. Subcontracting relationships will flourish, not by bureaucratic mandate, but rather through market-driven incentives. The policy environment—fragmented markets, high protection, weak industrial extension efforts—has in fact been inimical to the development of such ties.
It is therefore not surprising that presumptive evidence suggests that ‘spillovers’ from foreign to local firms, as indicated by comparative trends in total factor productivity growth between the two groups, are apparently quite limited (Okamoto and Sjoholm 1999). The micro, firm-level research also points in the same direction, although there are some notable exceptions, especially in the leading Astra group.14
Other Features
Several additional features of the automotive industry’s structure and performance deserve brief mention.
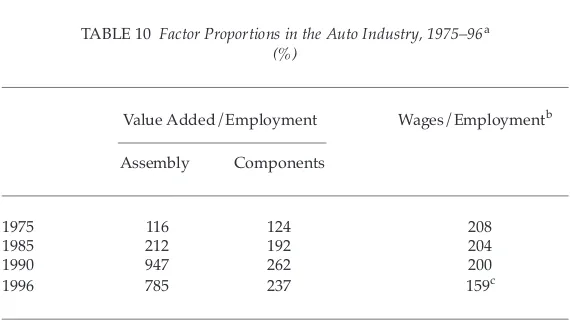
they do in part reflect a real phenomenon. The industry is also quite skill-intensive, but as would be expected the differences and trends are less marked. In fact, relative wages have actually declined since the mid 1980s, probably reflecting the expanding share of the more labour-intensive components sector.
Geographic Concentration. The assembly industry is located almost entirely in the Jabotabek (greater Jakarta) region. Around 1970, in what little activity there was, Jakarta accounted for about 68% of output (Hansen 1971). Small volumes were produced in Surabaya (25% of the total), Medan and Ujung Pandang. By the mid 1990s, the assembly industry was based entirely in Jabotabek, with the capital city alone contributing 94% of value added and employing 79% of the workforce. The location of the components industry exhibited a similar pattern, although with slightly more spatial diversity: 102 of the 119 major producers were located in Jabotabek, 11 in greater Surabaya, six in other parts of West Java, and three in Central Java. Jabotabek’s share of value added was 93% (and 70% of employment). Here too Jakarta dominated, with 72% of the subsector’s value added and 35% of its employment. Among other centres, only Surabaya (4% of value added and 19% of
TABLE 10 Factor Proportions in the Auto Industry, 1975–96a
(%)
Value Added/Employment Wages/Employmentb
Assembly Components
1975 116 124 208
1985 212 192 204
1990 947 262 200
1996 785 237 159c
aThe data are ratios, expressed as a percentage of the ratio for all non-oil
manufac-turing.
bThe data are a weighted average of the assembly and components sectors. c1996 data for wages/employment refer to 1995.
Aswicahyono, Basri and Hill 236
employment) was of any significance. In addition, of course, smaller repair workshops and replacement parts manufacturers were found throughout the country.15
These figures reflect the pull of the market and, for such a highly regulated industry, the advantages of proximity to the centre of largesse and patronage. In 1970, about 44% of the stock of motor vehicles was located in Jakarta and West Java (Hansen 1971). By 1997, Jakarta alone accounted for 42% of the nation’s registered passenger cars; combined with West Java, the share was 52%. For all motor vehicles, the shares were 23% and 31% respectively. It therefore appears that the spatial concentration of production and demand in the industry has moved in opposite directions: the former becoming more Jakarta-centric over time, the latter less so. The economics of agglomeration and access to capital city policy makers have probably been the key deciding factors
Seller Concentration. As would be expected in such a scale-intensive, highly regulated industry, seller concentration is very high. The share of the four largest assembly plants has always been at least 80%, and by the mid 1990s it had risen to over 90% (table 11). These figures refer to plant, not enterprise-level, concentration. As noted above, the industry is even more concentrated according to the latter measure, since several business groups produce more than one brand name. Thus, for example, in 1997 the Astra group controlled 57% of the market, Indomobil 26% and Krama Yudha 11%. Reflecting its labour intensity, concentration in the components sector is lower, though still above the industry-wide average. As market liberalisation proceeds, these shares will have less normative significance, although the internationally oligopolistic nature of the automotive industry suggests that reduced trade barriers, though beneficial, will limit the extent to which prices will fall.16
should be regarded as at best indicative—though plausible—given the short time period and the significant capital investment in the industry in the early 1990s.
LOOKING TO THE FUTURE: BEYOND THE
KRISMON
This examination of the Indonesian automotive industry since 1970 has revealed a classic case of largely unsuccessful import substituting industrialisation. Output grew rapidly in the three decades up to 1997, there was a significant increase in technological capacity in both components and assembly activities, and in a few cases—some commercial vehicles and components manufacturing—Indonesian firms are reasonably competitive.
However, the highly interventionist policy regime since the early 1970s would have to be judged a failure. Instead of encouraging the development of a broad-based and efficient components industry, leading gradually into assembly, the government embarked on a strategy of prohibitive protection which resulted in ‘back-to-front’ industrialisation and highly uneconomic production runs. Very few firms have been able to exploit the economies of scale necessary to achieve international competitiveness. Exports have been small, and the opportunity in the 1970s for Indonesia to progress towards being the leading automotive
TABLE 11 Concentration in the Auto Industry, 1975–96a
(%)
Assembly Components
1975 85 57
1980 81 61
1985 81 45
1990 83 61
1996 92 58
aThe data refer to CR4s, i.e. the value added of the four largest firms in the auto
industry as a percentage of the industry total.
Aswicahyono, Basri and Hill 238
nation in Southeast Asia has instead been seized by Thailand and, to a lesser extent, Malaysia.
However, there is hope in adversity. The current economic crisis is leading to a major rationalisation of the industry. The collapse in domestic demand, and the beginnings of a major trade liberalisation as part of the IMF program, have already resulted in the closure or merger of some plants, and in a smaller range of models. These factors, combined with the real depreciation of the rupiah, are forcing firms to look outwards. This process of structural adjustment is painful and, instead of being implemented gradually, it has been highly compressed. But already some gains in efficiency and export performance are evident.
There is a reasonable prospect that international pressures (from the IMF, AFTA, APEC and the WTO) will lock in at least some of these reforms, notwithstanding the interventionist proclivities of the new Minister for Industry and Trade, and the return of industry lobbyists as the economic recovery proceeds. For example, the WTO now effectively precludes local content programs (though not industry assistance more generally), and the IMF is unlikely to yield significantly on open trade and investment regimes. The automotive industry in Southeast Asia and beyond will be increasingly integrated across international boundaries, and Indonesia can hardly afford to stand apart from these trends. An open trade policy will ensure that there is a major industry rationalisation. An open foreign investment regime, combined with effective industrial extension programs and measures to promote technology transfer from foreign to local parties, will facilitate continuous improvements in supply-side capacities. As in Thailand and Taiwan, a labour-intensive, export-oriented components industry is likely to offer the best prospects for growth. The industry could look forward to again becoming one of Indonesia’s major manufacturing activities, but with much improved efficiency and a growth path not dependent for its success on political patronage.
NOTES
* We gratefully acknowledge the assistance of several industry sources in the preparation of this paper, together with very helpful comments from three referees and ANU seminar participants. We have also drawn on some of the material in Aswicahyono, Anas and Rizal (1999).
1 Note that the table refers only to the assembly industry, and excludes the important components industry.
3 One result of this distortion was that commercial vehicles came to be adopted for household use much more quickly than would otherwise have been the case. While this brought some relief to middle-income consumers, who were able to purchase their means of transport at lower cost, it probably also had undesirable environmental consequences. This arose because commercial vehicles were generally heavier gasoline consumers, and also more likely to use more polluting diesel products.
4 See the notes circulated for the ‘Panel Diskusi “Kebijaksanaan Industri Otomotif”’, Faculty of Economics, University of Indonesia, January 1999. 5 Notwithstanding the close commercial relationship with Japanese
manufacturers, Indonesia’s slow progress towards liberalisation resulted in lost business opportunities in the 1990s, especially in the components sector. As Sato (1998a: 113–14) shows, Japanese investment in the more open and faster growing components industries of Malaysia and Thailand substantially exceeded that in Indonesia over this period.
6 It might be noted in passing that the founding firm in the industry, GM, continued to be of some importance until the early 1970s, when it still ranked third in terms of industry sales. Thereafter, however, its fortunes waned, and it became a minor player. A reluctance on the part of GM (whose Indonesian operations were then run from Australia) to adapt to the new policy environment of minority equity stakes and rising local content requirements appears to have been the main factor (see Chalmers 1996).
7 It is not possible to obtain accurate time-series estimates of foreign ownership in the industry back to the 1970s, since the reported ownership shares at the disaggregated level of industrial classification display considerable year-to-year fluctuations. Note that ‘foreign’ here refers to firms with any foreign equity. Lest it be thought that this results in an overstatement of the foreign share, it needs to be remembered that for much of the period 1974–94, auto MNCs exerted their influence primarily through non-equity channels. In table 2, motor cycle assembly best illustrates this proposition: all assemblers have very close ties to foreign firms and are very much dependent on them for product specification, technology and so on. But firms with foreign equity contributed just 10% of sectoral value added in 1990–96.
8 This dispute occurred between 1979 and 1981, and involved Indokaya (a Jakarta-based assembler) and Nissan–Datsun (see Chalmers 1996). The Japanese partner, alleging Indokaya mismanagement and a broken agreement (Indokaya was not supposed to be producing auto components), cut off supplies of components and spare parts. Although this mismanagement was widely recognised, the dispute provoked a nationalist backlash, and its resolution eventually required presidential intervention.
Aswicahyono, Basri and Hill 240
10 More generally, the components sector in aggregate (i.e. including autos, motor cycles and electronics) has grown more rapidly than assembly activities since the 1970s, as would be expected. As Sato (1998a: 111) shows, in 1976 components value added and employment were each about one-quarter of the assembly totals. By 1995, the components sector had grown to two-thirds and nine-tenths respectively of the assembly totals.
11 The data on production by major brand are striking: Toyota’s production of 8,600 cars in 1996 was divided among four models (Corolla, Starlet, Corona and Crown), while Honda produced three models (Civic, City and Accord) in its volume of 6,350 units.
12 Note that the figures in table 8 appear to exclude a substantial amount of output for the replacement/spare parts market in the 1970s, and as a result the implied production growth rates are overstated.
13 There is some evidence that these relationships are better developed in the motor cycle industry (Sato 1998a; Thee 1997), presumably owing to the assemblers’ larger production runs and stronger technological capacity. 14 See, for example, the case study by Sato (1998b), who documented the
introduction and dissemination of quality control techniques in the industry. 15 Only in the small body-manufacturing subsector (ISIC 38432) did Jabotabek not dominate: it accounted for 58% and 33% of value added and employment respectively. (We are grateful to Kai Kaiser for kindly providing these data from the BPS Statistik Industri tape.)
16 While concentration has remained high, it is worth noting that the average size of plants in the industry has declined, from 379 employees per plant in 1975 to 220 in 1985 and 236 in 1995. This surprising result probably derives from the fact that the unit of measurement is plants, not firms.
REFERENCES
Abrenica, J. (1998), ‘The Asian Automotive Industry: Assessing the Roles of State and Market in the Age of Global Competition’, Asian-Pacific Economic Literature 12 (1): 12–26.
Aswicahyono, H. (1998), Total Factor Productivity in Indonesian Manufacturing, 1975–1993, Unpublished PhD thesis, ANU, Canberra.
Aswicahyono, H., T. Anas and J. Rizal (1999), The Indonesian Automotive Industry, Unpublished paper, Centre for Strategic and International Studies, Jakarta. Chalmers, I. (1996), Konglomerasi: Negara dan Modal dalam Industri Otomotif Indonesia,
1950–1985 [Conglomeration: State and Capital in the Indonesian Automotive Industry, 1950–1985], Gramedia Pustaka Utama, Jakarta.
Fane, G., and T. Condon (1996), ‘Trade Reform in Indonesia, 1987–1995’, Bulletin of Indonesian Economic Studies 32 (3): 33–54.
Hansen, J.R. (1971), ‘The Motor Vehicle Industry’, Bulletin of Indonesian Economic Studies 7 (2): 38–69.
Hill, H. (1984), ‘Survey of Recent Developments’, Bulletin of Indonesian Economic Studies 20 (2): 1–38.
Okamoto, Y., and F. Sjoholm (1999), ‘Protection and the Dynamics of Productivity Growth: The Case of Automotive Industries in Indonesia’, Working Paper No. 324, Stockholm School of Economics, Stockholm.
Sato, Y. (1993), ‘The Salim Group in Indonesia: The Development and Behaviour of the Largest Conglomerate in Southeast Asia’, Developing Economies 31 (4): 408–41.
Sato, Y. (1996), ‘The Astra Group: A Pioneer of Management Modernization in Indonesia’, Developing Economies 34 (3): 247–80.
Sato, Y. (1998a), ‘The Machinery Component Industry in Indonesia: Emerging Subcontracting Networks’, in Y. Sato (ed.), Changing Industrial Structures and Business Strategies in Indonesia, Institute of Developing Economies, Tokyo: 107– 48.
Sato, Y. (1998b), ‘The Transfer of Japanese Management Technology to Indonesia’, in Hal Hill and Thee Kian Wie (eds), Indonesia’s Technological Challenge, ANU, Canberra, and Institute of Southeast Asian Studies, Singapore: 326–41. Tarmidi, L. (1998), ‘Industri Komponen Otomotif’, in Perhimpunan Alumni Jerman
(ed.), Daya Saing Industri Indonesia, Perhimpunan Alumni Jerman, Jakarta: 36–98.
Thee Kian Wie (1997), ‘The Development of the Motor Cycle Industry in Indonesia’, in M. Pangestu and Y. Sato (eds), Waves of Change in Indonesia’s Manufacturing Industry, Institute of Developing Economies, Tokyo: 95–135.
Timmer, M. (1999), ‘Indonesia’s Ascent on the Technology Ladder: Capital Stock and Total Factor Productivity in Indonesian Manufacturing, 1975–95’, Bulletin of Indonesian Economic Studies 35 (1): 75–98.