Contents list available at IJRED website, ISSN : 2252-4940
Int. Journal of Renewable Energy Development (IJRED)
Journal homepage: www.ijred.com
First Aspect of Conventional Power System Assessment for High
Wind Power Plants Penetration
A. Merzic
a*, M. Music
a, and M. Rascic
b
aElectric Power Company Elektroprivreda of Bosnia and Herzegovina – Sarajevo,
Department for Strategic Development, SARAJEVO, BOSNIA AND HERZEGOVINA
bFaculty of Electrical Engineering, Sarajevo University,
Department for Power Engineering, SARAJEVO, BOSNIA AND HERZEGOVINA
Article history:
Received Sep 10, 2012
Received in revised form Sep 25, 2012 Accepted Oct 1, 2012
Available online
ABSTRACT: Most power systems in underdeveloped and developing countries are based on conventional power plants, mainly "slow-response" thermal power plants and a certain number of hydro power plants; characterized by inflexible generating portfolios and traditionally designed to meet own electricity needs. Taking into account operational capabilities of conventional power systems, their development planning will face problems with integration of notable amounts of installed capacities in wind power plants (WPP). This is what highlights the purpose of this work and in that sense, here, possible variations of simulated output power from WPP in the 10 minute and hourly time interval, which need to be balanced, are investigated, presented and discussed. Comparative calculations for the amount of installed power in WPP that can be integrated into a certain power system, according to available secondary balancing power amounts, in case of concentrated and dispersed future WPP are given. The stated has been done using a part of the power system of Bosnia and Herzegovina. In the considered example, by planned geographically distributed WPP construction, even up to cca. 74% more in installed power of WPP can be integrated into the power system than in case of geographically concentrated WPP construction, for the same available amount of (secondary) balancing power. These calculations have shown a significant benefit of planned, geographically distributed WPP construction, as an important recommendation for the development planning of conventional power systems, with limited balancing options.
Keywords: balancing reserves, geographical dispersion, output power variations
*Corresponding Author: Tel: +387 61 746 167
Email: [email protected]
1. Introduction
Growing concerns over rising oil prices and greenhouse gas emissions worldwide have strengthened the search for clean and efficient energy sources. In that sense, wind power plants (WPP) have become the fastest growing energy technology in the world during the last 20 years. By the end of year 2011, the total installed capacity in WPP integrated into power systems throughout the world, reached the value of cca 239 GW. In most parts of the world, wind energy still supplies only a small part of the total power
When talking about integration of WPP into power systems, it is of great importance to consider one of their main working characteristics - variation of their output power and thus their electricity generation, in a relatively short period of time, as discussed in [2], [3],
[4]. This characteristic becomes more expressive with the increase of WPP penetration in considered power systems. That feature highly influences the decision of integrating notable amounts of installed capacities in WPP into power systems, also discussed in [5] and mentioned in [6].
With regards to this phenomenon, there is a growing interest in managing the increased variability and finding solutions that would enable a smooth integration of significant amounts of installed capacities in WPP into power systems worldwide.
Most power systems in underdeveloped and developing countries are based on conventional power plants, mainly "slow-response" thermal power plants (TPP) on fossil fuels for base load covering and a certain number of hydro power plants (HPP) used to cover the variations of consumption. These systems can be called conventional power systems and are mostly characterized by an inflexible generating portfolio and have been traditionally designed to meet their own electricity needs. Electricity market liberalization, measures in emission reduction, increased penetration of generating facilities based on intermittent renewable energy sources (RES), etc., represent big challenges for conventional power systems. Taking into account operational characteristics of those power systems, their development planning will face problems with integration of significant amounts of installed capacities in WPP and balancing variations of output power from installed WPP.
To lessen the impact of variations and allow a smoother integration of WPP into power systems, in this paper, variations of output power from future WPP in the 10 minute and hourly time interval are simulated, presented and analyzed. Since the shorter time interval requires a faster response, and thus may cause greater problems when it comes to balancing power ensuring, in this paper the focus is set on the 10 minute time interval. Comparative calculations for the amount of installed power in WPP that can be integrated into a certain power system, according to available secondary balancing power amounts (balancing power available in 10 to 15 minutes time), in case of concentrated and dispersed future WPP are given. Simulations are based on real, measured wind potential data related to an area with a typical conventional power system - part of the power system of B&H.
The performed analyses have testified very high amounts of output power variations from WPP in 10 minutes and hourly time intervals. Also, simulations and calculations have shown a significant benefit of planned, geographically distributed WPP construction, as a very important recommendation for the development
planning of conventional power systems, with limited balancing options.
At last, the research objectives of this paper are multiple and can be reflected in the following: indication of limited possibilities in balancing variations of output power from future WPP in conventional power systems and with regards to this, determination of approximate boundaries of expected variations of output power from WPP and thus the quantification of benefits of geographical dispersion of future WPP in comparison to concentrated WPP construction, taking into account available secondary balancing reserves.
2. Simulation Method and Input Data Used
2.1 Output Power Variations of Wind Power Plants
This paper highlights the stochastic and variable nature of wind, as an energy resource that drives the wind turbine. In that sense, the output power (and generated electricity) from WPP varies in seconds, minutes, hourly, on daily basis, but also seasonally. This feature significantly influences the decision of integrating high amounts of installed capacities in WPP into power systems worldwide.
Experiences have shown that in case of a very low level of penetration of WPP, output power variations of WPP almost fit into normal variations of consumption and disorders that occur during operation of other generating facilities in the system. Output power variations of WPP in second to minute time periods are very small, and therefore have a negligible impact on the power system operation, concerning the field which is treated in this paper [2], [3]. However, output power cases, the interruption of production occurs gradually and may take several hours, due to unequal distribution of wind speed on the site caused by the shading effect and relief characteristics of the terrain. These changes can lead to significant difficulties in power system operation and sometimes even to the collapse of some of its part. Following cases, notified in countries with already high WPP penetration, demonstrate the occurrence of variations in the output power of WPP in operation [3]:
Texas, USA: decrease of 1.550 MW in 2 hours and 30 minutes, or decrease rate of 600 MW/h, on February 24, 2007.
North Germany: decrease of over 4.000 MW (58% of capacity) in 10 hours, or decrease rate of 16 MW/min, on December 24, 2004.
Spain: increase of 800 MW (7% of capacity) in 45 minutes, or increase rate of 1.067 MW/h and decrease of 1000 MW (9% of capacity) in 1 hour and 45 minutes, or decrease rate of 570 MW/h.
2.2 Simulation of Output Power Variations
For the purpose of simulating expected variations of output power from future WPP, data based on real 10 minute average wind speed values from three active measurement stations were used. The stations are equipped with first-class measuring sensors and data collection process, both according to the standard IEC 61400-12 and MEASNET . The considered measurement stations are located at different sites in B&H. The first and second location Budozelje and Zukica Kosa, where 30 m high measuring stations are placed, can be considered as plain areas with cca 1.020 m a.s.l. and 1.270 m a.s.l., respectively. At the third location Borisavac, cca 1.150 m a.s.l. a 60 m high measuring station is mounted.
Based on collected wind potential measurement data, the output power of future WPP at these particular sites was simulated, and according to that, their relative variations of output power were made. For the purpose of these analyses a program has been prepared in Visual Basic and the simulations were done for 10 minutes and for hourly output power variations. Wind potential data collected during a period of four months was considered, i.e. two months in the winter time, January and February in year 2010 and two months in the summer season, July and August also in year 2010. For these simulations the power curve of wind turbines of
type Vestas V 80 of 2 MW installed capacity were used
[7]. Since the collected wind speed data correspond to heights of 30 m and 60 m above ground, wind speed values were projected to the hub height (78 m) for the chosen wind turbine type, according to the appropriate exponential function:
1 2 1 2) ( )
(
z z z v z v
, (1)
In (1) Z1 and Z2 present the height above the ground
expressed in (m), v(Z) the average wind speed expressed in (m/s), v(Z1) denotes the known wind
speed data at height Z1, v(Z2) denotes the calculated
wind speed data at wanted height Z2, and α is an
exponent which varies in accordance with the terrain type.
3. Results
3.1 10 Minutes and Hourly Output Power Variations
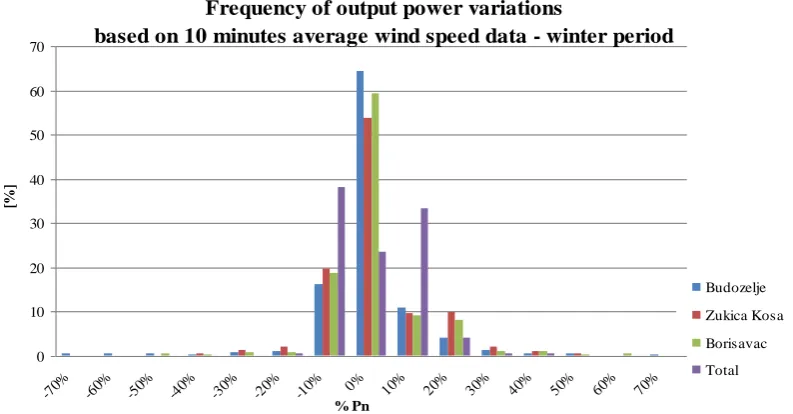
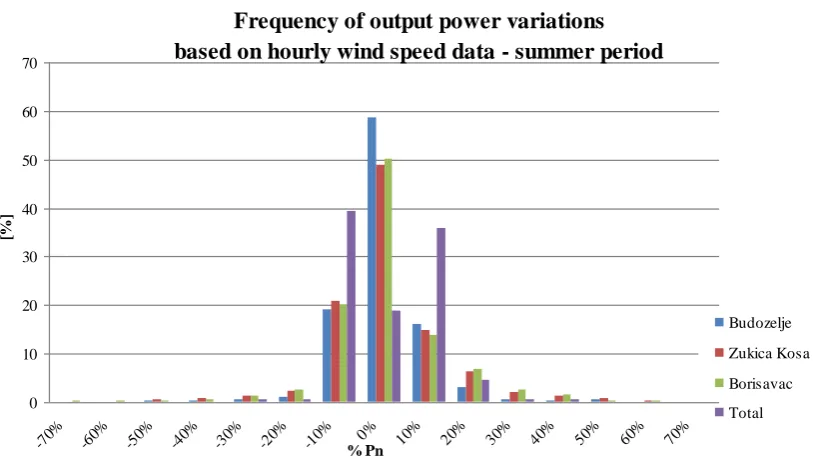
Diagrams shown in Figure 1 and Figure 2 provide insight into possible 10 minutes fluctuations of output power of potential WPP located on mentioned sites at the territory of B&H, for the winter and summer season, respectively. Figure 3 and Figure 4 show simulated hourly fluctuations of output power of potential WPP located on these three particular sites at the territory of B&H, for the winter and summer period, respectively.
The horizontal axes (%Pn) show percentage output power variations of WPP at the considered location in relation to the installed capacity (Pn) of this WPP. The vertical axes (%) show the frequency of occurrence of the considered variations in the 10 minute period.
Frequency of output power variations
based on 10 minutes average wind speed data - winter period
0 10 20 30 40 50 60 70
-70% -60% -50% -40% -30% -20% -10% 0% 10 %
20% 30% 40% 50% 60% 70%
% Pn
[%]
Budozelje Zukica Kosa Borisavac Total
Frequency of output power variations
based on 10 minutes average wind speed data - summer period
0 10 20 30 40 50 60 70
-70% -60% -50% -40% -30% -20% -10% % Pn0% 10% 20% 30% 40% 50% 60% 70%
[%]
Budozelje
Zukica Kosa
Borisavac
Total
Fig. 2 Frequency of output power variations based on 10 minutes average wind speed data during the summer period
Frequency of output power variations
based on hourly wind speed data - winter period
0 10 20 30 40 50 60 70
-70% -60% -50% -40% -30% -20% -10% 0% 10% 20% 30% 40% 50% 60% 70%
% Pn
[%]
Budozelje
Zukica Kosa
Borisavac
Total
Frequency of output power variations
based on hourly wind speed data - summer period
0 10 20 30 40 50 60 70
-70% -60% -50% -40% -30% -20% -10% % Pn0% 10% 20% 30% 40% 50% 60% 70%
[%]
Budozelje
Zukica Kosa
Borisavac
Total
Fig. 4 Frequency of output power variations based on hourly wind speed data during the summer period
The range of obtained mean hourly variations of output power is wider compared to the 10-minute power variations, where in both cases the variations during the winter months have a slightly wider range than during the considered summer period. Variations in the output power of assumed WPP can be expected to go even up to 70% of the nominal installed capacity of WPP in the considered time periods, where such high level of variations are in percentage more present during considered hourly time intervals.
3.2 Effects of Geographical Dispersion
During performed simulations described in the previous chapter, an overview of the frequency output power variations that take into account the geographical dispersion of the considered WPP has been done. A notable decrease in the frequency range of the output power variations can be noticed for all three locations and for both time periods and seasons, as it can be seen from all four Figures. Total variations in the output power of assumed WPP in 10 minutes as well as in hourly time intervals can happen to be 40% of the nominal installed capacity of the WPP. Reasons for this phenomenon are the observations of the total output power variations from WPP that are geographically dispersed and caused by different wind streams, so that the output variations are not linked to each other and thus contribute to the smoothing of the total output power of WPP in the considered power system.
The surface of B&H is cca 51.200 km2, the
considered three locations cover even less area, but different flow patterns and characteristics of the wind, as well as terrain orography at analyzed locations, contribute significantly to the smoothing effect of the
expected output power variations of future WPP considered in this paper. This fact is of great significance for countries with conventional power systems with limited power balancing options and it is important to take it into consideration during the process of planning and integrating high amounts of installed capacities in WPP. Taking into account the geographical dispersion of planned WPP can significantly reduce the need for balancing power amounts.
4. Discussions
4.1 Balancing Output Power Variations of Wind Power Plants in Conventional Power Systems
Due to variability and stochastic changes in wind power, and thus the output power and generated electricity from WPP, it is necessary to define working conditions of a considered power system when in its generating portfolio significant amounts of installed capacities in WPP exist, or are being planned. Under these conditions, this power system has to be able to provide adequate regulating reserves, i.e. balancing power to cover the variation of output power of WPP in operation. In order to minimize effects of unavoidable variations of output power of WPP, different methods are used. This can be done either through adjustment of other existing generating units in the observed power system, which requires a certain level of flexibility as stated in [8] and also mentioned in [9], or by providing balancing power on the electricity spot market [10],
systems as recommended in [3], or using some possible ways of energy storage for cases when needed [12], or for example in electric vehicles [11], as well as using elaborating it in detail and supported by real examples.
In the considered segment, conventional power systems, mainly consisting out of "slow-response" TPP for base load covering and a certain number of HPP used to cover variations of consumption, will face particular problems. More or less, power systems in underdeveloped and developing countries are like this. These systems do not posess flexible generating portfolios, they are mainly not included in the balancing market, nor do they have substantial possibilities of energy storage. Adaptation of such power systems to "new" operating conditions (i.e. open electricity market, emission reduction, intensifying integration of power generation facilities based on intermittent RES, etc.) will present a key issue for their further development.
4.2 Balancing 10 Minutes Output Power Variations of Expected Wind Power Plants - EPC EP B&H Case Study
B&H is a land where no WPP has been attached to its power system so far, even though significant wind potential exists. This has been confirmed by different geographical features such as the presence of mountains and hilly areas, nearness of the sea, presence of numerous rivers, mixture of different climate types and many other characteristics, but also by indicative wind potential data [16], [17] and wind potential measurements at different sites which are in progress. For B&H, as a signatory of international declarations and conventions (European Energy Policy, Kyoto protocol etc.), the integration of WPP into its power system is an unavoidable process and according to undertaken actions and strategic plans, significant amounts of installed power can be expected from future WPP in the upcoming 10 to 15 years.
The generating part of the power system of B&H is primarily characterized by dominant electricity generation from "slow-response" TPP on coal. The energy market in the country is not established and the consumer supply is done by three public power utilities, each with its own area of competence. Among them Electric Power Company Elektroprivreda of B&H (EPC EP B&H) is the largest and reached the share of cca 45% in total electricity generation in B&H for year 2010. During this year, total electricity generation in EPC EP B&H was cca 7.182 GWh, out of which the TPP generated cca 70% (5.013 GWh) and HPP together with small HPP (sHPP) cca 30% (2.169 GWh). In the same for 400 kV, 220 kV and 110 kV voltages levels and away from being overloaded, so it should not be a limitation in case it comes to a larger number of WPP integration. In case of power/energy exchange, problems can be caused by weak interconnection lines between surrounding power systems. For these reasons, those power systems should independently provide balancing power for the operation of their future WPP. Due to different technical limitations, primary the development of the transmission system, operating capabilities and power system service insurance as regulation of active WPP in 10 minutes time intervals, can happen to be up to 70% of the nominal installed capacity of the WPP. In order to reduce the impact of variations in output power of WPP in power systems with high WPP penetration, secondary balancing power is essential. In this sense, it is important to know with what amounts of regulating power the considered power system accesses. In EPC EP B&H, HPP are the only generating units that can be engaged for secondary power regulations, but most of them, together with all sHPP are run-of-river type, without any accumulation. These characteristics can cause problems when it comes to integrating significant amounts of installed capacity in WPP into the existing power system and balancing of their output power. According to current practice of the system operator and the characteristics of one HPP, the HPP Jablanica is involved in power regulation for the 10 to 15 minutes time interval (secondary regulation) with the average value of balancing power of ± 54 MW.
Calculations have shown that the available amount of balancing power from HPP Jablanica can support cca 86 MW in WPP, in case of providing 100% reserves for secondary balancing. The calculations have taken into account European experiences, where it is found that the total involvement of all existing WPP in a power system does not exceed 90% of their installed capacity
[2].
4.3 Balancing 10 Minute Output Power Variations of Expected Wind Power Plants With Respect To Geographical Dispersion - EPC EP B&H Case Study
performed analyses and taking into account the available average value of secondary balancing power of ± 54 MW, approximately 150 MW of installed capacity in WPP can be integrated into the power system of EPC EP B&H, in terms of system effects. This assessment is based on the assumption that future WPP will be geographically dispersed and that all available secondary power can, in certain (but very rare) situations, be used for balancing WPP output variations, so that 100% reserves for balancing are provided. These analyses also consider the fact that the total involvement of all existing WPP in a power system very rarely exceeds 90% of their installed capacity.
Compared to the case analyzed in the previous section, this amount represents a significant difference. When it comes to conventional power systems, which are characterized by features described before and the fact that such power systems do not possess a lot of options for providing balancing reserves to cover output power variations from WPP, the geographical dispersion of future WPP is something that should be especially taken into account. In respect to this, systematic planning of integration of WPP into conventional power systems is necessary and should be implemented in such a way to gradually construct smaller WPP geographically distributed over a larger area, or over the whole country.
5. Conclusion
Conventional power systems are the characteristic of many underdeveloped and developing countries. When it comes to significant integration of WPP, those systems will face problems in providing balancing power for WPP output power variations covering, since they are, among other things, characterized by lack of flexible generating units, lack of a developed balancing market and often surrounded by countries with the same characteristics of the power system.
In this paper, possible variations of simulated output power from WPP based on real, measured wind speed data were presented and analyzed. Power variations related to the 10 minutes and hourly time interval were investigated, focusing on the 10 minutes variations, which should be balanced by secondary regulation in the considered system. In extreme situations, these variations can go even up to 90% of the total installed power of WPP or even higher.
Considering the performed analysis and results obtained, comparative calculations for the amount of installed power in WPP that can be integrated into a certain power system, according to available amounts of secondary balancing power, in the case of concentrated and dispersed distribution of future WPP are given. The stated has been done using a concrete example of a part of the power system of B&H - EPC EP B&H, as a typical representative of a conventional power system. It has
been shown that the planned construction of geographically dispersed WPP can significantly reduce the need for balancing power. In this case, a higher amount of installed capacity in WPP can be integrated into a power system, than in the case of geographically concentrated WPP. In the considered example, by planned geographically distributed WPP construction, even up to cca. 74% more in installed power of WPP can be integrated into the power system than in the case of geographically concentrated WPP construction, for the same available amount of secondary balancing power. For this reason, during the construction of WPP, a planned geographically distributed WPP construction is strongly recommended, as the first step in managing output power variations of WPP, especially in the case of conventional power systems.
References
[1] The World Wind Energy Association (2011) Year report 2011. [2] Van Hulle F (EWEA), Gardner P (Garrad Hassan) (2009) Wind
Energy – The Facts, Grid Integration.
[3] Group of Authors (2009) Design and operation of power systems with large amounts of wind power, Final report IEA WIND Task 25, Phase one 2006-2008. VTT Tiedotteita, Helsinki.
[4] Holttinen H (2004) The Impact of Large Scale Wind Power Production on the Nordic Electricity System. PhD thesis, Helsinki University of Technology, VTT Technical Research Centre of Finland.
[5] Pertmann ) Estonian Wind Farms’ Need for Full Balance Power. Oil Shale, 2011 Vol. 28(1S): 193–202.
[6] Aboumahboub T (2010) Optimal Configuration of a Renewable-based Electricity Supply Sector. World Scientific and Engineering Academy and Society (WSEAS) Transaction on Power Systems, Vol 5(2).
[7] Vestas Wind Systems A/S, Product brochure V80 - 2.0 MW. [8] Lukac A et al. (2011) Flexible Generating Portfolio as Basis for
High Wind Power Plants Penetration - Bosnia and Herzegovina Case Study. IEEE/PES - 10th International Conference on Environment and Electrical Engineering, Rome, Italy.
[9] Ackermann T (2005) Wind Power in Power Systems, John Wiley&Sons, Ltd.
[10]Ummels B (2009) Power System Operation with Large-Scale Wind Power in Liberalised Environments. PhD thesis at Technical University Delft, Netherlands.
[11]Vandezande L et al. (2010) Well-functioning Balancing Markets: A Prerequisite for Wind Power Integration. Elsevier, Energy Policy, Vol. 38(7).
[12]Papaefthymiou S et al. (2010) A Wind-Hydro-Pumped Storage Station Leading to High RES Penetration in the Autonomous Island System of Ikaria. IEEE Transactions on Sustainable Energy, Vol. 1(3).
[13]Pillai JR (2010) Electric Vehicle Based Battery Storages for Large Scale Wind Power Integration in Denmark. PhD thesis, Aalborg University, Denmark.
[14]Agabus H, Tammoja H (2009) Estimation of Wind Power Production Throughout Short-term Forecast. Oil Shale, Vol. 26(3) Special: 208–219.
[15]Georgilakis PS (2008) Technical Challenges Associated With the Integration of Wind Power into Power Systems. Elsevier, Renewable and Sustainable Energy Reviews, 12: 852-863. [16]Sander and Partner GmbH (2008) Electronic Wind Atlas for
Bosnia and Herzegovina, Switzerland.