ELECTRONIC PRODUCT FEATURE-BASED
Sentiment in a product online review is useful and influence decision-making a person may take in buying any product as well as that of organization in determining the number of product to produce. In an opinion, reviewer may provide positive and negative reviews at the same time that can be ambiguous. This is because opinion targets are often not the product as a whole; instead they are only part of a product called as feature, which have advantages and disadvantages based on the reviewers point of view. In this paper, the goal is to produce sentiment of a mobile phone opinion based on its feature. Opinion data used in this thesis are in English taken from www.cnet.com. Feature extraction is conducted by searching for phrases that match the dependency relation template, which is followed by feature filtering. The sentiment identification, positive and negative probability value, as well as target class label of the data preparation become the Nu SVM classifier input parameters. In the study of NU SVM, some data are treated as unlabeled data. The evaluation towards sentiment identification obtained from the study shows F1 Measure of 86.25% for positive class and 77.71% for negative class. The accuracy for feature identification, however, is 82%.
I. INTRODUCTION
Website is one of technologies widely used, either for promotion, review of a certain products or e-commerce. Based on the survey conducted by comScore (2007) and Horrigan (2008), it is known that 81% of US website users use internet to search products they want to buy and more than 30% of the users give some review towards the product they purchased [1].
Recently, the number of online shop customers is increasing along with the increase of the use of e-commerce service. As to increase customers satisfaction level, customers are allowed to give their opinion in the form of suggestion, testimony towards the products, or comments on the review. Opinion is usually a subjective expression describing sentiment or feeling on a review. The opinion can be used as one of analysis parameter as to see the interest level of society towards a product so that it can be the parameter in determining the number of products going to be produced. Testimony can also help other customers to decide whether they will purchase of a product or not. However, the increase of the number of review on a product can make customers confused since they have to read and analyze the review one by one. The problem is that the review given is ambiguous which has positive and negative sentiment at the same time.
Therefore, an application that can generate sentiment analysis summary towards opinion given by reviewers towards a product or a topic is then required. Accordingly, analysis, identification, feature extraction and classification of sentiment expression class, either it is positive or negative pertaining to the opinion of the reviewer are also required. Previously, there are some studies [12], the methods used to classify opinion into sentiment expression class include: unsupervised learning method conducted by counting Pointwise Mutual Information (PMI) [18], dictionary-based or lexicon based [3], and supervised learning with machine learning method that includes Naive-Bayes Classifier, Maximum Entropy, and Support Vector Machine (SVM) [12].In the study [12], SVM method has the best performance, compared to the other learning machine methods.
Therefore, in this study, Nu-SVM will be used, since it belongs to one of methods derived from SVM method. Nu-SVM is used to minimize the mistake since Nu-SVM has addition in upper limit on margin error fraction and lower limit on supporting vector fraction (namely, the lack of a solution). Therefore, the formulation of Nu-SVM will be more potential than Support Vector Machine (SVM).
II. THEORETICALBACKGROUND
A. Option Mining
Information can be classified into two, namely facts and opinions. Facts are actual information on real phenomenon. While opinions are subjective statements and reflections one has on a fact. Facts are usually affirmed. Thus, in searching process, facts commonly come with a certain keywords. On the other hand, opinions are usually used in analysis process or articles related to a topic. However, currently, there are a lot of unnecessary opinions that are not well filtered in the keyword based
searching process since opinion is difficult to express in a keyword. Opinion plays an important role in website development that people can give their opinion freely on website. Opinion can provide some information needed as well as other indescribable information. Therefore, opinion mining process is required recently. Before the establishement of web, ones decision is gathered from people around him. When an organization wanted to find public opinion on its products or service, the organization would conduct a survey and made a group that will handle it. However, in the existence of website nowadays, one can post their review towards a product in an online shop site or in a product review site and deliver all their opinion in an internet forum, discussion group or blog, which is collectively called as user generated content. Ones purchasing plan can be revised by observing opinion from many people on the products they are going buy. Meanwhile, for companies, it is not necessary for them to conduct a survey, make a group or hire a consultant from foreign countries as to find opinion from customers on their products. Opinion mining is textual information comprising opinion or facts in the online world such as website, blog, etc. Opinion mining or so called sentiment analysis is the branch of data mining aimed at extracting attribute of an object that has opinion or comments and at determining whether the opinion/comment is negative, positive, or neutral opinion. Opinion mining generally assumes that document inspected will contain subjective information including product review and form feedback, Opinion orientation can be classified into positive opinion and negative opinion towards a product, opinion of likeable and unlikeable topic or ranking derived from predicted opinions as well the way how the opinions will be accepted by the system. One of the examples is movie review conducted by inputting opinion in the form of rank using stars, i.e between 1 to 5.[11]
B. Opinion Classification
Text classification is proccess in determining class of a textual document into a cathegory. There are two kinds of documents used: training document and testing document. Training document is used to build model, while testing document is used to evaluate the performance.
1) Nu - Support Vector Machine (Nu-SVM)
Nu-SVM is one of the classifications of SVM besides C-SVC which can be used to separate hyperplane that has soft margin classifier which is able to minimize the object function as well as to optimize the hyperplane using the nu parameter [4]. In Nu-SVM, C parameter is changed by nu parameter or v [0,1] where the lower and upper limit is bound to the number of support vector sample and lies in the wrong hyperplane side. The main thing should be focused in the approach of nu-SVm as to do minimization is as follow:
⌧(w, ", ⇢) = 1 2kwk
2−v⇢+ 1 m
m
P
i=1
⇠i
w✏H✏Rm, ⇢, b✏R(1)
that fit with the following rule:
yi(wτ(xi) +b)≥⇢−⇠i.⇠i≥0,1, . . . , N and ⇢≥0 (2)(2)
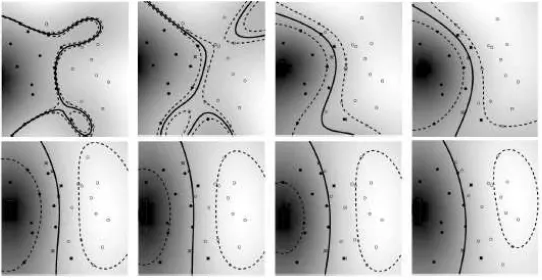
The use of appropriate nu parameter will affects the accuracy of the classification. The following figure shows the influence of nu parameters towards the accuracy of data separation:
From the figure, we can see that the bigger v to exist, the more points to be allowed by the margin. The optimization of the classification and the minimization of problems at nu-SVM can be implemented
w(↵) =−1
By using the above equation, it is proved that every , at least will have optimum solution that is obtained to fit with . Therefore, it can be concluded that the obstacles in equity can be used as a simple way to solve problems.
III. GENERALDESIGN OF THESYSTEM
The system design is generally illustrated in Figure 1. Based on the illustration, there are 4 main processes namely: Data Preparation & Feature Identification, Weighting, and Sentiment Identification.
A. Data Preparation
Data preparation : in data preparation module, there are some steps including data acquisition, data cleaning, feature identification, and feature-based labeling. The aim of this module is to prepare words to be processed by classifier, started from data acquisition to the data labeling phase. The phases conducted under data preparation include:
1) Data Acquisition
Taking content review from online review. The result of this phase is review list/user opinion, as well as its meta data, including: reviewer name, time, and reviewed products.
2) Data Cleaning
Cleaning opinion list obtained from Data Acquisition phase. The only one thing conducted in this phase is symbol cleaning, i.e. the cleaning of opinion from inappropriate symbols used in opinion such as exaggerative question marks or full stops, or emoticons. Besides, this phase also includes stopwords removal process.
3) Feature Identification
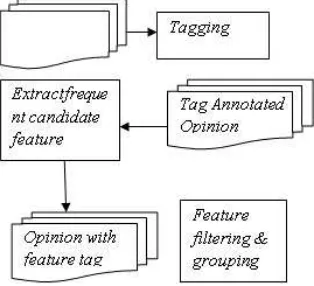
Opinion is processed by POS (part-of-speech) tagger, so that the opinion will include word class tag. In this phase, Stanford parser is used as POS tagger. After the word class and word dependency relation have been determined, filtering is conducted so that it will generate features complied with the relation in table 1 only. Figure 2 shows the processes conducted in feature identification phase.
The explanation of the process included in this phase is as follow :
Tagging
By using Stanford tagger, each opinion will be annotated with its word class.
Extract frequent candidate feature
This phase is to extract the feature in the opinion adapted from [12]. Each sentence opinion will be examined in terms of its word class as well its dependence relation, then filtering will be conducted using typed-dependency template adapted from [12], however, there are some additions, namely in terms of negative handling, so that template used is as follow:
TABLE I
USEDDEPENDENCYRELATIONTABLE
Fig. 2. Block Diagram of General Description
Feature filtering & grouping : conducting the feature filtering using threshold, so that only frequently appeared features are considered as feature. Filtering is also applied to synonymous features, like photo, picture and image which are considered to be a single feature of picture. Feature-basedlabelling: Each opinion whose sentences have been classified is labeled by its sentiment expression class, positive (1) or negative (-1). The labeling is conducted for all data manually by 3 people. Final label for each opinion is the label mostly chosen by the one that put the label. On the observation of S3VMs, some of data will be treated as unlabeled-data.
Fig. 3. Block diagram of detail process of feature identification
4) Weighting
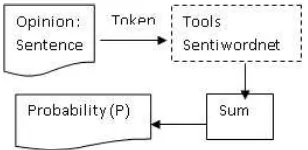
Weigh is determined by taking positive and negative probability of a term taken from sentiment dictionary of Sentiwordnet 3.0. The terms used are trigram, bigram and unigram. The calculated weight as well as the label will be the input feature on classifier. The determination process on positive and negative probability of a term is as seen on the following figure:
Fig. 4. Block Diagram of Detailed Opinion Weighting Process
dataset. The dataset is then separated again, so that it will result in a new dataset consisting of data treated as unlabeled data. Parameter accepted by classifier includes: weight, target, kernel function as well as the parameter, and C parameter representing the upper-bound. The training phase generates and b parameter, the variable of separating hyperplane function. The function is used as the separator in testing using dataset test. The process is divided into two:
• Training process: Finding the separating hyperplane/model by using training data. Training data is combination of labeleddata and labeleddata treated as unlabeled data (with the purpose of performace evaluation),
• Testing process: Conducting test towards data testing. On this phase, the performance will be measured by using the measure parameter of F1-Measure, the parameter is used as the system evaluation material.
B. Result of the Study
1) Feature Identification Phase
Feature identification phase starts with the feature extraction which is often identified in the opinion. The extraction of feature candidate is conducted by using dependency relation template which has been defined. The feature candidate has been passing through the previous grouping. The study, however, includes 82 defined product features.
TABLE II TABLE2
No Threshold Feature Candidate Non-Feature Undetected Feature Accuracy Error
1 1 1405 1325 2 97.5% 1618.3%
The accuracy percentage is gained from the number of feature candidate minus by the number of non-feature detected as feature. The result is then put into percentage compared to number of the feature which should be detected, i.e. 82 features. The error, however, is resulted from the number of non-feature detected as feature added with the number of feature that cannot be detected, then it is put into percentage compared to the expected feature of 82.
C. Data Set Testing
1) Sentimen Identification Phase
The graphic result of the first phase test on dataset effect test is as shown in the figure 4:
Fig. 5. Graph of the Effect of dataset towards data evaluation
2) Test Analysis Phase 2
The graph of the first phase test result on the dataset effect test is as in the figure 4-7:
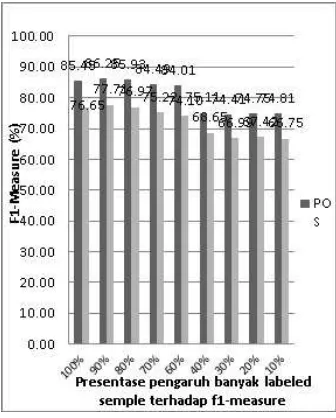
Fig. 6. Graph of the Effect of the Number of Labeled Sample on Train-set nuSVM towards F-1 Measure
The graph shows that decreasing in number of labeled sample data will be followed by the decrease in the evaluation value of F-1measure. However, the graph also shows that the unlabeled data are still able to help nuSVM classifier to find the appropriate hyperplane. It can be seen from the decrease of the evaluation on POS class, either based on the accuracy or F-1 measure. When the F1-measure for (100%) labeled data compared to that of data that do not have 20% target label, the highest decrease of F1-measure is identified to be only 12.92%, i.e. when the number of sample labeled is decreased for 30%. Meanwhile when the number of labeled sample is decreased for 10% and then 20%, the percentage of F1-Measure for POS class can reach a higher point compared to 100% labeled data. Meanwhile for NEG data class, the highest difference in the decrease number is reached when the number of labeled sample is decreased into 90%, resulted in the F1-measure decrease for 12.91%. The percentage of F1-measure has once increased when the labeled sample is decreased for 10%, and 20%, resulted in the decrease of 0.933% and 0.559. The decrease of labeled data for 30% to 90% shows the decrease of F1 measure percentage.
IV. CONCLUSION ANDSUGGESTION
A. Conclusion
class on feature-opinion generated the highest F1-measure, i.e. 86.25% for positive class and 77.71 % for negative class. The decrease on the performance of negative class can be caused by unbalance dataset characteristic that has 1/3 of the entire data. The parameter of nuSVM used, however, is degree=3, gamma=1, coefisien=0, nu=0.5, kernel=linear.
B. Suggestion
The followings are some suggestions for the further study: 1. The implementation of preprocessing for standardized words or sentences, like abbreviated words or nonformal words so that it can be converted into formal ones that can be translated into a good opinion weight. 2. In the weighting or translation process of text into numeral by using SentiwordNet, the accuracy can be identified by consulting the gloss on SentiwordNet. It is because the sentiment is not only determined by the words, but also by the context of the language. By considering the compliance of synset and gloss at SentiwordNet, sentiment score can be more accurate and specific.
REFERENCES
[1] Barbosa L,KR,PB,TA. For a few dollars less: Identifying review pages sans human labels. 2009. [2] Ceska Z, Fox C. The Influence of Text Pre-processing on Plagiarism Detection. 2009.
[3] Chaovalid P, Zhou L. Movie Review Mining: a Comparison between Supervised and Unsupervised Classification Approaches. In: Proceedings [4] Chen,Pai-Hsuen, Chih-Jen Lin, and Bernhard Scholkopf. A Tutorial on -Support Vector Machines. Departmrnt of Computer Science and Information
Engineering National Taiwan University, Taipei 106, Taiwan.
[5] Dey L,&HSM. Opinion mining from noisy text data. International Journal on Document Analysis and Recognition (IJDAR). 2009 205-226.
[6] Feldman R, Sanger J. The Text Mining Handbook. Advanced Approaches in Analyzing Unstructured Data. New York: Cambridge University Press; 2007.
[7] Liu B.Opinion Mining.Department of Computer Science, University of Illinois at Chicago, 851 S. Morgan Street, Chicago, IL 60607-0753. [8] Liu B. Sentiment Analysis and Subjectivity. In: Liu B. Handbook of Natural Language Processing. 2nd ed. Chicago 2010.
[9] Marcus PM, Santorini B, Marcinkiewizz MA. Building a Large Annotated Corpus of English : The Penn Treebank. Compational Linguistik. 1993 Jun;19:313-330.
[10] Ohana B, Tierney B. Sentiment Classification of Reviews Using SentiWordNet. Computer Science Common. 2009. [11] Pang B, Lee L, Vaithyanathan S. Thumbs up? Sentiment Classification using Machine Learning Techniques.
[12] Pang, B., Lee, L. Opinion Mining and Sentiment Analysis. Fondation and Trends in Information Retrieval Vol.2, No 1-2 (2008) 1-135. [13] Permadi Y. Kategorisasi Teks Menggunakan N-Gram untuk Dokumen Berbahasa Indonesia. 2008.
[14] Popescu AM, Etzioni O. Extracting Product Features and Opinion from Reviews. Proceesing of the Human Language Technology Conference and the Conference on Empirical Methods in Natural Language Processing. 2005.
[15] Soumen C. Mining The Web : Discovering Knowledge From Hypertext Data. San Francisco: Morgan Kaufmann Publisher; 2003. [16] Support Vector Machines. In: Data Mining : Teknik Pemanfaatan Data untuk Keperluan Bisnis.