Ba la n ce of Pa y m e n t s: Q4 a n d 2 0 0 6 ov e r a ll
_ _ _ _ _ _ _ _ _ _ _ _ _ _ _ _ _ _ _ _ _ _ _ _ _ _ _ _ _ _ _ _ _ _ _ _ _ _ _ _ _ _ _ _ _ _ _ _ _ _ _ _ _ _ _ _ _ _ _ _ _ _ _ _ _ _ _ _ _ _ _ _ _ _ _ _ _ _ _ _ _
? Th e cu r r e n t a ccou n t r e cor de d a US$ 2 .1 billion su r plu s in Q4 br in gin g t h e su r plu s for Ja n u a r y-D e ce m be r 2 0 0 6 t o US$ 9 .6 billion su r plu s ( 2 .6 % of Gy-D P) . Ke y fa ct or s in t h is pe r for m a n ce w e r e st r on g e x por t pe r for m a n ce a n d w e a k im por t de m a n d. This sur plus w as considerably lar ger t han in 2005 ( US$0.3 billion or 0.1% of GDP) , but in line w it h t he pr edict ion of Novem ber 2006 ( US$9.7 billion or 2.7% of GDP) .
? Th e on goin g e x pa n sion a r y cy cle in t h e w or ld e con om y con t r ibu t e d posit iv e ly t o I n don e sia ’s e x por t pe r for m a n ce . Expor t volum e and pr ices for m aj or non- oil and gas com m odit ies, such as r ubber , copper , coal, cr ude palm oil ( CPO) , m achinery , elect r onics, chem ical pr oduct s, and t ex t ile and t ext ile pr oduct s incr eased significant ly. Tot al non-oil/ gas expor t s- - of w hich t hese leading com m odit ies account for 64% - - gr ew by 23.3% ( y .o.y ) in Q4. Over all, non- oil/ gas expor t s gr ew by 20.7% in 2006, slight ly ahead of t he ear lier for ecast ( 19% ) .
? Oil pr ice s de clin e d in Q4 bu t t h e oil a n d ga s e x por t s in 2 0 0 6 w e r e n e v e r t h e le ss h igh e r t h a n in t h e pr e v iou s y e a r . Despit e subst ant ial decline in Q4, oil ex por t pr ices aver aged US$62.3/ bar r el in 2006
Indonesia's BOP
-4000 -3000 -2000 -1000 0 1000 2000 3000 4000 5000
Q1 Q2 Q3 Q4 Q1 Q2 Q3 Q4
2005 2006*
20000 25000 30000 35000 40000 45000
Current Acc. Cap & Fin Acc. Of f . Reserve (RHS)
com par ed t o US$52.0/ bar r el in 2005. The higher oil pr ice cont r ibut ed t o 9.4% gr ow t h in oil and gas expor t r ev enues. Dur ing t he year , oil expor t volum e declined as addit ional pr oduct ion fr om new oil fields w as insufficient t o offset falling pr oduct ion fr om br ow nfields. I n addit ion, gas ex por t v olum e also declined due t o low er pr oduct ion and m ount ing dem and for dom est ic consum pt ion.
? I m por t s pick e d u p in Q4 , a lt h ou gh im por t gr ow t h for t h e w h ole of 2 0 0 6 r e m a in e d low . Non- oil/ gas im port s clim bed by a st r ong 22.5% ( y .o.y ) in Q4. I m por t s of r aw m at er ials and capit al goods, w hich r ecor ded only sluggish gr ow t h in Q1- Q3 began t o acceler at e in Q4 in line w it h st r onger dom est ic dem and. This r ecent r ecover y in im por t dem and r esult ed in 7.1% gr ow t h in non- oil/ gas im por t s for t he y ear 2006, slight ly higher t han t he pr evious pr oj ect ion ( 4.0% ) . Never t heless, t his w as st ill ver y low com par ed t o 36% in 2005. Oil and gas im por t s clim bed 15.9% ( y .o.y ) in Q4 t o supply t he needs of t he gr ow ing dom est ic econom y , despit e an
Tr a de Ba la nce N on O il/ Ga s
- 20000 - 15000 - 10000 - 5000 0 5000 10000 15000 20000 25000
Q1 Q2 Q3 Q4 Q1 Q2 Q3 Q4
2005 2006*
Ex por t Non- Oil/ Gas I m p or t Non- Oil/ Gas Tr ade Balan ce Non - Oil/ Gas m illion USD
Trade Balance Oil & Gas
-3000 -2000 -1000 0 1000 2000 3000 4000
Q1 Q2 Q3 Q4 Q1 Q2 Q3 Q4
2005 2006*
ov er all 1.5% decline for 2006. This t r end is explained m ainly by low er dom est ic fuel consum pt ion w it h businesses expanding t heir use of non- fuel ener gy sour ces in t he w ake of t he fuel pr ice hike in Oct ober 2005.
? Th e se r v ice s a n d in com e de ficit s m ou n t e d h igh e r in 2 0 0 6 a lon gside a r e la t iv e ly st a ble su r plu s in cu r r e n t t r a n sfe r s. Key fact or s in t he incr eased ser vices deficit w er e r ising fr eight cost s for im por t s and t he decline in t our ist ar r ivals fr om 5.0 m illion in 2005 t o 4.9 m illion in 2006 caused par t ly by concer ns over bir d flu and nat ur al disast er s. The st r ong for eign dem and for dom est ic equit ies, gover nm ent bonds, and Bank I ndonesia Cer t ificat es ( SBI ) and t heir cor r esponding im pact on incom e pay m ent s cont r ibut ed t o t he incr eased deficit in incom e t r ansact ions. The slim increase in t he cur r ent t r ansfer s sur plus r esult ed fr om t he slight ly higher gr ow t h in w or ker r em it t ances com par ed t o t he r ise in incom e out flow s fr om for eigner s w or king in I ndonesia.
? Globa l liqu idit y a n d t h e st a ble dom e st ic m a cr oe con om ic e n v ir on m e n t con t r ibu t e d t o t h e la r ge r su r plu s in ca pit a l a n d fin a n cia l a ccou n t . On t he liabilit ies side, t he financial account r ecor ded a surplus of US$ 5.4 billion in Q4 and US$11.1 billion for 2006 over all. Aft er allow ance for over seas asset placem ent s, t he capit al and financial account r ecor ded a sur plus of US$2.2 billion in Q4 and US$2.5 billion for t he y ear 2006, w ell ahead of t he
US$0.3 billion sur plus in 2005. Dr iving t his
per for m ance w as st r ong for eign dem and for dom est ic secur it ies and r educed over seas asset placem ent s ( cur r encies and deposit s) . The lat t er w as
Foreign Direct Investment (FDI)
(3,000) (2,000) (1,000)
-1,000 2,000 3,000 4,000 5,000 6,000
Q1 Q2 Q3 Q4 Q1 Q2 Q3 Q4
2005 2006*
Inf l ow ( Equity & loan Disb.) Out f low (Debt Repayment ) Net f l ows
par t ly r eflect ing t he r ising needs for im por t paym ent s.
February, 2007
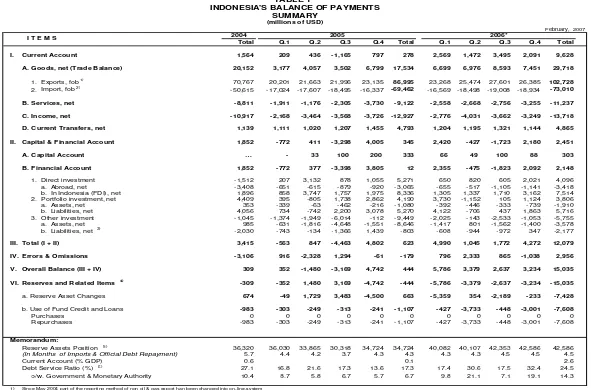
Total Q.1 Q.2 Q.3 Q.4 Total Q.1 Q.2 Q.3 Q.4 Total
I. Current Account 1,564 209 436 -1,165 797 278 2,569 1,472 3,495 2,091 9,628
A. Goods, net (Trade Balance) 20,152 3,177 4,057 3,502 6,799 17,534 6,699 6,976 8,593 7,451 29,718
1. Exports, fob 1) 70,767 20,201 21,663 21,996 23,135 86,995 23,268 25,474 27,601 26,385 102,728
2. Import, fob 2) -50,615 -17,024 -17,607 -18,495 -16,337 -69,462 -16,569 -18,498 -19,008 -18,934 -73,010
B. Services, net -8,811 -1,911 -1,176 -2,305 -3,730 -9,122 -2,558 -2,668 -2,756 -3,255 -11,237
C. Income, net -10,917 -2,168 -3,464 -3,568 -3,726 -12,927 -2,776 -4,031 -3,662 -3,249 -13,718
D. Current Transfers, net 1,139 1,111 1,020 1,207 1,455 4,793 1,204 1,195 1,321 1,144 4,865
II. Capital & Financial Account 1,852 -772 411 -3,298 4,005 345 2,420 -427 -1,723 2,180 2,451
A. Capital Account … - 33 100 200 333 66 49 100 88 303
B. Financial Account 1,852 -772 377 -3,398 3,805 12 2,355 -475 -1,823 2,092 2,148
1. Direct investment -1,512 207 3,132 878 1,055 5,271 650 820 605 2,021 4,096
a. Abroad, net -3,408 -651 -615 -879 -920 -3,065 -655 -517 -1,105 -1,141 -3,418
b. In Indonesia (FDI), net 1,896 858 3,747 1,757 1,975 8,336 1,305 1,337 1,710 3,162 7,514
2. Portfolio investment, net 4,409 395 -805 1,738 2,862 4,190 3,730 -1,152 105 1,124 3,806
a. Assets, net 353 -339 -63 -462 -216 -1,080 -392 -446 -333 -739 -1,910
b. Liabilities, net 4,056 734 -742 2,200 3,078 5,270 4,122 -706 437 1,863 5,716
3. Other investment -1,045 -1,374 -1,949 -6,014 -112 -9,449 -2,025 -143 -2,533 -1,053 -5,755
a. Assets, net 985 -631 -1,816 -4,648 -1,551 -8,646 -1,417 801 -1,562 -1,400 -3,578
b. Liabilities, net 3) -2,030 -743 -134 -1,366 1,439 -803 -608 -944 -972 347 -2,177
III. Total (I + II) 3,415 -563 847 -4,463 4,802 623 4,990 1,045 1,772 4,272 12,079
IV. Errors & Omissions -3,106 916 -2,328 1,294 -61 -179 796 2,333 865 -1,038 2,956
V. Overall Balance (III + IV) 309 352 -1,480 -3,169 4,742 444 5,786 3,379 2,637 3,234 15,035
VI. Reserves and Related Items 4) -309 -352 1,480 3,169 -4,742 -444 -5,786 -3,379 -2,637 -3,234 -15,035
a. Reserve Asset Changes 674 -49 1,729 3,483 -4,500 663 -5,359 354 -2,189 -233 -7,428
b. Use of Fund Credit and Loans -983 -303 -249 -313 -241 -1,107 -427 -3,733 -448 -3,001 -7,608
Purchases 0 0 0 0 0 0 0 0 0 0 0
Repurchases -983 -303 -249 -313 -241 -1,107 -427 -3,733 -448 -3,001 -7,608
Memorandum:
Reserve Assets Position 5) 36,320 36,030 33,865 30,318 34,724 34,724 40,082 40,107 42,353 42,586 42,586
(In Months of Imports & Official Debt Repayment) 5.7 4.4 4.2 3.7 4.3 4.3 4.3 4.3 4.5 4.5 4.5
Current Account (% GDP) 0.6 0.1 2.6
Debt Service Ratio (%) 6) 27.1 16.8 21.6 17.3 13.6 17.3 17.4 30.6 17.5 32.4 24.5
o/w. Government & Monetary Authority 10.4 8.7 5.8 6.7 5.7 6.7 9.8 21.1 7.1 19.1 14.3
1) Since May 2004 part of the reporting method of non oil & gas export han been changed into on-line-system 2) Since April 2004 part of the reporting method of non oil & gas import han been changed into on-line-system 3) Excluding the use of Fund credit and loans
4) Negative represents surplus and positive represents deficit. Since the first quarter of 2004, changes in reserve assets only cover data on changes due to transaction.
5) Based on Gross Foreign Asset concept replacing Official Reserve concept since 1998 and based on International Reserve and Foreign Currency Liquidity (IRFCL) concept since 2000 6) Ratio of external debt service payments to export of goods and services.
February, 2007
Q.1 Q.2 Q.3 Q.4 Total Q.1 Q.2 Q.3 Q.4 Total
Current Account 1,564 209 436 -1,165 797 278 2,569 1,472 3,495 2,091 9,628
A. Goods, net (Trade Balance) 20,152 3,177 4,057 3,502 6,799 17,534 6,699 6,976 8,593 7,451 29,718
- Non Oil and Gas 15,026 2,206 3,072 3,151 4,892 13,321 4,201 5,744 7,267 6,141 23,353
- Oil and Gas 5,126 971 984 351 1,907 4,212 2,497 1,232 1,326 1,310 6,365
Exports, fob 70,767 20,201 21,663 21,996 23,135 86,995 23,268 25,474 27,601 26,385 102,728
- Non Oil and Gas 1)
54,482 15,581 17,010 16,609 17,552 66,753 17,751 19,561 21,621 21,645 80,578
- Oil and Gas 16,285 4,619 4,653 5,387 5,583 20,243 5,517 5,913 5,981 4,739 22,150
Imports, fob -50,615 -17,024 -17,607 -18,495 -16,337 -69,462 -16,569 -18,498 -19,008 -18,934 -73,010
- Non Oil and Gas 2)
-39,456 -13,375 -13,938 -13,458 -12,660 -53,431 -13,550 -13,817 -14,354 -15,504 -57,224
- Oil and Gas -11,159 -3,649 -3,668 -5,037 -3,677 -16,030 -3,019 -4,682 -4,655 -3,429 -15,785
B. Services, net -8,811 -1,911 -1,176 -2,305 -3,730 -9,122 -2,558 -2,668 -2,756 -3,255 -11,237
1. Transportation, net -3,195 -1,223 -1,190 -1,143 -1,052 -4,609 -1,305 -1,513 -1,551 -1,676 -6,046
a. Freight, net -2,924 -1,138 -1,097 -1,135 -961 -4,331 -1,110 -1,313 -1,329 -1,319 -5,072
b. Passenger and Other, net -270 -86 -94 -7 -92 -278 -195 -200 -222 -357 -974
2. Travel, net 1,291 110 360 467 0 938 143 311 331 32 817
a. Inflow 4,798 1,102 1,152 1,286 981 4,522 983 1,142 1,162 1,161 4,448
b. Outflow -3,507 -992 -792 -819 -981 -3,584 -840 -830 -831 -1,129 -3,631
3. Other services, net -6,907 -798 -345 -1,630 -2,678 -5,451 -1,395 -1,466 -1,536 -1,611 -6,008
C. Income, net -10,917 -2,168 -3,464 -3,568 -3,726 -12,927 -2,776 -4,031 -3,662 -3,249 -13,718
1. Compensation of employees 28 -32 -28 -48 -112 -221 -23 -16 -44 -54 -137
2. Investment income -10,945 -2,136 -3,436 -3,520 -3,614 -12,706 -2,753 -4,015 -3,618 -3,194 -13,581
a. Direct investment -8,220 -1,791 -2,282 -2,567 -2,676 -9,316 -2,226 -2,847 -2,501 -2,035 -9,610
b. Portfolio investment 1,062 121 -181 -253 -144 -456 -96 -253 -696 -285 -1,330
c. Other investment -3,787 -466 -973 -701 -794 -2,933 -432 -915 -421 -874 -2,642
o/w Government & Monetary Authority interest payments -2,836 -564 -781 -506 -816 -2,667 -465 -898 -415 -814 -2,592
D. Current Transfers, net 1,139 1,111 1,020 1,207 1,455 4,793 1,204 1,195 1,321 1,144 4,865
1. Government, net 296 0 2 5 36 44 4 9 5 3 20
2. Other sectors, net 842 1,111 1,018 1,202 1,418 4,749 1,200 1,187 1,317 1,141 4,844
a. Workers' Remittances, net 925 1,052 969 1,143 1,298 4,462 1,135 1,105 1,202 1,078 4,520
b. Other transfers, net -82 59 49 58 121 288 66 81 115 63 325
Memorandum:
Non Oil and Gas Export Growth, fob (%) 11.5 22.5 20.7
Non Oil and Gas Import Growth, c&f (%) 26.7 36.0 7.1
Oil Unit Prices (USD/barrel) 36.8 45.8 50.5 57.5 54.0 52.0 60.1 67.6 66.0 55.4 62.3
Oil Production (millions barrel per day) 1,086 1,067 1,042 1,048 1,059 1,054 1,035 1,023 981 990 1,007
Tourist Inflows (thousand people) 5,321 1,219 1,274 1,423 1,086 5,002 1,076 1,251 1,273 1,272 4,871
February, 2007
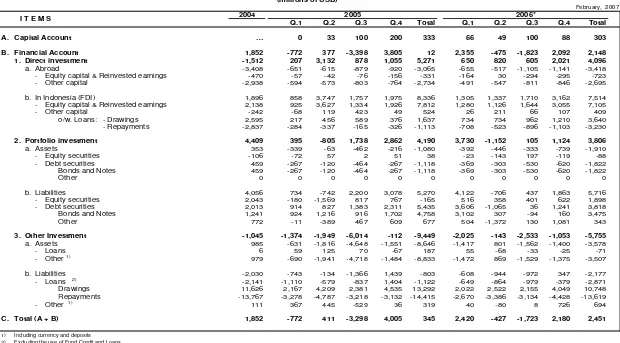
Q.1 Q.2 Q.3 Q.4 Total Q.1 Q.2 Q.3 Q.4 Total
A. Capital Account … 0 33 100 200 333 66 49 100 88 303
B. Financial Account 1,852 -772 377 -3,398 3,805 12 2,355 -475 -1,823 2,092 2,148
1. Direct investment -1,512 207 3,132 878 1,055 5,271 650 820 605 2,021 4,096
a. Abroad -3,408 -651 -615 -879 -920 -3,065 -655 -517 -1,105 -1,141 -3,418
- Equity capital & Reinvested earnings -470 -57 -42 -76 -156 -331 -164 30 -294 -295 -723
- Other capital -2,938 -594 -573 -803 -764 -2,734 -491 -547 -811 -846 -2,695
b. In Indonesia (FDI) 1,896 858 3,747 1,757 1,975 8,336 1,305 1,337 1,710 3,162 7,514
- Equity capital & Reinvested earnings 2,138 925 3,627 1,334 1,926 7,812 1,280 1,126 1,644 3,055 7,105
- Other capital -242 -68 119 423 49 524 26 211 66 107 409
o/w. Loans: - Drawings 2,595 217 456 589 376 1,637 734 734 962 1,210 3,640
- Repayments -2,837 -284 -337 -165 -326 -1,113 -708 -523 -896 -1,103 -3,230
2. Portfolio investment 4,409 395 -805 1,738 2,862 4,190 3,730 -1,152 105 1,124 3,806
a. Assets 353 -339 -63 -462 -216 -1,080 -392 -446 -333 -739 -1,910
- Equity securities -106 -72 57 2 51 38 -23 -143 197 -119 -88
- Debt securities 459 -267 -120 -464 -267 -1,118 -369 -303 -530 -620 -1,822
Bonds and Notes 459 -267 -120 -464 -267 -1,118 -369 -303 -530 -620 -1,822
Other 0 0 0 0 0 0 0 0 0 0 0
b. Liabilities 4,056 734 -742 2,200 3,078 5,270 4,122 -706 437 1,863 5,716
- Equity securities 2,043 -180 -1,569 817 767 -165 516 358 401 622 1,898
- Debt securities 2,013 914 827 1,383 2,311 5,435 3,606 -1,065 36 1,241 3,818
Bonds and Notes 1,241 924 1,216 916 1,702 4,758 3,102 307 -94 160 3,475
Other 772 -11 -389 467 609 677 504 -1,372 130 1,081 343
3. Other Investment -1,045 -1,374 -1,949 -6,014 -112 -9,449 -2,025 -143 -2,533 -1,053 -5,755
a. Assets 985 -631 -1,816 -4,648 -1,551 -8,646 -1,417 801 -1,562 -1,400 -3,578
- Loans 6 59 125 70 -67 187 55 -68 -33 -25 -71
- Other 1) 979 -690 -1,941 -4,718 -1,484 -8,833 -1,472 869 -1,529 -1,375 -3,507
b. Liabilities -2,030 -743 -134 -1,366 1,439 -803 -608 -944 -972 347 -2,177
- Loans 2) -2,141 -1,110 -579 -837 1,404 -1,122 -649 -864 -979 -379 -2,871
Drawings 11,626 2,167 4,209 2,381 4,535 13,292 2,022 2,522 2,155 4,049 10,748
Repayments -13,767 -3,278 -4,787 -3,218 -3,132 -14,415 -2,670 -3,386 -3,134 -4,428 -13,619
- Other 1) 111 367 445 -529 36 319 40 -80 8 726 694
C. Total (A + B) 1,852 -772 411 -3,298 4,005 345 2,420 -427 -1,723 2,180 2,451
1) Including currency and deposits 2) Excluding the use of Fund Credit and Loans
* Provisional figures
** Very provisional figures
- Not available
… Data are not available yet
TABLE 3
INDONESIA'S BALANCE OF PAYMENTS CAPITAL AND FINANCIAL ACCOUNT
(millions of USD)
2006*
February, 2007
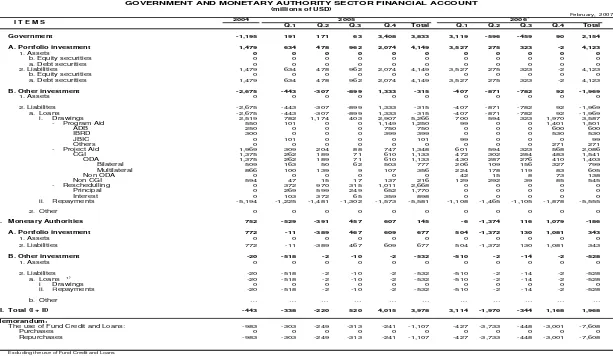
Q.1 Q.2 Q.3 Q.4 Total Q.1 Q.2 Q.3 Q.4 Total I. Government -1,195 191 171 63 3,408 3,833 3,119 -596 -459 90 2,154 A. Portfolio investment 1,479 634 478 962 2,074 4,149 3,527 275 323 -2 4,123
1. Assets 0 0 0 0 0 0 0 0 0 0 0
b. Equity securities 0 0 0 0 0 0 0 0 0 0 0
a. Debt securities 0 0 0 0 0 0 0 0 0 0 0
2. Liabilities 1,479 634 478 962 2,074 4,149 3,527 275 323 -2 4,123
b. Equity securities 0 0 0 0 0 0 0 0 0 0 0
a. Debt securities 1,479 634 478 962 2,074 4,149 3,527 275 323 -2 4,123
B. Other investment -2,675 -443 -307 -899 1,333 -315 -407 -871 -782 92 -1,969
1. Assets 0 0 0 0 0 0 0 0 0 0 0
2. Liabilites -2,675 -443 -307 -899 1,333 -315 -407 -871 -782 92 -1,969
a. Loans -2,675 -443 -307 -899 1,333 -315 -407 -871 -782 92 -1,969
i. Drawings 2,519 782 1,174 403 2,907 5,266 700 594 323 1,970 3,587
- Program Aid 550 101 0 0 1,149 1,250 99 0 0 1,401 1,501
ADB 250 0 0 0 750 750 0 0 0 600 600
IBRD 300 0 0 0 399 399 0 0 0 530 530
JBIC 0 101 0 0 0 101 99 0 0 0 99
Others 0 0 0 0 0 0 0 0 0 271 271
- Project Aid 1,969 309 204 88 747 1,348 601 594 323 568 2,086
CGI 1,375 262 189 71 610 1,133 472 302 284 483 1,541
ODA 1,375 262 189 71 610 1,133 430 287 276 410 1,403
Bilateral 509 163 50 62 503 777 206 109 156 327 799
Multilateral 866 100 139 9 107 356 224 178 119 83 605
Non ODA 0 0 0 0 0 0 42 15 8 73 138
Non CGI 594 47 15 17 137 216 129 292 39 85 545
- Reschedulling 0 372 970 315 1,011 2,668 0 0 0 0 0
Principal 0 269 599 249 652 1,770 0 0 0 0 0
Interest 0 103 372 65 359 898 0 0 0 0 0
ii. Repayments -5,194 -1,225 -1,481 -1,302 -1,573 -5,581 -1,108 -1,465 -1,105 -1,878 -5,555
2. Other 0 0 0 0 0 0 0 0 0 0 0
II. Monetary Authorities 752 -529 -391 457 607 145 -6 -1,374 116 1,079 -186 A. Portfolio investment 772 -11 -389 467 609 677 504 -1,372 130 1,081 343
1. Assets 0 0 0 0 0 0 0 0 0 0 0
2. Liabilities 772 -11 -389 467 609 677 504 -1,372 130 1,081 343
B. Other investment -20 -518 -2 -10 -2 -532 -510 -2 -14 -2 -528
III. Total (I + II) -443 -338 -220 520 4,015 3,978 3,114 -1,970 -344 1,168 1,968 Memorandum:
The use of Fund Credit and Loans: -983 -303 -249 -313 -241 -1,107 -427 -3,733 -448 -3,001 -7,608
Purchases 0 0 0 0 0 0 0 0 0 0 0
Repurchases -983 -303 -249 -313 -241 -1,107 -427 -3,733 -448 -3,001 -7,608
1) Excluding the use of Fund Credit and Loans
* Provisional figures
GOVERNMENT AND MONETARY AUTHORITY SECTOR FINANCIAL ACCOUNT
(millions of USD)
February, 2007
Total Q.1 Q.2 Q.3 Q.4 Total Q.1 Q.2 Q.3 Q.4 Total
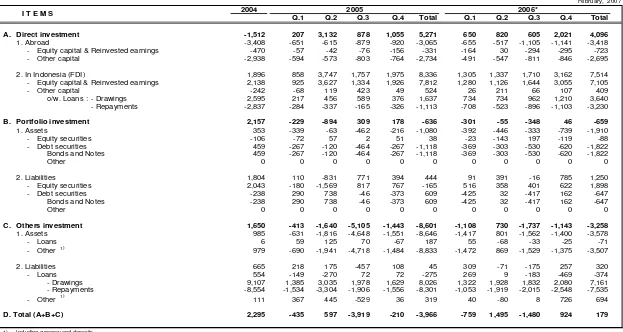
A. Direct investment -1,512 207 3,132 878 1,055 5,271 650 820 605 2,021 4,096
1. Abroad -3,408 -651 -615 -879 -920 -3,065 -655 -517 -1,105 -1,141 -3,418
- Equity capital & Reinvested earnings -470 -57 -42 -76 -156 -331 -164 30 -294 -295 -723
- Other capital -2,938 -594 -573 -803 -764 -2,734 -491 -547 -811 -846 -2,695
2. In Indonesia (FDI) 1,896 858 3,747 1,757 1,975 8,336 1,305 1,337 1,710 3,162 7,514
- Equity capital & Reinvested earnings 2,138 925 3,627 1,334 1,926 7,812 1,280 1,126 1,644 3,055 7,105
- Other capital -242 -68 119 423 49 524 26 211 66 107 409
o/w. Loans : - Drawings 2,595 217 456 589 376 1,637 734 734 962 1,210 3,640
- Repayments -2,837 -284 -337 -165 -326 -1,113 -708 -523 -896 -1,103 -3,230
B. Portfolio investment 2,157 -229 -894 309 178 -636 -301 -55 -348 46 -659
1. Assets 353 -339 -63 -462 -216 -1,080 -392 -446 -333 -739 -1,910
- Equity securities -106 -72 57 2 51 38 -23 -143 197 -119 -88
- Debt securities 459 -267 -120 -464 -267 -1,118 -369 -303 -530 -620 -1,822
Bonds and Notes 459 -267 -120 -464 -267 -1,118 -369 -303 -530 -620 -1,822
Other 0 0 0 0 0 0 0 0 0 0 0
2. Liabilities 1,804 110 -831 771 394 444 91 391 -16 785 1,250
- Equity securities 2,043 -180 -1,569 817 767 -165 516 358 401 622 1,898
- Debt securities -238 290 738 -46 -373 609 -425 32 -417 162 -647
Bonds and Notes -238 290 738 -46 -373 609 -425 32 -417 162 -647
Other 0 0 0 0 0 0 0 0 0 0 0
C. Others investment 1,650 -413 -1,640 -5,105 -1,443 -8,601 -1,108 730 -1,737 -1,143 -3,258
1. Assets 985 -631 -1,816 -4,648 -1,551 -8,646 -1,417 801 -1,562 -1,400 -3,578
- Loans 6 59 125 70 -67 187 55 -68 -33 -25 -71
- Other 1) 979 -690 -1,941 -4,718 -1,484 -8,833 -1,472 869 -1,529 -1,375 -3,507
2. Liabilities 665 218 175 -457 108 45 309 -71 -175 257 320
- Loans 554 -149 -270 72 72 -275 269 9 -183 -469 -374
- Drawings 9,107 1,385 3,035 1,978 1,629 8,026 1,322 1,928 1,832 2,080 7,161
- Repayments -8,554 -1,534 -3,304 -1,906 -1,556 -8,301 -1,053 -1,919 -2,015 -2,548 -7,535
- Other 1) 111 367 445 -529 36 319 40 -80 8 726 694
D. Total (A+B+C) 2,295 -435 597 -3,919 -210 -3,966 -759 1,495 -1,480 924 179
1) Including currency and deposits
* Provisional figures
** Very provisional figures
- Not available
… Data are not available yet
TABLE 5
INDONESIA'S BALANCE OF PAYMENTS PRIVATE SECTOR FINANCIAL ACCOUNT
(millions of USD)
2006*