Left-Handed
Some Sinister Results
Kevin Denny
Vincent O’ Sullivan
a b s t r a c t
This paper estimates the effects of handedness on earnings. Augmenting a conventional earnings equation with an indicator of left-handedness shows there is a positive effect on male earnings with manual workers enjoying a slightly larger premium. These results are inconsistent with the view that left-handers in general are handicapped either innately or through experi-encing a world geared toward right-handers. Left-handed females however are paid significantly less. The results are consistent with a range of mostly psychological evidence, which suggests that left-hander males have partic-ular talents such as enhanced creativity.
I. Introduction
This paper provides estimates of the impact of left-handedness on earnings. In the canonical model of the determinants of an individual’s earnings prin-cipally associated with Becker, Mincer, and many others, earnings are determined by a relatively small number of variables, notably education and work experience or age. However, it has long been the practice to augment the empirical models with a variety of covariates. Some of these are uncontentious, such as controls for cogni-tive ability, while others raise deeper theoretical questions. Recent work on the deter-minants of earnings (for example, Carneiro and Heckman 2004) has argued that there are important effects of noncognitive skills on earnings. In general, economists have
Kevin Denny is a senior lecturer in the School of Economics, University College Dublin (UCD) and is a research fellow at the Geary Institute (UCD) and the Institute for Fiscal Studies, London. Vincent O’Sullivan is a postgraduate student in the Economics Department, University of Warwick. They thank seminar participants at UCD, Trinity College Dublin, the universities of Copenhagen and Surrey, Marian Annett, Orla Doyle, Chris McManus, and the referees for comments. Permission to use the National Child Development Survey given by the ESRC Data Archive at Essex is gratefully acknowledged.
[Submitted August 2004; accepted June 2006]
ISSN 022-166X E-ISSN 1548-8004Ó2007 by the Board of Regents of the University of Wisconsin System
avoided the use of other psychometric measures in earnings equations, partly due to a lack of data but also because of the lack of an appropriate theoretical framework.
Although the use of behavioral variables and/or psychometric measures is unusual, it is becoming less esoteric: Bowles, Gintis, and Osbourne (2001) survey the growing research on the behavioral determinants of wages. Some of the literature analyzes the effects of character traits such as withdrawal and aggression on earnings, while others include psychometric indices such as the Rotter index of locus of control as well as Machiavellian intelligence—the ability to manipulate other people.1 Al-though the notion that temperament or behavioral characteristics matter for an indi-vidual will come as no surprise to psychologists (among others), it has been relatively slow in having an impact on empirical economics. A parallel recent development has been the rise of neuroeconomics, which involves applying neuroscience to the study of economic decisions. For example, functional Magnetic Resonance Imaging (fMRI) has been used to see which parts of the brain are activated while a subject plays simple Prisoner Dilemma games.2
This paper contributes to work linking the brain with economics by looking at one particular feature of individuals that relates to the brain: laterality. In particular, we ask whether left-handed people are paid more or less than right-handers, controlling for the usual variables that appear in a conventional earnings equation. Our reasons for focusing on left-handedness are partly data-driven: aside from other measures of laterality, it is the only characteristic available in a large data set, which also includes the labor market data necessary for the investigation. Secondly, left-handedness has generated a significant body of scientific research and as discussed below there are grounds for arguing that there may be a connection between it and labor market out-comes. In the next section we discuss some of the scientific background to left-hand-edness and why it might matter in the labor market.
It might be argued that the inclusion of laterality in an earnings equation is ad hoc since it lacks a strong theoretical foundation.3If so, the same argument applies to the inclusion of variables such as stature, beauty and sexual orientation, which have been increasingly used in earnings studies. The idea that features of the brain should in-fluence one’s experiences in economic and social life, although currently untested, is hardly controversial. Recent work on lifecycle skill formation builds directly on neuroscientific findings on how brains learn and are influenced by their environment (see Cunha et al. 2005).
II. Laterality
Laterality is the scientific term for ‘‘sidedness,’’ the characteristic of many objects and living things in which there is an asymmetry between one side and the other. The most obvious examples are in the animal kingdom where many species
1. Turner and Martinez (1977) find positive returns to this characteristic for highly educated individuals and negative returns for those with low education. Mueller and Plug (2004) look at the returns to personality. 2. See Glimcher (2003) for an introduction and Rubinstein (2006) for an alternative view.
have important asymmetries. While humans and other primates appear symmetric from the front or back their inner organs are arranged asymmetrically. External asymmetries in humans are more subtle: The left and right side of the face are not quite mirror images and there are systematic differences in, among other things, feet, gonads, and fingerprints.
In terms of biology, especially human, there is a very large literature examining the incidence, causes, and correlates of laterality. The form that most people are fa-miliar with is handedness. While most people identify this with whether an individ-ual writes with the left or right hand researchers stress the existence of a continuum of handedness because many people will use different hands for different tasks. Aside from handedness, other forms of laterality exist, such as footedness as well as eye dominance; the interrelationship between different lateralities is the subject of much research (see, for example, Bourassa, McManus, and Bryden 1996).
The existence of handedness has a long historical tradition, with references to it appearing in the works of Socrates and the Old Testament, for example. A consistent feature is the association between left-handedness and either abnormality or evil. The clearest example is the Latin word for left, sinister, and its French equivalent, gauche. Such associations occur in numerous languages. By contrast, to be dextrous (literally right-handed) is to be physically adept and a key aide is likely to be one’s ‘‘right hand man.’’ The idea of left-handers being clumsy is pervasive. The British psychol-ogist Sir Cyril Burt declared: ‘‘Not infrequently the left handed child shows wide-spread difficulties in almost every form of fine muscular coordination. . Awkward in the house and clumsy in their games, they are fumblers and bunglers in almost everything they do.’’4One explanation for this could be that left-handers tend to turn in the opposite direction to right-handers (anticlockwise and clockwise respectively) so they are more likely to bump into people.
The degree to which left-handedness is stigmatized varies from culture to culture and also depends on religion but it is virtually universal. Children who wish to write with their left hand have often been forced to use the other hand. Because the vast majority of people are right-handed, it is not surprising that the world is geared to-ward the needs of right-handers. The extent to which it is so can be surprising, as it is often subtle. However, most right-handers are oblivious to it. Many tools and basic pieces of equipment such as corkscrews, knives, surgical instruments, computer key-boards, and pencils are designed for right-handers. Power tools and firearms are gen-erally designed with right-handers in mind by the location of the key switches and safety catches. So it may be the difficulty of left-handers using right-handed equip-ment that has given rise to the idea that they are clumsy.
The incidence of left-handedness varies across culture, by sex, and over time. Typ-ically, 10 percent of the population would be classified (or classify themselves) as left-handed, with a somewhat higher incidence among males than among females. There is a lower incidence in eastern cultures, which may reflect greater cultural re-sistance to left-handers. Some ingenious analysis of paintings and sculptures suggest that this incidence has not changed much over the last 5,000 years (Coren and Porac 1977), although there is evidence that it rose in the twentieth century.5This appears
4. Quoted in Coren (1993) p. 244.
to reflect the diminishing tendency for left-handed children to be forced to write with their right hand. Anthropological evidence suggests that right dominance extends back to the earliest hominids, such as Australopithecus africanus (see Annett 2002, p.11).
The scientific literature on laterality is extensive and only a few aspects will be touched on here.6 One issue that should be mentioned is the debate on the causes of left-handedness since this has direct implications for how it might influence earn-ings. There is a variety of possible explanations for left-handedness. It is well known that left-handedness partly runs in families, which suggests a possible genetic basis. Published estimates of the proportion of the variation in handedness attributable to genetics vary between 23 percent and 66 percent. Bryden et al. (1997) discuss several genetic models of the inheritability of handedness.
An early theory of the causes of left-handedness is that birth stress plays a key role (for example, Bakan, Dibb, and Reed 1973). The argument is that if, during birth, there is damage to the left side of the skull as it passes through the birth canal, then this may be sufficient to cause an individual to switch from being a right-hander, since our brains are ‘‘contra-lateral,’’ that is, the left hemisphere is normally respon-sible for the right side and vice versa. Damage to the right side would have no effect except in the small number of left-handed individuals. Not surprisingly, the sugges-tion that left-handers are, in effect, brain damaged, is controversial. If true, it would suggest that left-handedness is a marker for the presence of neurological impairment and this is consistent with evidence on various other conditions that have a higher incidence among left-handers. However, there is a great deal of variation in the in-cidence of birth stress (due, for example, to variations in obstetric practice) and this is not correlated with the incidence of left-handedness. A more recent environmental theory is that exposure to ultrasound in utero, may increase the incidence of handedness (see Rothman 2001). It is likely that there is a variety of types of left-handedness, which may explain the often-inconsistent results in the literature on characteristics of that population.
Why might laterality in general and handedness in particular matter for economic outcomes such as earnings? There are two basic reasons for thinking that left-handed-ness may be associated with bad outcomes in life: environmental (that is, the world is geared toward right-handers) or biological (that is, left-handedness is a marker for some underlying deficit). The environmental theory is based on a long tradition of historical and scientific evidence that left-handers experience both prejudice and also practical difficulties largely because they are a small minority and many aspects of the environment are constructed to suit right-handers. Coren and Previc (1989) and Coren (1996) show a higher incidence of accidents occurring to left-handers in samples of U.S. military personnel and university students respectively. However, this finding has not been found in other studies (see, for example, Hicks et al. 1993, Barnes et al. 1998, and Pekkarinen, Salminen, and Ja¨rvelin 2003), so it is not clear that this holds generally.
The biological argument comes in several forms. First, numerous studies find that left-handedness is associated with various undesirable outcomes such as low cogni-tive ability (Hardyck, Petrinovich, and Goldman 1976, McManus and Mascie-Taylor
1983), as well as a number of unusual and sometimes pathological conditions. For example, a higher incidence of left-handedness is found among groups with a history of alcoholism, autism, criminality, depression, homosexuality, immune diseases, psy-chosis, and schizophrenia to mention but a few.7One theory, then, is that left-hand-edness is a marker for the presence of other pathologies in the individual that have been caused by some other means, such as the birth stress theory discussed above. In effect, then, a negative relationship between left-handedness and earnings may not be causal but may point to the existence of some other underlying condition. Porac and Searlman (2002) find that left-handers do not experience a lower quality of life in terms of psychological health, physical health, or cognitive performance although Bryden, Bruyn, and Fletcher (2005) find that nonright-handers are significantly more likely to report specific disorders (such as epilepsy and hypertension). Some early research that suggested a lower life expectancy among left-handers has not been supported by extensive subsequent work (see Ellis et al. 1998 or Peto 1994, for example).
So far, so bad for the southpaw. Is there an upside? Given the persistence of left-handedness over a long period of time (and its heritability) then Darwinian natural selection would suggest that if there are costs associated with left-handedness then there would be benefits too.8 There is considerable evidence that left-handedness conveys a variety of advantages. Benbow (1986) finds a higher incidence of left-handers among the extremely intellectually precocious, based on those in the top 0.01 percent of students taking the American Scholastic Aptitude Test before age 13. The difference (relative to a control group) was greater for those who were ver-bally precocious rather than mathematically precocious. Similarly, Hicks and Dusek (1980) examine the handedness of gifted and nongifted children (gifted being defined as having an I.Q. greater than 131) and find a lower incidence of right-handedness among the gifted children. However, given the small numbers involved this is un-likely to have much effect on earnings especially if one conditions on cognitive abil-ity. Annett and Manning (1989), using a continuous (rather than binary) measure of laterality, find that those toward the dextral (right) end of the continuum were poorer on tests of intelligence, languages and other abilities.9There are advantages in cer-tain competitive situations precisely because left-handers are in a minority—for ex-ample, cricket and fighting (see Brooks et al. 2004 and Faurie and Raymond 2005, respectively).
A recurring theme in popular accounts of left-handedness is that they are more creative or talented. Numerous web sites listing famous left-handers attest to the prevalence of this view. Is there more systematic evidence for this relationship?
7. See Coren (1993), chapter 9. The list is not definitive or exhaustive and some of these associations are disputed. An exception is the finding that left-handers have a lower incidence of arthritis and ulcers (see McManus and Wysocki 2005).
8. This theory, that left-handedness is a ‘‘balanced polymorphism,’’ is developed in detail by Annett (2002). The classic example of this phenomenon is sickle cell anemia, which carries with it some protection against malaria. Similar arguments have been made for manic depression and schizophrenia.
Conventional intelligence testing is not suited to answering this question, since it relies on solving questions to which there are unique well-defined answers—that is, it tests ‘‘convergent thinking.’’ Divergent thinking, by contrast, requires an indi-vidual to work outward toward some unexplored association, such as asking someone to think of novel uses of a household object. A number of papers find evidence that creativity is higher among left-handers (for example, Newland 1981 and Coren 1995). Newland (1981) uses the Torrance tests of Creative Thinking and finds a higher score for left-handers in all four domains (fluency, flexibility, originality, and elabora-tion). A disadvantage of the approach taken in this paper is that these tests are ‘‘figural’’; they depend on processing visual information and hence may be confounded by spatial abilities, generally believed to be higher among left-handers.
Coren (1995) uses tests that do not involve spatial reasoning or drawing. This pa-per makes the important finding that creativity (specifically ‘‘divergent thinking’’) is associated with left-handedness in males only. These findings on creativity are also consistent with research that shows that, particularly in males, the right frontal lobes are critical for cognitive novelty—dealing with new tasks or situations where the brain’s existing ‘‘repertoire’’ cannot be applied. The left lobes, by contrast, deal with cognitive routinization—situations that the brain is familiar with and has preexisting strategies to use. The evidence is that left-handers differ in cognitive styles rather than cognitive abilities—specifically that left-handers (particularly males) are nov-elty seekers.10Sex-handedness interactions such as the above are common in the lit-erature. For example, Faurie, Vianey-Liaud, and Raymond (2006) find that a negative correlation between left-handedness and several measures of school performance and leadership skills for girls but a positive association for boys. Sanders, Wilson and Vandenberg (1982) find the same pattern with regard to handedness and spatial abil-ity. This pattern in the literature would lead one to expect that the effects on earnings may differ by sex and specifically, be favorable to male left-handers but not female left-handers.
Another candidate explanation for left-handed advantage relates to brain morphol-ogy. The main connection between the two hemispheres of the brain is a thick band called the corpus callosum; this is about seven centimetres in length and contains about 200-250 million axons that allow the cortical regions of the two hemispheres to communicate. In a series of papers, Witelson (1985,1989) and Witelson and Gold-smith (1991) found that it is significantly larger in left-handers (more precisely, non-consistent right-handers compared with non-consistent right-handers) among males but not females.
It has been hypothesized that this callosal size difference could allow more rapid interhemispheric processing. This is based on the assumption that the difference in size is due to a greater number of axons. There are other explanations for this finding. Axons are usually covered in a fatty sheath called myelin that acts as electrical insu-lation. It is possible that differences in callosal size are due to greater myelination or to thicker axons. However, the evidence that exists suggests that callosal size is a good proxy for the number of axons (see Aboitiz et al. 1992). Hines et al. (1992) provide direct evidence of a relationship between callosal size and superior verbal fluency. It also has been hypothesized that greater interhemispheric processing could
be the source of superior memory and there is evidence that those with familial left-handedness have advantages in some form of memory (see Christman and Propper 2001).11
The above arguments may be summarized as follows: Environmental effects, if any, on earnings are likely to be negative for left-handers. As a marker for some un-derlying pathology, left-handedness also might predict lower wages. There are sev-eral possible sources of advantage, however (for example, higher creativity and greater connective tissue in the brain), and these occur primarily for males only, so any negative effect is likely to be smaller or absent for males.
One argument that is frequently suggested but has not been studied may be called the ‘‘advantage of being disadvantaged’’ theory. Assume that both left-handers and right-handers each possess a certain set of abilities. Given that the environment is geared toward right-handers, left-handers have an incentive to invest effort in acquir-ing additional skills, naturally possessed by right-handers that may foster creative be-havior (see Peterson and Lansky 1977). It follows that they may end up with a higher overall level of ability. This is consistent with a theory of competency that argues that individuals are motivated to achieve competency as a desire to master their environ-ment (see White 1971). This theory would predict some advantage to being left-handed. Moreover, it seems plausible that the advantage would be greater for manual workers since, effectively, they would be at more of a disadvantage in the first place.12 It has been long established that some brain functions are localized in particular areas. For example, language is largely located in the left hemisphere and it is known that the left side of the body is controlled by the right hemisphere and vice versa. Sub-sequent work has shown that to some extent the left hemisphere is specialized for ver-bal, analytical, abstract thinking while the right hemisphere specializes for nonverbal (visual/spatial), holistic, intuitive thinking. However, the popular idea that individuals have dominant hemispheres so that one hears of ‘‘left brained’’ and ‘‘right brained’’ people, the latter being invariably more creative, artistic or emotional, grossly over-simplifies a more complex relationship between the hemispheres. Since the left side of the body is controlled by the right side of the brain (and vice versa), hemisphericity is consistent with the folklore of greater artistic and creative abilities of left-handers.
III. Data
Our analysis is based on the 1958 National Child Development Sur-vey (NCDS), a longitudinal study of all persons living in Great Britain born March 3–9, 1958. The 1958 perinatal mortality survey has been followed by six subsequent waves (NCDS 1–6) at age 7, 11, 16, 23, 33, and the most recent, at ages 41–42. NCDS 1–3 included interviews with the child, his parents, his school, and the report of a medical examiner. These data are an exceptionally rich source on child devel-opment from birth to early adolescence, childcare, medical care, health, physical sta-tistics, home environment, educational progress, parental involvement, cognitive and
11. The literature on cognitive correlates of left-handedness is vast with often-inconsistent findings (see Harris 1992 for an overview).
social growth, family relationships, etc. NCDS Waves 4–6 are based largely on inter-views with the cohort member and his/her partner. They document economic activity, income, training, housing, as well as the development of the cohort member’s own family.
The analysis is carried out separately for men and women. For males, we exclude part-time workers because they would be less than 1 percent of the sample. For females, they are included because they are around 25 percent of the sample. Only individuals with nonmissing observations for all variables used in our study have been included. Descriptive statistics are provided in Tables 1 and 2 for men and women respectively. Although missing values reduce the sample size considerably, the means for the entire sample and the mean used in the empirical work are in most cases quite similar. Exceptions exist—for example, both men and women with chil-dren are overrepresented relative to the entire sample (67 percent in the sample and 42 percent overall for the males).
The dependent variable is the natural log of hourly earnings in 1991. A trimming of the earnings data at the top and bottom five percentiles took place to eliminate the effects of extreme values that we considered suspect.
Three forms of human capital are included in the model: schooling, cognitive abil-ity, and experience. The years of schooling variable was calculated from the monthly economic activity information recorded from 1974 to 1981. Respondents reporting school leaving ages younger than 16 (the legal minimum) were dropped from the sample since the legal minimum was generally very well enforced.
The measure of ability is based on three separate tests, a mathematics test taken at age seven (taken from the Problem Arithmetic Test of Pringle et al. 1966) and tests of verbal and nonverbal ability taken at age 11 (taken from the General Ability Test of Douglas 1964). We use the first Principal Component of the three. Unlike other NCDS studies (for example, Dearden 1999), we include a measure of work experi-ence that was calculated by examining the detailed employment history of the cohort member since leaving school. The effects of experience were incorporated into the model in the usual quadratic form. The other controls are type of school attended, union membership, marital status, parental status, and for women, whether she is a part time worker.
The data set contains several laterality variables. Laterality has many different dimensions and degrees. The variable used in this study is the parent’s opinion of the child’s laterality at age seven. In introducing laterality into the model, one has to note that the measurement of it is not simple. Ideally, one constructs a laterality profile or inventory that measures the extent to which one is left- or right-dominant. This will depend not just on hand use but also on eye and foot use (people have a dominant foot and a dominant eye) and will vary in the number and nature of func-tions with which they use their hands. A ‘‘weak left-hander’’ might use the left hand for writing but otherwise use the right hand for most other tasks. The data contain measurements of foot and eye dominance and some other measurements of lateral ability (for example, the speed at which they could pick up matches with either hand). These other forms of laterality are less well studied.
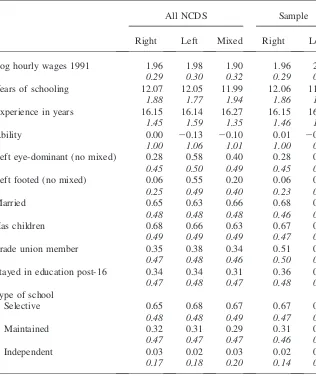
their true handedness. Therefore, a disproportionately high number of children at age seven are recorded (see Table 1) as being mixed-handed.13One could simply take this at face value. However, over time one finds that mixed-handers ‘‘disappear’’— that is, they become left or, mostly, right-handers. We assume that the indication at Table 1
Descriptive statistics: Men by Handedness
All NCDS Sample
Right Left Mixed Right Left
Log hourly wages 1991 1.96 1.98 1.90 1.96 2.00
0.29 0.30 0.32 0.29 0.29
Years of schooling 12.07 12.05 11.99 12.06 11.84
1.88 1.77 1.94 1.86 1.59
Experience in years 16.15 16.14 16.27 16.15 16.22
1.45 1.59 1.35 1.46 1.57
Ability 0.00 20.13 20.10 0.01 20.04
1.00 1.06 1.01 1.00 0.97
Left eye-dominant (no mixed) 0.28 0.58 0.40 0.28 0.55
0.45 0.50 0.49 0.45 0.50
Left footed (no mixed) 0.06 0.55 0.20 0.06 0.57
0.25 0.49 0.40 0.23 0.50
Married 0.65 0.63 0.66 0.68 0.66
0.48 0.48 0.48 0.46 0.47
Has children 0.68 0.66 0.63 0.67 0.66
0.49 0.49 0.49 0.47 0.47
Trade union member 0.35 0.38 0.34 0.51 0.53
0.47 0.48 0.46 0.50 0.50
Stayed in education post-16 0.34 0.34 0.31 0.36 0.31
0.47 0.48 0.47 0.48 0.47
Type of school
Selective 0.65 0.68 0.67 0.67 0.68
0.48 0.48 0.49 0.47 0.47
Maintained 0.32 0.31 0.29 0.31 0.32
0.47 0.47 0.47 0.46 0.47
Independent 0.03 0.02 0.03 0.02 0.01
0.17 0.18 0.20 0.14 0.08
N 6,008 870 598 2,150 327
Standard deviations in italics.
age seven of mixed handedness is largely measurement error. We considered two ways of dealing with this: Either one could impute the handedness of the mixed-handers from data taken at age 11 or we could simply omit them. These two approaches give very similar results, but in this paper we present results mainly using the second strat-egy. So our laterality variable indicates whether they were left-handed at age seven, the Table 2
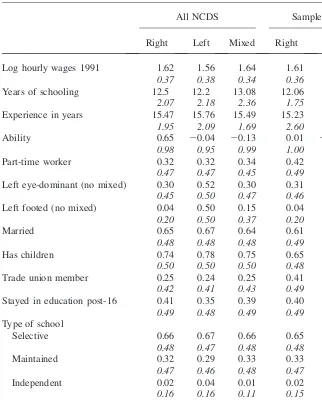
Descriptive Statistics: Women by Handedness
All NCDS Sample
Right Left Mixed Right Left
Log hourly wages 1991 1.62 1.56 1.64 1.61 1.53
0.37 0.38 0.34 0.36 0.36
Years of schooling 12.5 12.2 13.08 12.06 11.87
2.07 2.18 2.36 1.75 1.59
Experience in years 15.47 15.76 15.49 15.23 15.20
1.95 2.09 1.69 2.60 2.79
Ability 0.65 20.04 20.13 0.01 20.07
0.98 0.95 0.99 1.00 0.95
Part-time worker 0.32 0.32 0.34 0.42 0.48
0.47 0.47 0.45 0.49 0.50
Left eye-dominant (no mixed) 0.30 0.52 0.30 0.31 0.62
0.45 0.50 0.47 0.46 0.49
Left footed (no mixed) 0.04 0.50 0.15 0.04 0.51
0.20 0.50 0.37 0.20 0.50
Married 0.65 0.67 0.64 0.61 0.66
0.48 0.48 0.48 0.49 0.48
Has children 0.74 0.78 0.75 0.65 0.71
0.50 0.50 0.50 0.48 0.45
Trade union member 0.25 0.24 0.25 0.41 0.33
0.42 0.41 0.43 0.49 0.47
Stayed in education post-16 0.41 0.35 0.39 0.40 0.35
0.49 0.48 0.49 0.49 0.48
Type of school
Selective 0.66 0.67 0.66 0.65 0.72
0.48 0.47 0.48 0.48 0.45
Maintained 0.32 0.29 0.33 0.33 0.27
0.47 0.46 0.48 0.47 0.45
Independent 0.02 0.04 0.01 0.02 0.01
0.16 0.16 0.11 0.15 0.10
N 6,019 632 414 1,934 200
omitted category being right handed. A third approach, simply including the mixed-handers as a separate category, does not change the results. It is possible that the ob-served switching from left- and mixed- handedness is nonrandom. For example, parents who are more concerned about their children’s future may exert pressure on their chil-dren to switch to being right handed. We have investigated whether such switching can be predicted using various family characteristics such as socioeconomic background, parents’ education and age, family size. None of these predicts switching, though we find that males are slightly more likely to switch handedness between ages seven and eleven.
IV. Results
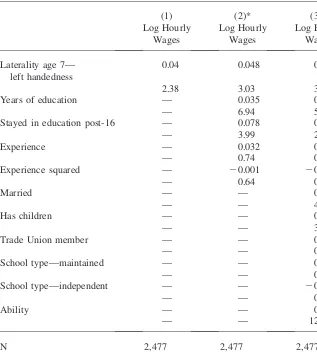
The model we estimate is the standard Mincer model in which the logarithm of hourly earnings is a linear function of years of schooling, a quadratic term in work experience (based on monthly records of labor market activity), and a number of additional controls such as cognitive ability as well as the variable of particular interest, a measure of handedness. The extensive literature on human cap-ital models has considered a large number of variations on this basic model to deal with such issues as the possible endogeneity of schooling, nonlinearities in returns, and heterogeneous returns. As dealing with these issues would take us a long way from the focus of this paper, we sidestep them.14
The basic results for males are in Table 3. The first regression includes left-handedness only as a covariate. The results suggest that left-handed males earn 4 percent more per hour than right-handers. The second column adds variables that are normally in earn-ings equations, a quadratic in work experience and years of education. In addition, con-trols for region and firm size are included. We allow for nonlinearity in schooling by including a dummy variable for whether they stayed in education beyond the minimum school leaving age of 16. The marginal return to a year’s education is 3.5 percent. This is lower than many published OLS estimates for the United Kingdom. It is difficult to compare with other estimates using the NCDS because most of these have very different specifications and in particular, most look at the returns to particular levels of education rather than years of schooling. The average return to schooling here is higher since stay-ing in education one year (or more) beyond the minimum school leavstay-ing age of 16 gen-erates a return of nearly 8 percent. Given that the average level of education in this group is quite low (64 percent leave at age 16 and the average years of schooling is 11), the implied average return (close to 8 percent) is not very different from estimates that impose equality of marginal and average returns (see, for example, Dearden 1999, who estimates returns to males of around 6 percent).
The returns to experience follow the usual shape but the coefficients are not individ-ually (or jointly) statistically significant. This is not surprising since all the respondents were born in the same week so the variation is low. The return to one standard deviation of cognitive ability is nearly 7 percent. The effect of left-handedness is now somewhat higher, close to 5 percent. The third column adds an additional set of controls for marital status, union membership, parenthood, indicators of school type, and a measure of
cognitive ability. The coefficient on left-handedness is essentially unchanged, although the returns to education fall because of the inclusion of ability.
Table 4 explores the robustness of these results further by considering several other specifications. In column 1, we include measures of two additional forms of laterality: eye and foot dominance. In general, the incidence of right-footedness is lower than right-handedness, (about 70 percent and 90 percent respectively). The measurement of eye dominance is more complicated. One criterion is sensory dom-inance, which records which eye’s monocular vision is closer to one’s binocular Table 3
Estimation results for full time men
(1) (2)* (3)*
Log Hourly Wages
Log Hourly Wages
Log Hourly Wages
Laterality age 7— left handedness
0.04 0.048 0.049
2.38 3.03 3.16
Years of education — 0.035 0.029
— 6.94 5.69
Stayed in education post-16 — 0.078 0.048
— 3.99 2.44
Experience — 0.032 0.026
— 0.74 0.62
Experience squared — 20.001 20.001
— 0.64 0.53
Married — — 0.059
— — 4.83
Has children — — 0.038
— — 3.1
Trade Union member — — 0.001
— — 0.09
School type—maintained — — 0.003
— — 0.26
School type—independent — — 20.016
— — 0.36
Ability — — 0.068
— — 12.02
N 2,477 2,477 2,477
R squared adjusted 0.0022 0.1654 0.2248
Table 4
Estimation results for full time men
(1)*
Laterality age 7—left handed 0.051 — 0.046 0.063
2.68 — 2.12 2.81
Laterality age 7—left handed (mixed recoded)
— 0.04 — —
— 2.76 — —
Laterality age 11—left eye dominant 20.004 — — —
0.37 — — —
Laterality age 11—left footed 0.00 — — —
0.02 — — —
Years of education 0.029 0.027 0.02 0.05
5.69 5.48 3.53 2.47
Stayed in education post-16 0.048 0.047 0.049 20.059
2.42 2.43 2.21 1.38
Experience 0.026 0.012 20.011 0.051
0.62 0.29 0.27 0.71
Experience squared 20.001 0 0.001 20.002
0.53 0.21 0.42 0.59
Married 0.059 0.056 0.049 0.053
4.82 4.57 3.09 3
Has children 0.038 0.044 0.055 0.019
3.09 3.64 3.72 0.97
Trade union member 0.001 20.005 0.008 0.034
0.09 0.5 0.59 1.91
School type—maintained 0.003 0.007 0.016 0.001
0.25 0.62 1.04 0.07
School type—independent 20.016 0.027 0.079 20.212
0.35 0.6 2.07 2.54
Ability 0.068 0.071 0.056 0.045
11.97 12.88 6.27 5.63
N 2,477 2,671 1,358 1,055
R squared adjusted 0.2242 0.2145 0.1618 0.1858
Heteroskedastic robusttratios below coefficients. *Regional and employer size dummies omitted.
vision. In these data, the respondents were handed a tube and asked to look down it; the eye they use being designated as dominant—this is sighting dominance. How-ever, they are more likely to use their dominant hand to hold the tube so this can generate a bias.15 There is a positive correlation between most forms of laterality (left-footedness is correlated with left-handedness and so on). For example, Table 1 shows that 94 percent of right-handers are also right footed but only 45 percent of left-handers are. In general, eye dominance is much less well understood and the correlation with both hand and foot dominance is much smaller.
The results indicate that these other forms of laterality have no effect on earnings and the handedness result remains. In the second column we use an alternative mea-sure of left-handedness where those mixed-handers at age seven (who had been omit-ted otherwise) were impuomit-ted with their handedness measured at age 11. This procedure increases the sample slightly. The argument for doing this is that a lot of the mixed-handedness recorded early in life is not genuine and their true handed-ness is revealed as they age. The counterargument is that they are more open to en-vironmental pressures later in life. It is difficult to distinguish between these two hypotheses and we have no firm view on this. In any event, this has only a marginal effect on the results. We also considered the possibility that there may be an impact from being ‘‘cross-lateral,’’ for example, left-handed and right-footed, but we found no evidence of such interactions.16
The environmental hazard discussed in Section II would suggest the disadvantage of being left-handed is more prominent in blue-collar occupations where manual skills are more important. The final two columns present estimates of the earnings equations for white and blue-collar workers separately. Contrary to one’s intuition, the positive impact of left-handedness is greater among blue-collar workers and the hypothesis that the coefficients are the same can be rejected.
If the workplace really is more hazardous for left-handed workers, one might ex-pect them to sort into white-collar/nonmanual occupations where such hazards would be smaller. In an earlier version of this paper (Denny and O’Sullivan 2004), we pre-sent separate estimates for white- and blue-collar workers using an endogenous switching model based on the method of Lee (1978). The results were not very dif-ferent from the OLS results presented here. However, the identification assumptions were problematic. In the probit determining whether workers select into blue- or white-collar occupations left-handedness was not statistically significant (a coeffi-cient of 0.74 and a t statistic of 0.54), so there is no evidence that workers sort according to their laterality.17
One can summarize the male results as follows: If left-handers were at a disadvan-tage because of the right-handed environment they live in, one would expect them to
15. These two measures are generally correlated. An alternative measure is based on differences in the strength of one’s eyesight (visual acuity) and is generally not correlated with the first two (see Bourassa, McManus, and Bryden 1996).
16. There is an influential theory associated with Delacato (1966) that cross-laterality is associated with abnormal intellectual development and disorders such as dyslexia although the evidence in support of it is weak (see McManus and Mascie-Taylor 1983).
be paid less, ceteris paribus, to select into nonmanual occupations and to experience a greater penalty in manual/blue-collar occupations. One can reject all three hypoth-eses. The results can be explained, in principle, by several possible advantages to left-handers discussed earlier, though it is not possible to distinguish among them at present.
Table 5 contains results for females with the same specifications as in Table 3. In the simplest specification, one finds the reverse result to that of males: Left-handers are paid less, over 8 percent in the first model. Adding additional controls reduce this by about half but the number is still well determined.18It is not immediately obvious why the male and female results should be so strikingly different. However, it could be argued that since our priors are so weak in the absence of any previous research there should not be a strong presumption that the effect is the same. It is not unusual in economics for a given variable to have opposite effects for men and women—for example, the presence of children in earnings equations (as in this paper and many others) or labor supply functions. While in many of these cases one can readily think of an explanation, these are often ad hoc. A more pertinent comparison is recent work on the effect of sexual orientation on earnings (Berkhout and Plug 2004, Berg and Lien 2001), which shows that homosexuality is associated with lower earnings in males and higher earnings in females. It is unclear why this is so. Similarly, Bowles, Gintis, and Osborne (2001) report that for high-status jobs, males are rewarded for aggression and penalized for being withdrawn, whereas the reverse is true for females.
What evidence there is on interactions between sex and handedness (the evidence on callosal size, the evidence on divergent thinking, cognitive novelty, and spatial ability, discussed in Section II) points to advantages for left-handed males, primarily or exclusively, consistent with the results here. A considerable body of evidence points to sex differences being associated with biological asymmetry in general. Therefore, it is less surprising from a biological point of view that the results differ by sex.19
Table 6 contains further results for females to explore whether those in Table 5 are robust. We first consider alternative forms of laterality by including measures of foot and eye dominance in addition to handedness. Unlike males, these have some ex-planatory value. What is surprising is that the effects are not qualitatively the same; specifically, left eye dominance has a positive effect that is almost statistically sig-nificant. The second column eliminates the least well determined of the three, hand-edness, and the third includes the only remaining statistically significant variable, left footedness. The penalty associated with left-footedness in Column 3 is of a similar magnitude, around 5 percent, to that found for hand dominance in Table 5. In gen-eral, very little is known about forms of laterality other than handedness except that they are correlated with each other to varying degrees, as Table 2 shows for the data used here. That left-footedness explains earnings better than left-handedness
effectively should eliminate the possibility that the earnings penalty could be asso-ciated with discrimination; employers would be unaware of their employees’ footed-ness and unlikely to care about it if they were. It also makes the environmental explanation (that is, left-handers at a disadvantage in a world geared toward right-handed people) implausible since there is no obvious handicap associated with any particular form of footedness. By default, one is left with some form of Table 5
Estimation Results for Women
(1) Log Hourly Wages
(2)* Log Hourly Wages
(3)* Log Hourly
Wages
Laterality age 7—left handed 20.085 20.052 20.04
3.14 2.42 2.05
Years of education 0.059 0.04
10.5 7.19
Stayed in education post-16 0.051 0.047
2.54 2.44
Experience 0.052 0.031
3.49 2.34
Experience squared 20.002 20.001
2.87 1.94
Part-time worker 20.21 20.158
15.45 10.71
Married 0.042
3.24
Has children 20.078
5.01
Trade union member 0.176
13.61
School type—maintained 0.042
3.29
School type—independent 20.011
0.26
Ability 0.068
10.34
N 2,134 2,134 2,134
R squared adjusted 0.0046 0.3525 0.4404
Table 6
Laterality age 7—left handed 20.029
1.33 Laterality age 7—left handed
(mixed recoded)
20.044
2.32
Laterality age 11—left footed 20.039 20.054 20.049
1.76 2.67 2.42
Laterality age 11—left eye dominant 0.023 0.021
1.88 1.7
Years of education 0.04 0.04 0.04 0.04
7.24 7.24 7.17 7.38
Stayed in education post-16 0.048 0.048 0.048 0.047
2.5 2.52 2.49 2.54
Experience 0.031 0.031 0.032 0.031
2.33 2.35 2.38 2.35
Experience squared 20.001 20.001 20.001 20.001
1.93 1.95 1.98 1.92
Part time worker 20.159 20.16 20.16 20.156
10.8 10.83 10.8 10.88
Married 0.043 0.043 0.043 0.042
3.32 3.32 3.3 3.36
Has children 20.077 20.077 20.078 20.073
4.96 4.98 5.02 4.85
Trade union member 0.177 0.177 0.177 0.173
13.63 13.71 13.69 13.7
School type—maintained 0.044 0.044 0.043 0.05
3.41 3.45 3.33 3.98
School type—independent 20.003 20.001 20.004 20.017
0.08 0.02 0.1 0.42
Ability 0.068 0.068 0.068 0.070
10.37 10.36 10.32 11.19
N 2,134 2,134 2,134 2,244
R-squared adjusted 0.4414 0.4412 0.4408 0.4407
Heteroskedastic robusttratios below coefficients. * Regional and employer size dummies omitted.
biological explanation—that left-footedness is a marker for some biological disad-vantage. The particular disadvantage is a matter for speculation since none has been documented that we are aware of and the general health of males or females individ-uals does not differ by footedness.20
If one estimates the model for women (Column 3 of Table 5) for white-collar and blue-collar workers, the coefficients and t ratios for being left-handed are -0.048 (2.00) and –0.044 (1.18) respectively. So, like males, being left-handed is better (or not so bad) if one is a blue-collar worker but the difference is very small and the small number of female blue-collar (manual) workers means the coefficient is not well determined. Recoding mixed-handers on the basis of their handedness at age 11 has, as with males, no major effect on the results (compare Column 4 of Table 6 with Column 3 of Table 5).
V. Conclusions
Research on the connection between the brain and economic out-comes is in its infancy and has focused on a limited set of outout-comes (such as altruism and strategic behavior) that can be studied experimentally using brain-imaging tech-nology. It is a long way from neurons to the labor market and it is too early to say whether these results tell us much about the real world. This paper looks at the effects on hourly earnings of one particular neurological trait, left-handedness, which has been extensively studied in psychology and biology and has widespread cultural and scientific significance.
The simplest explanation for the existence of such effects is that left-handers are at a disadvantage since the world is substantially geared toward the approximately 90 percent of the population that is right-handed. Such effects could also be exacerbated by discrimination experienced by the ‘‘sinister’’ few. In such a world, left-handers are paid less as they struggle with a right-handed environment. It would also suggest that the penalty is greater for manual than nonmanual workers and that left-handers would have an incentive to sort into nonmanual jobs.
For males, all three predictions are rejected by the data. Left-handers are paid more (by about 4 percent), other things being equal; the premium is greater for man-ual workers, and there is no evidence of occupational sorting by laterality. For females, however there is a statistically significant penalty for being left-handed of approximately the same magnitude as that enjoyed by their male counterparts.
However, environmental or cultural explanations are not convincing here either since it is shown that it is left-footedness that explains earnings in females.21It fol-lows that laterality as a neurological or psychological marker is the most plausible explanation for the results.
There is extensive evidence of costs associated with left-handedness. This comes in variety of forms from the physiological to the purely cultural (for example,
20. Elias, Bryden, and Bulman-Fleming (1998) and Elias and Bryden (1998) show that by some criteria footedness better predicts cerebral lateralization than handedness.
prejudice). However, evolutionary arguments would suggest that there will be com-pensating benefits to maintain the gene or genes that give rise to left-handedness since the trait is not disappearing over time. The evidence suggests that such benefits exist and that they are almost entirely cognitive. Moreover, such differences are likely to include not just cognitive ability but also cognitive style (how people think)—a factor ignored in labor economics. Differences in cognitive ability alone cannot explain the results since we control for it. Evidence suggests that the folklore of left-handers being more creative and engage in more novelty seeking is correct particularly for males. There is also evidence that left-handedness is associated with greater leadership skills for boys and not girls. The same pattern has been found for spatial abilities. These findings provide the best explanation of our results but they are necessarily tentative at this stage. Clearly one needs further studies of the effects of handedness and on the returns to the various characteristics with which it is associated.
References
Annett, Marian. 2002.Handedness and Brain Asymmetry: the Right Shift Theory. Hove, East Sussex: Psychology Press.
Annett, Marian, and Margaret Manning. 1989. ‘‘The Disadvantages of Dextrality for Intelligence.’’British Journal of Psychology80(2):213–26.
Aboitiz, Francisco, Arnold B. Scheibel, Robin S. Fisher, and Eran Zaidal. 1992. ‘‘Fibre Composition of the Human Corpus Callosum.’’Brain Research598(1–2):143–53. Bakan, Paul, Gary Dibb, and Phil Reed. 1973. ‘‘Handedness and Birth Stress.’’
Neuropsychologia11(3):363–66.
Baron-Cohen, Simon. 2004.The Essential Difference. London: Penguin Books.
Barnes, M. P., Ingrid C. Friesen, V. Grupposo, and Clare Porac. 1998. ‘‘Illness and Accidental Injury in Young and Older Adult Left- and Right-handers: Implications for Genetic Theories of Hand Preference.’’Developmental Neuropsychology14(1):157–72. Benbow, Camilla. 1986. ‘‘Physiological Correlates of Extreme Intellectual Precocity.’’
Neuropsychologia24(5):719–25
Berg, Nathan, and Donald Lien. 2001. ‘‘Measuring the Effect of Sexual Orientation on Income: Evidence of Discrimination?’’ Political Economy Working Papers 03/01, School of Social Sciences, University of Texas at Dallas.
Berkhout, Peter, and Erik Plug. 2004. ‘‘Effects of Sexual Preferences on Earnings in the Netherlands.’’Journal of Population Economics17(1):117–31.
Blundell, Richard, Lorraine Dearden, and Barbara Sianesi. 2005. ‘‘Evaluating the Impact of Education on Earnings in the UK: Models, Methods, and Results from the NCDS.’’Journal of the Royal Statistical Society: Series A (Statistics in Society)168(3):473–512. Bourassa, Derrick, Chris McManus, and Mark P. Bryden. 1996. ‘‘Handedness and
Eye-Dominance: a Meta-Analysis of their Relationship.’’Laterality1(1):5–34.
Bowles, Samuel, Herbert Gintis, and Melissa Osborne. 2001. ‘‘The Determinants of Earnings: A Behavioral Approach.’’Journal of Economic Literature39(4):1137–76.
Brooks, Robert, Luc F. Bussie`re, Michael D. Jennions, and John Hunt. 2004. ‘‘Sinister Strategies Success at the Cricket World Cup.’’Proceedings of the Royal Society of London B—Biological Sciences, 271 (Suppl.3, February 7): S64–S66.
Bryden Pamela J., J. Bruyn, and Paula C. Fletcher. 2005. ‘‘Handedness and Health: An Examination of the Association between Different Handedness Classifications and health Disorders.’’Laterality10(5):429–40.
Carneiro, Pedro, and James J. Heckman. 2004. ‘‘Human Capital Policy.’’ InInequality in America: What Role for Human Capital Policies?ed. Benjamin M. Friedman, 77–239. Cambridge: MIT Press.
Christman, Stephen D., and Ruth E. Propper. 2001. ‘‘Superior Episodic Memory is Associated with Inter-Hemispheric Processing.’’Neuropsychology15(4):607–16.
Coren, Stanley. 1993.The Left-Hander Syndrome,the Causes and Consequences of Left-Handedness. New York: Vintage.
———. 1995. ‘‘Differences in Divergent Thinking as a Function of Handedness and Sex.’’ American Journal of Psychology108(3):311–25.
———. 1996. ‘‘Handedness as a Predictor of Increased Risk of Knee, Elbow or Shoulder Injury, Fractures and Broken Bones.’’Laterality1(2):139–52.
Coren, Stanley, and Fred H. Previc. 1989. ‘‘Left-handedness and Accident-Related Injury Risk.’’American Journal of Public Health79(8):1040–41.
Coren, Stanley, and Clare Porac. 1977. ‘‘Fifty Centuries of Right-Handedness: The Historical Record.’’Science198(4317):631–32.
Cosenza, Ramon M., and Sueli Mingoti. 1993. ‘‘Career Choice and Handedness: a Survey among University Applicants.’’Neuropsychologia31(5):487–97.
Cunha, Flavio, James J. Heckman, Lance Lochner, and Dimitriy V. Masterov. 2005. ‘‘Interpreting the Evidence on Life-Cycle Skill Formation.’’ NBER Working paper 11331. Cambridge, Mass.: National Bureau of Economic Research.
Dearden, Lorraine. 1999. ‘‘The Effects of Families and Ability on Men’s Education and Earnings in Britain.’’Labor Economics6(4):551–67.
Delacato, Carl H. 1966.Neurological Organisation and Reading. Springfield, Ill.: Charles C. Thomas and Co.
Denny, Kevin, and Vincent O’Sullivan. 2004. ‘‘The Economic Consequences of Being Left-handed: Some Sinister Results.’’ Economics Department, University College Dublin working paper 04/22.
Douglas, James W. B. 1964.The Home and the School. London: MacGibbon Kee. Elias, Lorin, and Mark P. Bryden . 1998. ‘‘Footedness is a Better Predictor of Language
Lateralisation than Handedness.’’Laterality3(1):41–51.
Elias, Lorin, Mark P. Bryden, and M. Barbara Bulman-Fleming. 1998. ‘‘Footedness is a Better Predictor than is Handedness of Emotional Lateralization.’’Neuropsychologia36(1) 37–43.
Ellis P. J., Eileen Marshall, Christine Windridge, Steven Jones, and Simon J. Ellis. 1998. ‘‘Left-Handedness and Premature Death.’’The Lancet351(9116):1633–34.
Faurie, Charlotte, and Michel Raymond. 2005. ‘‘Handedness, Homicide and Negative Frequency-Dependent Selection.’’Proceedings of the Royal Society of London B-Biological Sciences272(1558):25–28.
Faurie, Charlotte, Nicholas Vianey-Liaud, and Michel Raymond. 2006. ‘‘Do Left-Handed Children Have Advantages Regarding School Performance and Leadership Skills?’’ Laterality. Forthcoming.
Glimcher, Paul. 2003.Decisions, Uncertainty and the Brain: the Science of Neuroeconomics. Cambridge: MIT Press.
Goldberg, Elkhonon, Richard Harner, Mark Lovell, Kenneth Podell, and Silvana Riggio. 1994. ‘‘Cognitive Bias, Functional Cortical Geometry and the Frontal Lobes: Laterality, Sex and Handedness.’’Journal of Cognitive Neuroscience6(3):276–96.
Hardyck, Curtis, Lewis F. Petrinovich, and R. D. Goldman. 1976. ‘‘Left-Handedness and Cognitive Deficit.’’Cortex12(3):266–79.
Harris, Lauren J. 1992. ‘‘Left-Handedness.’’ InHandbook of Neuropsychology, vol. 6, ed. I. Rapin and S. J. Segalowitz. Amsterdam: Elsevier.
Hellige, Joseph B. 1990. ‘‘Hemispheric Asymmetry.’’Annual Review of Psychology 41:55–80.
Hicks, Robert, and Christine Dusek. 1980. ‘‘The Handedness Distributions of Gifted and Non-Gifted Children.’’Cortex16(3):479–81.
Hicks, Robert, Karen Pass, Hope Freeman, Jose Bautista, and Crystal Johnson. 1993. ‘‘Handedness and Accidents with Injury.’’Perceptual and Motor Skills77(December): 1119–22.
Hines, Melissa, Lee Chiu, Lou A. McAdams, Peter M. Bentler, and James Lipcamon. 1992. ‘‘Cognition and the Corpus Callosum: Verbal Fluency, Visuo-Spatial Ability, and Language Lateralization Related to Midsagittal Surface Areas of Callosal Subregions.’’Behavioral Neuroscience106(1):3–14.
Kilshaw, Diana, and Marian Annett. 1983. ‘‘Right- and Left-Hand Skill I: Effects of Age, Sex and Hand Preference Showing Superior Skill in Left-Handers.’’British Journal of Psychology74(May):253–68.
Kimura, Doreen. 1999.Sex and Cognition. Cambridge: MIT Press.
Lee, Lung-Fei. 1978. ‘‘Unionism and Wage Rates: a Simultaneous Equations Model with Qualitative and Limited Dependent Variables.’’International Economic Review 19(2):415–33.
McManus, Chris. 2002.Right Hand Left Hand: the Origins of Asymmetry in Brains, Bodies, Atoms and Cultures. London: Weidenfeld and Nicholson.
McManus, Chris, and C. G. Nicholas Mascie-Taylor. 1983. ‘‘Biosocial Correlates of Cognitive Abilities.’’Journal of Biosocial Science15(3):289–306.
McManus, Chris, and Charles J. Wysocki. 2005. ‘‘Left-Handers Have a Lower Prevalence of Arthritis and Ulcer.’’Laterality10(2):97–102.
Mueller, Gerrit, and Erik Plug. 2004. ‘‘Estimating the Effect of Personality on Male-Female Earnings’’ IZA Discussion paper no. 1253, IZA, Bonn.
Newland, G. Anthony. 1981. ‘‘Differences Between Left- and Right-Handers on a Measure of Creativity.’’Perceptual and Motor Skills53(December):787–92.
Pekkarinen, Ammeli, Simo Salminen, and Matti Ja¨rvelin. 2003. ‘‘Hand Preference and Risk of Injury Among the Northern Finland Birth Cohort at the Age of 30.’’Laterality 8(4):339–46.
Peto, Richard. 1994. ‘‘Left Handedness and Life Expectancy: Causal Inferences Cannot be Trusted.’’British Medical Journal308(6925) February 5: 408.
Peterson, John M., and Leonard M. Lansky. 1977. ‘‘Left-Handedness Among Architects: Partial Replication and Some New Data.’’Perceptual and Motor Skills
45(December):1216–18.
Porac, Clare, and Alan Searleman. 2002. ‘‘The Effect of Hand Preference and Hand Preference Switch History on Measures of Psychological and Physical Well-Being and Cognitive Performance in a Sample of Older Adult Right- and Left-Handers.’’ Neuropsychologia 40(12):2074–83.
Pringle, M., L., Kellmer, N. R. Butler, and R. Davie. 1966.11,000 Seven Year Olds: The First Report of the National Child Development Study (1958 cohort). London: Longmans.
Ruebeck Christopher S., Joseph E. Harrington, Jr., and Robert Moffitt. 2006. ‘‘Handedness and Earnings.’’ NBER Working paper 12387. ForthcomingLaterality.
Sanders Barry, James R. Wilson, and S. G. Vandenberg. 1982. ‘‘Handedness and Spatial Ability.’’Cortex18(1):79–90.
Turner, Charles, and Daniel Martinez. 1977. ‘‘Socioeconomic Achievement and the Machiavellian Personality.’’Sociometry40(4):325–36.
Westergaard, Gregory C., Tara J. Chavanne, Lisa Houser, Allison Cleveland Philip J. Snoy, Stephen, J. Suomi, and J. Dee Higley. 2004. ‘‘Biobehavioral Correlates of Hand Preference in Free-Ranging Female Primates.’’Laterality9(3):267–85.
White, Ronald W. 1971. ‘‘Urge Toward Competence.’’American Journal of Occupational Therapy25(6):271–74 .
Witelson, Sandra. 1985. ‘‘Brain Connection: The Corpus Callosum Is Larger in Left-Handers.’’Science229(4714) August 16:665.
———. 1989. ‘‘Hand and Sex Differences in the Isthmus and Genu of the Human Corpus Callosum: a Post-Mortem Morphological Study.’’Brain112(3):799–835.