Returns to Effort
Evidence from the World Values Survey
Raymond Fisman
Maura O’Neill
a b s t r a c t
We study gender differences in attitudes in the role of luck versus hard work in achieving success using data from the World Values Survey. Women are consistently more likely to report that success is a matter of luck. We consider several potential explanations: workplace discrimination, religion, household responsibilities, and political alignment. Our results favor explanations based on workplace discrimination and household responsibilities.
I. Introduction
We study gender differences in attitudes in the role of luck versus hard work in achieving success. This is a natural extension of the already large and growing body of work on gender differences in labor market outcomes.1 Researchers have offered a range of explanations for these differences, such as dif-ferential rates of human capital investment, time out of work, and simple discrimi-nation (see, for example, Kunze 2000).
Our contribution is to provide an account for some of the psychological impact that these differential outcomes, which, as we argue below, may further reinforce gaps in earnings and career advancement. Consider, for example, workplace discrimination.
Raymond Fisman is a professor at the Columbia Business School; Maura O’Neill is an instructor at Haas School of Business at University of California, Berkeley and a Senior Advisor in President Obama’s Administration. The authors thank Alan Feder and Sarah Burch for superb research assistance. The data used in this article can be obtained beginning May 2010 through April 2013 from Raymond Fisman, Uris 622, Columbia University, New York, NY 10025; rf250@columbia.edu. ½Submitted January 2007; accepted August 2008
ISSN 022-166X E-ISSN 1548-8004Ó2009 by the Board of Regents of the University of Wisconsin System T H E J O U R NA L O F H U M A N R E S O U R C E S d 4 4 d 4
This will obviously attenuate the potential benefits of exerting effort in the work-place. And this may reinforce an equilibrium of female underperformance—if women believe less in the returns to working hard, they may choose to supply less effort.
Our primary contribution is to document a statistically significant and economi-cally large difference between men and women in their beliefs on the returns to ef-fort. Using data from the World Values Survey (WVS), we find a robust gender difference in responses to the question of whether success is a matter of luck or hard work; this difference to hold across time and across countries.
This begs the question of why we might expect women to believe less in the rewards to effort. Here, we suffer from an embarrassment of riches in choosing among candidate explanations. First, if women may believe that childrearing respon-sibilities will eventually take them out of the workforce, this will reduce the benefits of investing in a career. Alternatively, rigid, traditional societies may force women into careers and vocations with little opportunity for advancement. Women also tend to be more liberal politically, and this alone could account for a more ‘‘social’’ (as opposed to individual) view on the determinants of success. And finally, workplace discrimination might cause women to undersupply effort since these efforts will not be rewarded.
We attempt to evaluate the merits of these possible explanations by examining how the gender gap varies according to various survey respondent and country char-acteristics. These include measures of religiosity, household demographics, political views, and workplace status. We find that the gender gap in beliefs on the returns to effort is strongly predicted by workforce status, consistent with the gap deriving pri-marily from workplace concerns. We do not find any evidence that the gap results from religiosity or political views. Limiting the sample to those in the workforce, we find a wider gap for those in supervisory positions, consistent with the well-docu-mented decreasing prevalence of women higher up in the workplace hierarchy (see, for example, Wirth 2001). We additionally find that the gap is greater for those who believe that stay-at-home mothers are important for children, consistent with childrearing roles as an explanation. We also provide some tentative evidence of cross-country differences in the gap as a function of women’s potential for advance-ment—the gap is narrower in countries with strong representation of women in political leadership positions.
We note, finally, some of the limitations of our analyses. Our goal here is not to provide a definitive analysis of gender differences in beliefs on the returns to effort or the effect on motivation. We are limited by both our method, which is purely ob-servational, and our source of data, which is based entirely on survey responses. However, the strength of the patterns we observe, and the striking cross-sectional dif-ferences in the gap based on workplace characteristics, suggest that this is likely to be an important and useful avenue for future research.
The rest of the paper is structured as follows: In Section 1, we provide a descrip-tion of the main theories that could explain gender differences in beliefs on the returns to effort. Section II describes the data; Section III presents our empirical find-ings, and Section IV provides a concluding discussion.
II. Theories on a Gender Gap in Beliefs
A. Workplace discrimination
Since Becker (1957), economists have studied the role of both statistical and taste-based discrimination in labor markets. The evidence, both direct (as in Goldin and Rouse 2000 and via wage decompositions (see van der Meulen Rodgers and Boyer 2006 for an overview), is suggestive of discrimination in both hiring and wage-set-ting. If discrimination impedes advancement, returns to effort will of course be lower. In its most extreme form, women may be restricted from entering certain types of economic activities (see Charmlou et al, 2008). We also note that the well-docu-mented ‘‘glass ceiling’’ effect also implies that the extent of discrimination may be greater as one rises in the workplace hierarchy (see Blau and Kahn 2003 and Wirth 2001). This implies that the differential returns to effort may in fact be greater for men and women in more senior positions.
B. Childrearing
Fernandez (2007) summarizes the evidence on the crucial role played by childrearing responsibilities and fertility in determining female labor supply decisions. An unex-plored corollary of these findings is that women who expect to exit the labor force due to familial obligations may not see the returns to their efforts. Once again, the labor supply decision impacts the actual returns to effort. Labor market interruptions are also a well-documented source of gender wage gaps. Kunze (2002) documents the impact of career interruptions on wages for West German women. In more qual-itative work, Hewlett (2005), finds that 44 percent of white collar women in the United States who chose to take break from the labor force did so for family reasons (childcare or eldercare). When these women reentered the workforce, they faced a wage penalty on average of 18 percent throughout the labor market, 28 percent in the business sector.
C. Religion
religion). But there may further be a gender-specific component—women may be pressured to take care of household duties (as above) discouraged from eco-nomic ambitions, and generally be relegated to subordinate roles (see, for example, Franzmann 2000). Hence, women in religious societies or families may see less of a role of hard work in determining success.
D. Political Alignment
As described in, for example, Alesina and Glaeser (2004), those with leftist political associations are more likely to expect that the State can and should take responsibil-ity for individuals’ welfare. A direct prediction, as documented by Alesina and Glaeser, is that leftist views will be negatively correlated with beliefs that success is a matter of one’s own efforts. The link to gender comes from evidence, within the United States (Edlund and Pande 2002), that women tend to hold more liberal political views. Combining these two pieces of evidence suggests that a link between gender and beliefs on the returns to effort may simply be the result of gender differ-ences in political leanings.
III. Data
Our primary outcome variable is drawn from the World Values Sur-vey (WVS), a surSur-vey instrument administered in four waves (1981–84; 1990–93; 1995–97; 2000–2004) in 81 countries, with at least 1,000 survey respondents in each country-wave of data.2The WVS asks questions on a range of social and political themes, and also collects background demographic information on the respondents.3 The survey is conducted by in-country social science researchers using an identi-cal set of questions, translated as closely as possible into the loidenti-cal language. Strati-fied samples are drawn to ensure appropriate geographical representation. In rural and remote areas of some countries a sample of towns is first drawn and then sam-pling within the town and households is done. In most countries the survey is admin-istered in-person.
In what follows, the key variable of interest is derived from questions that ask sub-jects to place their views on various topics on a scale of one to ten. As our measure of beliefs on the returns to effort, we use a question where a value of one reflects the view that ‘‘In the long run, hard work usually brings a better life’’ and ten reflects the view that, ‘‘Hard work doesn’t generally bring success—it’s more a matter of luck and connections.’’ We call this variableSuccessIsLuck. This question was asked in surveys conducted in the years 1989–99.
As our main regressor, we code an indicator variable,Female, that denotes the gender of the subject. We will also analyze how the relationship between gender and beliefs on the returns to effort varies cross-sectionally according to the theories described in the preceding section. To examine the role of workplace concerns, we
construct an indicator variable,Working, denoting whether a respondent reports that he or she is currently employed. To measure the respondent’s place in the workplace hierarchy, we define an indicator variable,Supervisor, which denotes survey respond-ents who reported under occupation as being: (a) Employer/manager; (b) supervisor and foreman; or (c) supervisory office worker.
To examine the role of household obligations, we use the WVS question of whether the respondent agrees with the statement, ‘‘A pre-school child is likely to suffer if his or her mother works.’’ Subjects may express strong or weak agreement or disagreement. To make interpretation more straightforward, we recode the original variable to take on values in the range zero (strongly disagree) to one (strongly agree). We call this variableHomeMother.
We measure the strength of religious beliefs using self-reported active membership in a religious organization; we code this as an indicator variable,Religious.(We ob-tain very similar results using self-reports on the importance of religion in respond-ents’ lives.) To capture political views, we use the self-ratings of subjects on the political spectrum ranging from one (‘‘Left’’) to ten (‘‘Right’’). We call this variable
Ideology.
We will also utilize the survey question that asks respondents to give their views on competition, where one reflects the view that ‘‘Competition is good. It stimulates people to work hard and develop new ideas’’ and ten reflects the view that ‘‘Compe-tition is harmful. It brings out the worst in people.’’ We call this variable Competi-tionIsBad.
At the country level, we generate a pair of measures designed to capture opportu-nities for women in the workplace. First, using data on labor force participation (LFP) from the World Development Indicators, we calculate the difference between men and women in LFP rates for the years 1989–99, and take country-level averages. Of course, participation is very different from advancement. As a cross-country mea-sure of the scope for female advancement in the workforce, we use the fraction of national parliamentarians that are female (PercentFemaleParliament). We take an av-erage of the female representation rates in the lower and upper houses if there are multiple levels of national representation. These data are only available from 1997 onward, and we use the average for all available dates during 1997–99.
We also include basic individual and country controls. To account for income we use the respondent’s self-reported household income decile (Income), and to control for education (Education), we use the WVS categories, ranging from one (‘‘no for-mal education’’) to eight (‘‘university-level education, with degree’’). As a country-level measure of income and general economic development, we use the logarithm of GDP per capita in U. S. dollars (Source: World Development Indicators) averaged over the years 1989-99. We also use the United Nations regions code data4to control for regional differences.
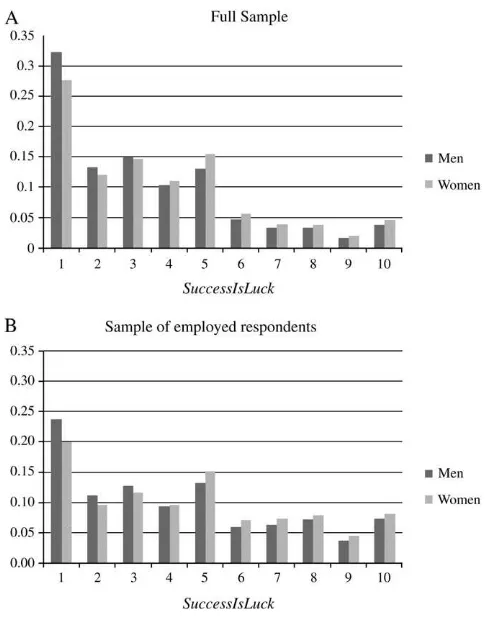
To construct our sample, we include data from all surveys where the Success-IsLuck question was asked, and limit ourselves to observations where it was an-swered. We show the distribution of responses to this question by gender in Figure 1a. Responses are clearly skewed to the left (success is the result of hard
work). But there are clear gender differences: The fraction of male respondents giv-ing responses in the range 1-3 is higher than that for women, while the proportion of female respondents is higher for all other values. In Figure 1b, we provide the dis-tribution of values for respondents that have self-identified as being in the workforce (55.6 percent of the sample). A similar pattern emerges, though the gender differen-ces are even more striking.
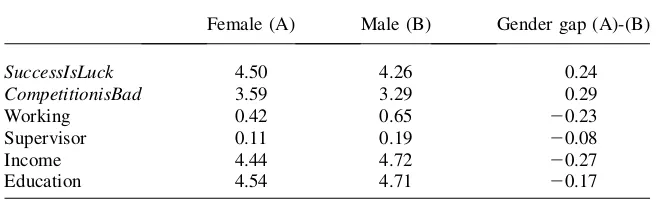
Summary statistics for the full sample are listed in Table 1a; Table 1b shows the difference between male and female responses for a subset of variables. The ‘‘gender perceptions gaps’’ reported in Table 1b makes clear that female respondents are more likely to attribute success to luck, as reflected in the distributions from Figure 1. Also, not surprisingly, we observe gender differences in income, education, and various workplace variables, thus highlighting the importance of controlling for these differences. We now proceed to examine these patterns in a regression framework.
Figure 1
Table 1a
Summary Statistics
Variable Mean Standard Deviation Minimum Maximum Observations
SuccessIsLuck 4.38 2.90 1 10 128,663
CompetitionIsBad 3.44 2.47 1 10 125,029
Female 0.52 0.50 0 1 128,528
Working 0.56 0.50 0 1 128,663
Supervisor 0.15 0.36 0 1 115,264
Income 4.57 2.46 1 10 111,013
Education 4.62 2.24 1 8 76,875
Ideology 5.52 2.22 1 10 99,420
Religious 0.18 0.38 0 1 65,986
Home 0.64 0.28 0 1 51,710
log(GDPPC) 8.31 1.40 5.65 10.46 125,224
%FemaleParliament 12.93 6.89 0 33.5 116,598
LFP_gap 0.36 0.08 0.17 0.47 121,737
Table 1b
Basic gender difference in summary statistics
Female (A) Male (B) Gender gap (A)-(B)
SuccessIsLuck 4.50 4.26 0.24
CompetitionisBad 3.59 3.29 0.29
Working 0.42 0.65 20.23
Supervisor 0.11 0.19 20.08
Income 4.44 4.72 20.27
Education 4.54 4.71 20.17
IV. Empirical Results
Our baseline specification considers the relationship between Success-IsLuckandFemale:
ð1Þ SuccessIsLuck¼acy+b
1Femalei +i
whereacyis a country-wave fixed-effect (that is, up to three fixed effects per country) andeiis the error term; in all regressions we report robust standard errors. We first consider the basic specification without fixed effects in Column 1 of Table 2. Con-sistent with the summary differences reported in Table 1b, women are significantly more likely to report that success is a matter of luck rather than hard work. The mag-nitude of the coefficient, 0.236, is approximately 8 percent of the standard deviation ofSuccessIsLuck. In Columns 2-4 we include various combinations of fixed effects; while the coefficient onFemaledrops marginally (particularly for the country-wave-education fixed effect specification), it remains highly significant.
In Specifications 5–9, we attempt to evaluate some of the explanations for the gen-der gap in SuccessIsLuck. In Column 5, we include country-wave-ideology fixed effects; the coefficient onFemaleis virtually unchanged, suggesting that the gender difference we observe is not simply due to gender differences in political preferen-ces. In Column 6, we add the interaction termFemale*Working; we find that it is highly significant, and takes on a value of 0.169. The direct effect ofFemalein this specification is 0.138, implying that the gender gap inSuccessIsLuckis more than twice as high for those in the workforce. This provides highly suggested evidence that the gender differences we observe are due at least in part to workplace consid-erations. In Column 7, we consider the effects of religiosity, adding the interaction termFemale*Religious. In this case, the coefficient in small and indistinguishable from zero. Finally, in Columns 8 and 9 we include a pair of country-level controls—
Table 2
Gnder and perceptions of luck versus hard work in determining success
(1) (2) (3) (4) (5) (6) (7) (8) (9)
Female 0.2360c 0.2130c 0.2120c 0.1850c 0.2100c 0.1380 0.1970 0.1490 (0.0039)
(0.0176) (0.0171) (0.0187) (0.0219) (0.0189) (0.0275) (0.0252) (0.1070) (0.1860)
Working 0.0245 0.464a 0.0500a
(0.0266) (0.0270) (0.0272)
Working*female 0.1690c 0.1350c 0.1300c
(0.0357) (0.0364) (0.0367)
Religious (0.2170)c
(0.0496)
Religious*female 0.0423
(0.0641)
Log(GDPPC)*female 0.0019 0.0183
(0.0123) (0.0153)
Country*wave FE No Yes Yes Yes Yes Yes Yes Yes Yes
Country*wave*income FE No No Yes No No No No No No
Country*wave*edue FE No No No Yes No No No No No
Country*wave*ideology FE No No No Yes Yes No No No No
Female*region FE No No No No No No No No Yes
Observations 128,528 128,528 110,906 76,819 99,305 128,528 65,920 125,089 122,386
R-Squared 0.002 0.079 0.093 0.108 0.105 0.08 0.084 0.08 0.082
Dependent variable in all regressions is the survey respondent’s rating on a 1-10 scale where 1 is "In the long run hard work usually brings a better life" and 10 is ‘‘Hard work doesn’t generally bring success—it’s more a matter of luck and connections.’’ Female is an indicator variable for gender. Income is the self-reported income decile of the respondent. Ed-ucation fixed effects are for WVS edEd-ucation categories ranging from one (no formal edEd-ucation) to eight (university edEd-ucation). Political ideology fixed effects are the WVS respond-ent’s self-rating from one (Left) to ten (Right) on the political spectrum. Working is an indicator variable denoting whether the respondent self-reported being in the workforce. Religious is an indicator variable denoting that the respondent is an active member of a religious organization. log(GDPPC) is the income per capita in 1982 dollars of the respond-ent’s country. Linear Probability Model. Robust standard errors in parentheses, clustered by country-wave. The dependent variable in all regressions is Decision, an indicator vari-able that takes on a value of one if a subject desired contact information for a partner. All regressions include country-wave fixed effects, robust standard errors in parentheses. a. significant at the 10 percent level;
b. significant at 5 percent level; c. significant at 1 percent level.
The
Journal
of
Human
of employment opportunities available to women. In Equation 3, we find that the in-teractionFemale*PercentFemaleParliamentis negative and significant at the 5 per-cent level, implying a smaller gap for countries with high rates of female political leadership. We addFemale*log(GDPPC) as a control in Column 4, and find the results unchanged. In Column 5, we include the interaction termFemale*LFP_gap. In this case, the interaction term is indistinguishable from zero. This is perhaps not surprising—participation in the workforce does not necessarily imply opportunities for advancement (consistent with this,LFP_gapis only weakly correlated with basic measures of development, such as log(GDPPC)).
Table 3
Gender, workplace concerns, and perceptions of success is due to luck
(1) (2) (3) (4) (5) (6)
Female 0.2500c 0.0973 0.4470 0.2820 0.3570a 0.1920 (0.0260) (0.0835) (0.0811) (0.2420) (0.2070) (0.2750) Supervisor (0.4090)c
Observations 68937 67049 58795 34091 33025 28823
R-squared 0.06 0.06 0.07 0.06 0.06 0.06
Dependent variable in all regressions is the survey respondent’s rating on a 1-10 scale where 1 is ‘‘In the long run hard work usually brings a better life’’ and 10 is ‘‘Hard work doesn’t generally bring success—it’s more a matter of luck and connections.’’ The sample in all regressions is limited to respondents that self-identified as being in the workforce. Female is an indicator variable for gender. Supervisor is an indicator variable denoting whether the survey respondent reported being in a managerial or supervisory position. HomeMotherreflects the intensity of the respondent’s belief that a stay-at-home mother is important for young children. log(GDPPCUS) is the logarithm of GDP per capita in 1982 US dollars (Source: World De-velopment Indicators) for the years 1989-99. Percent Female in Parliament is the fraction of government representatives in the national parliament that are women (Source: International Parliamentary Union). LFP_gapis the difference between the labor force participation rates of men and women during 1989-99 (World Development Indicators). All regressions include country-wave fixed effects, Robust standard errors in parentheses.
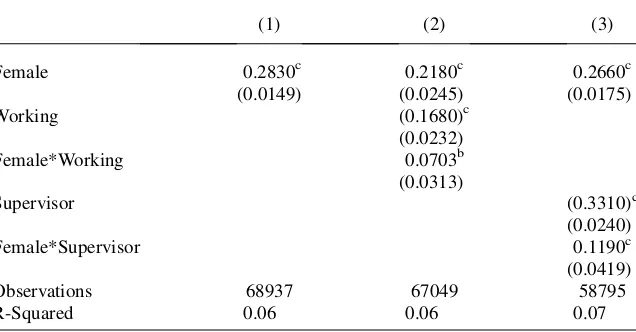
As noted in Section I, if workplace success is determined primarily by luck, then the benefit of ‘‘tournament’’-type competition, which should provide incentives to those who work hard, will be relatively low. This is consistent with the findings of Niederle and Vesterlund (2007); we examine whether there are significant gender dif-ferences in attitudes toward competition in our much broader sample (albeit based on survey data, rather than real decisions that they employ in their laboratory experi-ments). We therefore repeat our basic specification using the outcome variable Com-petitionIsBad; these results are reported in Table 4. We find that the basic gender difference is comparable to that of ourSuccessIsLuckanalyses in Table 2, Column 2. That is, women are more likely to hold negative views on the merits of competi-tion. In Column 2, we examine how this gender difference varies according to work-place participation. Again paralleling our earlier findings, we find a stronger effect of gender onCompetitionIsBadamong those in the workforce. Finally, in Column 3 we limit the sample to those in the workforce, and examine the effect of being in a su-pervisory position. As with our earlier analyses, we find a stronger impact of gender for those in supervisory roles.
Table 4
Gender and perceptions on whether competition is harmful
(1) (2) (3)
Female 0.2830c 0.2180c 0.2660c
(0.0149) (0.0245) (0.0175)
Working (0.1680)c
(0.0232)
Female*Working 0.0703b
(0.0313)
Supervisor (0.3310)c
(0.0240)
Female*Supervisor 0.1190c
(0.0419)
Observations 68937 67049 58795
R-Squared 0.06 0.06 0.07
Dependent variable in all regressions is the survey respondent’s rating on a 1-10 scale where 1 is ‘‘Com-petition is good. It stimulates people to work hard and develop new ideas’’ and 10 is ‘‘Com‘‘Com-petition is harm-ful. It brings out the worst in people.’’ In Equation 3, the sample is limited to respondents that self-identified as being in the workforce. Female is an indicator variable for gender. Supervisor is an indicator variable denoting whether the survey respondent reported being in a managerial or supervisory position. Linear Probability Model. Robust standard errors in parentheses, clustered by country-wave. All regressions in-clude country-wave fixed effects, Robust standard errors in parentheses.
V. Conclusions
In this paper, we document gender differences in beliefs on the role of hard work versus luck in getting ahead, using data from the World Values Survey. Women are consistently more likely to report that success is a matter of luck, and hold negative views on the merits of competition. Further, these gender differences vary systematically with workforce participation, workplace status, and other attrib-utes in a way that is consistent with an explanation built on differential access to ca-reer advancement.
These differences are important for considering women’s roles in the workforce. We argue that these overall patterns are consistent with barriers to females’ advance-ment to higher positions in the workplace hierarchy, but also emphasize in closing that these perceptions on the merits of working hard may themselves serve as a bar-rier to advancement—if one does not see the merits of hard work and therefore choo-ses not to exert high effort, advancement is unlikely. While we view our contribution to be quite preliminary—much more work is required to better understand the deter-minants and evolution of these gender differences—we believe that these patterns provide useful motivation and direction for examining the role of attitudes in explaining gender differences in workplace achievement.
References
Alesina, Alberto, and Edward Glaeser. 2004. Fighting Poverty in the US and Europe: A World of Difference.Oxford University Press.
Altonji, Joseph, and Rebecca Blank. 1999. ‘‘Race and Gender in the Labor Market.’’ Handbook of Labor Economics(3):3143–3259.
Becker, Gary. 1957.The Economics of Discrimination.Chicago: University of Chicago Press, 1971 2nded.
Blau, Francine, and Lawrence Kahn. 2003. ‘‘Understanding International Differences in the Gender Pay Gap.’’Journal of Labor Economics21:106–44.
Chamlou, Nadereh, Leora Klapper, and Silvia Muzi. 2008.The Environment for Women’s Entrepreneurship in Middle East and North Africa.World Bank Publications.
Edlund, Lena, and Rohini Pande. 2002. ‘‘Why Have Women Become Left-Wing: the Political Gender Gap and the Decline in Marriage.’’Quarterly Journal of Economics117:917–61. Fernandez, Raquel. 2007. ‘‘Women, Work, and Culture.’’Journal of the European Economic
Association5(2–3):305–32.
Franzmann, Marjella. 2000.Women and Religion.Oxford: Oxford University Press. Goldin, Claudia, and Cecelia Rouse. 2000. Orchestrating Impartiality: The Impact of ‘‘Blind’’
Auditions on Female Musicians.American Economic Review90(4): 715–41.
Hewlett, Sylvia. 2005. Off-Ramps and On-Ramps: Keeping Talented Women on the Road to Success.Harvard Business Review, March.
Inglehart, Ronald, and Pippa Norris. 2003.Rising Tide: Gender Equality and Cultural Change Around the World.Cambridge: Cambridge University Press.
Kunze, Astrid. 2000. ‘‘The Determination of Wages and the Gender Wage Gap: A Survey.’’ IZA Discussion Paper, August, No. 193.
Niederle, Muriel, and Lise Vesterlund. 2007. ‘‘Do Women Shy Away from Competition? Do Men Compete Too Much?’’Quarterly Journal of Economics122(3):1067–1101. Reskin, Barbara, Debra McBrier, and Julie Kmec. 1999. ‘‘The Determinants and
Consequences of the Sex and Race Composition of Work Organizations.’’Annual Review of Sociology25:335–61.
Van der Meulen Rodgers, Yana and Teresa Boyer. 2006. ‘‘Gender and Racial Differences in Vocational Education: An International Perspective.’’International Journal of Manpower 27(4).