Everyone’s Doing It, But What Does
Teacher Testing Tell Us About Teacher
Effectiveness?
Dan Goldhaber
a b s t r a c t
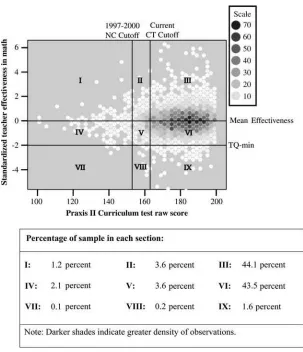
This paper explores the relationship between teacher testing and teacher effectiveness using a unique data set that links teachers to their individual students. The findings show a positive relationship between some teacher licensure tests and student achievement. But, they also suggest that states face significant tradeoffs when they require particular performance levels as a precondition to becoming a teacher. Some teachers whom we might wish were not in the teacher work force based on their contribution toward student achievement are eligible to teach based on their performance on the tests; other individuals who would be effective teachers are ineligible. For example, the results suggest that upping the elementary teacher licensure test standard from the one currently used in North Carolina to the higher standard used in Connecticut would lead to the exclusion of less than 0.5 percent of the teacher work force estimated to be very ineffective teachers, but would also result in the exclusion of 7 percent of the teacher work force estimated to be effective teachers.
Dan Goldhaber is a research professor of public affairs at the University of Washington and an affiliated scholar at the Urban Institute. The research presented here is based primarily on confidential data from the North Carolina Education Research Center (NCERDC) at Duke University, directed by Elizabeth Glennie and supported by the Spencer Foundation. The author wishes to acknowledge the North Carolina Department of Public Instruction for its role in collecting this information. The author gratefully acknowledges the Carnegie Corporation of New York, the Ewing Marion Kauffman Foundation, and an anonymous foundation for providing financial support for this project. The author also wishes to thank Jacob Vigdor, Michael Podgursky, Jim Wyckoff, and Ronald Ehrenberg for comments on an earlier version of this article; Carol Wallace and Michael DeArmond for editorial assistance; and Daniel Player and Michael Hansen for excellent research assistance. The views expressed in this paper do not necessarily reflect those of the University of Washington, the Urban Institute, or the study’s sponsors. Responsibility for any and all errors rests solely with the author. The data for this paper originated with Duke University. Information about how researchers can acquire the data is posted on the NCERDC website at http://www.childandfamilypolicy.duke.edu/ep/nceddatacenter/procedures.html. The author will be happy to assist other scholars with this process. Dan Goldhaber, University of Washington, CRPE, 2101 N. 34th Street, Suite 195, Seattle 98103, dgoldhab@u.washington.edu, Phone: 206-685-2214; Fax: 206-221-7402.
[Submitted April 2006; accepted January 2007]
ISSN 022-166X E-ISSN 1548-8004Ó2007 by the Board of Regents of the University of Wisconsin System
I. Introduction
Education research dating all the way back to theColeman Report
(Coleman 1966) shows that of all the school-related factors that affect student achieve-ment, teacher quality is the most important. Newer research supports that finding and also suggests that quality varies considerably among teachers (Rivkin, Hanushek, and Kain 2005; Rockoff 2004). Indeed, some studies suggest that having an excellent teacher instead of a poor one can translate into an additional year’s worth of learning growth (Hanushek 1992). As a result, there is great deal of interest in understanding teacher quality and the ways in which various education policies, for better or worse, affect it. Although testing teachers as a condition of employment is almost universal in the United States, little empirical evidence exists about how this policy impacts teachers, and through them, students. My investigation of the relationship between teacher licensure and student achievement indicates that licensure test performance is not a silver bullet credential that can be used to predict teacher effectiveness, and if anything, highlights the need for greater selectivity in district hiring practices, and for district policies designed to shape teacher labor forces once the effects of teachers in the classroom have been observed.
The teacher licensure system (also commonly referred to as teacher certification) is the primary screen used by all states to try to guarantee a minimal level of teacher quality: Individuals who want to become public school teachers must meet certain requirements to be eligible for employment. All states, for example, require teachers to hold a bachelor’s degree and have some training in pedagogy in order to be licensed. Most also require that teachers have training in the subject they teach and some kind of student teaching experience. Teachers typically also have to pass background checks and state-mandated tests before they can work in the classroom (Rotherham and Mead 2004). This paper focuses on the most straightforward requirement, teacher testing—if you can’t meet or exceed a ‘‘cut score’’ on a licensure test, the state deems you ineli-gible to teach.
Despite the popularity of teacher testing as a policy (according to a 2005 U.S. De-partment of Education report, ‘‘all but four states have teacher testing in place or will have testing in place by 2006,’’ p. 38) there is a great deal of uncertainty about its value as either a screening tool to limit the number of low-quality teachers in the work force or as a signaling device to be used by local school systems for making hiring deci-sions. Both theoretical work (Stigler 1971) and empirical work in contexts outside of education (Kleiner 2000) suggest that licensure, in general, is not a guarantee of ser-vice quality. Relatively little empirical work links teachers’ scores on licensure tests to student achievement, and the magic pass/fail test line varies by state and is typi-cally set by expert consensus panels, not empirical data. In the absence of good evi-dence about the relationship between teacher tests and measures of teacher effectiveness, it is not possible to judge the extent to which states’ use of licensure tests allows in-effective teachers into the work force or screens potentially in-effective teachers out of the work force.
over a 10-year period (1994–95 through 2003–2004). The data allow me to account for the nonrandom distribution of teachers across schools and classrooms as well as the nonrandom attrition of teachers from the work force, factors that could bias esti-mates of the relationship between teacher testing and effectiveness. I also exploit a natural experiment that arises from time-series and cross-sectional variation in state cutoff scores in order to explore the extent to which changes in the cutoff result in the exclusion of potentially highly effective teachers from, or the inclusion of ineffective teachers in, the labor market.
I find a positive relationship between some teacher licensure tests and student achievement. However the point estimates are generally small in the specifications that account for the nonrandom sorting of teachers across students. This finding sug-gests that states face significant tradeoffs when using licensure tests as a screening device: Despite the testing, many teachers whom we might wish were not in the teacher work force based on their contribution toward student achievement are nev-ertheless eligible because they scored well on the test. Conversely, many individuals who would be effective teachers are ineligible due to their poor test performance. For example, the results suggest that upping the elementary teacher licensure test stan-dard from the one currently used in North Carolina to the higher stanstan-dard used in Connecticut would lead to the exclusion of just 0.2 percent of the teacher work force who are estimated to be very ineffective teachers, but would also result in the exclu-sion of 7 percent of the teacher work force who are estimated to be effective.
My findings do not necessarily suggest that licensure testing is an ineffective pol-icy. It is a value judgment as to whether the tradeoffs are worthwhile, and, in addi-tion, individual teacher test performance may provide an important signal about teacher quality that local hiring authorities could weigh against other teacher attrib-utes when making hiring decisions.
II. Teacher Testing: Background and Evidence
The primary goal of a state’s licensure policy is to limit the number of individuals who would make for ineffective (and potentially harmful) teachers in public schools and a secondary goal is to create a teacher work force of higher over-all quality than would exist in its absence. The impact of a licensure system on the teacher labor market, however, is theoretically ambiguous as it will depend on three interrelated issues: (1) how specific licensure provisions impact individuals’ labor market decisions (that is, whether they opt to pursue careers in teaching); (2) the requirements states impose on individuals and the relationship of any such require-ments to student outcomes; and (3) whether licensure has an impact on local school system recruitment and selection of teachers.
Licensure requirements raise the cost of employment and likely discourage some individuals from pursuing a teaching career. However, to the extent that the require-ments are strongly linked with teacher effectiveness, they may serve as an effective screen to keep individuals who would make for ineffective teachers out of the labor market. Finally, it is unclear whether licensure policies have any impact on local school system hiring. One might imagine that a state system that supposedly
provides a guarantee of teacher quality would lead localities to invest less in devel-oping their own teacher quality mechanisms. On the other hand, state licensure sys-tems could lead to greater information about teacher applicants than would otherwise exist, which may be used by localities when making hiring decisions.
Complicating matters further is the fact that most states have substantial variation among local school districts in terms of funding levels (and thus what they can pay in salaries) and nonpecuniary working conditions (for example, the academic prepara-tion of their students). As a consequence, local districts differ in how attractive they are as places of employment, which in turn means that they are likely competing in the labor market for very different individuals, so licensure requirements may have very different effects on different school districts.1
At the heart of any licensure test requirement is theexclusionof certain individuals from the pool of potential employees: If you don’t pass the test, you aren’t in the pool. States implement teacher testing requirements in order to exclude individuals who would have been teachers of unacceptably low quality. Whether that happens, however, will depend on the distribution of quality among the test takers as well as the ‘‘cut score’’ used to keep individuals out of the pool. Consistent with the frame-work described above, licensure testing also may have other effects on the teacher frame-work force besides this screening function; for example, testing increases the cost of labor market production (Friedman and Kuznets 1945), and thereby discourages people from becoming teachers. Research by Hanushek and Pace (1995) and Angrist and Guryan (2004) suggests this may in fact occur in the teacher labor market. Finally, testing may provide a signal of employee quality that could influence public school hiring decisions.
States began testing teachers as a condition of employment in the 1960s, but since then, have increasingly enacted formal teacher-testing policies. In 1985, 31 states re-quired teachers to pass a test as a prerequisite for employment (Flippo 2002), and by the end of 2006, all but four states will require potential teachers to pass tests that cover basic skills, content knowledge, and/or professional knowledge. The majority of these states use one or more of the Educational Testing Service’s (ETS) Praxis se-ries of tests (U.S. Department of Education 2005, p.38; www.ets.org/praxis).
While states place differing levels of emphasis on testing teachers, they tend to use a uniformapproachto determining the ‘‘cut score’’ that candidates must achieve to become a teacher. Typically, states rely on a panel of education experts who attempt to relate the minimum levels of content and teaching knowledge required of begin-ning teachers to what is measured by the various licensure tests—the resulting cutoff score is where they deem a minimally qualified teacher candidate should perform. The cutoff is typically determined using an Angoff-type (1971) model. In simplified terms: (1) expert panelists subjectively estimate the proportions of minimally quali-fied candidates who would answer each question on a test correctly; (2) the estimated proportions for each expert are summed to get the individual panelist’s cutoff score; and (3) then the final cutoff score is determined by taking the mean across panelists (National Research Council 2001). Given this method, it should come as no surprise that states tend to make different decisions about what the appropriate cutoffs should
1. For a more detailed theoretical framework of how licensure systems might impact the teacher work force, see Goldhaber (2004) and Boyd et al. (2007).
be, even when they use the same test. The cut scores may be internally valid with gards to measuring particular skills, but no state currently uses a cut score that re-flects scientific evidence about a particular level of teacher effectiveness.
It is worth noting that ETS, the main developer and purveyor of teacher tests, emphasizes that its teacher licensure assessments are designed to ‘‘measure the knowl-edge and/or skills thought to be important for beginning practice,’’ and nothing more (Educational Testing Service 2006). Given this, some have argued that evaluating li-censure tests as signals of teacherquality, as I do here, is a questionable enterprise at best, as licensure tests are valid only to the degree that they accurately reflect the knowledge and skills actually required of beginning teachers (Jaeger 1999). Despite the technical difficulties involved in examining the link between licensure tests and teacher quality, the question of whether or not licensure tests provide a valid signal of quality is clearly an important one. Measuring content knowledge and skills for their own sake is of little use, unless they are somehow related to job performance. And, as a practical matter, states ostensibly use licensure tests as de facto quality screens in the teacher labor market.
Despite the insistence that such tests should not be evaluated as signals of quality, a small literature (Ehrenberg and Brewer 1995; Ferguson 1991; Ferguson and Ladd 1996; Strauss and Sawyer 1986; Summers and Wolfe 1975) suggests teacher test performance actually does serve as a good signal of teacher effectiveness, though estimates of the strength of the teacher test-student achievement relationship vary significantly across studies. Most likely, this inconsistency is due to the aggregation level of the data analyzed (Hanushek, Rivkin, and Taylor 1996), and the extent to which the research accounts for the potential nonrandom match of teachers to stu-dents (Clotfelter, Ladd, and Vigdor 2006). Two recent studies that use disaggregated data find a consistent, though small, relationship between teacher performance on the Praxis licensure exams used in North Carolina and student achievement. Clotfelter, Ladd, and Vigdor (2006) find that a 1-standard-deviation increase in teacher test-score performance is predicted to increase fifth grade students’ achievement by 1 to 2 per-cent of a standard deviation. Goldhaber (forthcoming), focusing on elementary Grades 3–5, finds that a 1 standard deviation change in teacher test-score performance is predicted to increase student test scores by about 1 to 4 percent. Neither of the above papers, however, explore whether licensure tests are differentially predictive of teacher quality at different points in the test distribution, or account for the possibility that sam-ple selection or nonrandom attrition from the teacher labor market may bias the results.
III. Theoretical Framework and Analytic Approach
If licensure tests work as the screening devices they are intended to be (it is worth remembering that the tests constitute only one of several components of most states’ licensure systems), they will exclude relatively few individuals who would have been highly effective teachers, and exclude most who would have fallen below an accepted threshold of effectiveness. But, it is inevitable that some individ-uals who score well enough to make it into the teacher labor market will end up be-ing quite ineffective teachers; these individuals are referred to asfalse positives. At
the same time, other individuals who would have made very effective teachers score poorly on the tests and are therefore excluded from teaching; they are referred to as
false negatives.2 The number of false positives and false negatives will depend on how closely licensure performance and teacher quality are correlated across the licensure test distribution: If the relationship between the two is strong, there will be relatively few false positives and false negatives, but, conversely, if the correlation is weak, there will be significantly more.
From a policy perspective, we might be interested in two aspects of licensure tests: their efficacy as a screening device (as they are currently used by states), and the infor-mation they provide as a signal of teacher quality. To assess the efficacy of using the tests as a screening device, I estimate the following basic educational production function:
At¼aAt21+bSTUDENT+dPASS+hCLASS
ð1Þ
The lefthand side of the equation (At) is the achievement of studentiin yeart. The model includes controls for achievement in a prior year,At-1; a vector of individual student characteristics, STUDENT; an indicator for whether a teacher passed or failed a licensure exam based on a particular standard, PASS; and a vector of classroom var-iables, CLASS.3The main focus of interest is in the estimate ofd, which is identified by the comparison of teachers who pass the licensure-test standard to those who do not, and therefore serves as a measure of the average differential in student achieve-ment between teachers who pass and those who fail a licensure exam, holding con-stant the other variables in the model.
As described in Section II, the Educational Testing Service (ETS) claims that its commonly used teacher tests may not have great predictive power away from a given state’s cut score.4But there is no national cut score, and the fact that scores vary con-siderably between states (National Research Council 2001) warrants a closer look at the predictive power of licensure tests along the entire performance distribution. The variation in scores is certainly relevant for policy, given that a local school district, at the point of hire, may use a teacher’s actual score (as opposed to just her pass or fail status) as an indicator of teacher quality.
2. See Goldhaber (2004) for a more comprehensive discussion of this issue.
3. Analyses of the value-added of various school and teacher effects is generally based on one of three em-pirical specifications: one, similar to Equation 1, where the dependent variable, a measure of achievement, is regressed against a set of controls that includes a measure of prior achievement; a second, where the de-pendent variable is the gain (the difference between a post test and some measure of prior achievement) in test scores regressed against a set of controls; and finally, a third where achievement is regressed against a set of controls that includes student fixed-effects. I have experimented with all three specifications, and un-less noted, the reported results for the teacher licensure test variables do not vary significantly from one specification to another (the magnitudes of the point estimates change slightly but the patterns of statistical significance do not).
4. The quote is: ‘‘the lack of an exact value for the highest score obtainable follows from the fact that the PraxisTM test scores are intended to be interpreted with reference to the passing score set by each state that uses the test in the process of licensing teachers. Because licensing decisions are, by law, meant to protect the public from harm rather than to allow selection of outstanding candidates, distinctions among test takers near the top of the score scale are not important for the use of the test in making licensing decisions.’’ For more information, see the ETS website posted replies to questions: http://www.ets.org/portal/site/ets/ menuitem.2e37a093417f63e3aa77b13bc3921509/?vgnextoid¼a2912d3631df4010VgnVCM10000022f951 90RCRD&vgnextchannel¼57ec253b164f4010VgnVCM10000022f95190RCRD.
To ascertain the signal value of teacher test scores, I estimate a variant of Equation 1 that substitutes a vector of teacher test quintiles indicating a teacher’s location in the distribution,TEST, for the indicator for whether a teacher passes the state’s cut-off, and includes a vector of other teacher characteristics,TEACHER, since local dis-tricts, when hiring teachers, have the benefit of assessing teacher test scores in the context of additional information about them (for instance, a teacher’s degree level or the type of certification). In the following specification, the coefficient onTEST, l, is identified based on variation in teacher test scores among teachers in the labor force and it reveals the signal value of the test:
At¼aAt21+bSTUDENT+lTEST+fTEACHER+hCLASS
ð2Þ
In carrying out the above analysis, there are at least three potential sources of bias. The first is that, with a few exceptions (described in more detail below), teachers are only observed if they have met the minimum licensure standard. This creates a clas-sic problem of sample selection that has been shown to bias in other contexts, such as estimates of the impact of wages on labor supply (Killingsworth 1983) or SAT per-formance on college grades (Vars and Bowen 1998). In the context of identifying the screening value of licensure tests one might hypothesize that the teachers who make it into the labor market despite having not met the licensure test standard are likely to possess attributes valued in the labor market that are not measured in the data set.
The sample selection issue does not lead to a bias in the signal value of teacher testsamong teachers who are deemed eligible to teachby virtue of having passed the test, but we are, of course, interested in the signal value of licensure tests among all teacher applicants, not just successful applicants. Fortunately for research purpo-ses, states periodically change their required cut scores and grandfather already-licensed teachers into the new standard. As a result, the data set, described below, includes teachers who are in the work force despite failing to meet a standard that was in place during their tenure in the work force. Furthermore, because states set different cut scores, I can explore the pass/fail signal for different points in the dis-tribution that have been judged to be valid based on the standard-setting procedures used in other states.
The nonrandom distribution of teachers across students is another potential source of bias. A significant amount of research (for example, Lankford, Loeb, and Wyckoff 2002; Loeb 2001) shows that more-advantaged students, in terms of family income and parental education, tend to be assigned to higher-quality teachers, as measured by such characteristics as experience, degree level, and test performance. Further-more, nonrandom matching is likely to produce upwardly biased teacher coefficient estimates (Clotfelter, Ladd, and Vigdor 2006). To address this problem, I exploit the longitudinal nature of the data set to estimate variants of Equations 1 and 2 that in-clude school or student fixed effects (the measure of prior achievement,At-1, is omit-ted from the student fixed-effects models).
A third potential source of bias is that attrition from teaching is unlikely to be ran-dom. A large literature suggests that teachers with higher levels of demonstrated academic skills (measured by standardized tests) are far more likely to leave the pro-fession (Hanushek and Pace 1995; Murnane and Olsen 1990; Podgursky, Monroe, and Watson 2004; Stinebrickner 2001; 2002). Nonrandom attrition also can be a source of bias if academic skills are correlated with teacher quality. I address this issue by
focusing on a subsample of novice teachers to see whether the estimates of the re-lationship between licensure test performance and teacher effectiveness appears to be different for the subsample.
IV. Data and Descriptive Statistics
I use data drawn from administrative records maintained by the North Carolina Education Research Data Center (NCERDC) for the North Carolina Department of Public Instruction of (NCDPI). The records include all teachers and students in the state over a 10-year period (covering school years 1994–95 though 2003–2004).5 The data are unique in that they permit the statewide linkage of stu-dents and teachers (at the elementary level) and the tracking of both over time. They also include detailed student background information such as gender, race and eth-nicity, parental education, disability and free or reduced-price lunch status, as well as performance on end-of-grade reading and math tests (described in more detail in the North Carolina Standard Course of Study 2005), which are vertically aligned and explicitly designed to measure student achievement growth.
The teacher data include such variables as degree and experience levels, licensure status, the college from which the teacher graduated, and the teacher’s performance on one or more licensure exams. From the 1960s through the mid-1990s, individuals wishing to become teachers in North Carolina were required to pass the National Teachers Exams (NTEs)—two-hour multiple-choice tests in specific specialty areas. The NTEs were replaced by the Praxis series of exams starting in the 1990s. The Praxis series include the Praxis I, a basic reading, writing, and mathematics skills test, and the Praxis II, a sequence of tests that focus on specific subject-matter knowl-edge and/or pedagogical preparation (for more information, see the ETS website: www.ets.org/praxis).
As of July 1997, elementary school teachers in North Carolina (the focus of this study) were required to attain certain levels on specific Praxis II tests (0011 and 0012): the Praxis II Curriculum, Assessment, and Instruction (Curriculum) test and the Praxis II Content Area Exercises (Content) test. However, teachers entering later-ally into the work force after July 1997 also could meet the testing requirement with acceptable scores on either the NTE or the Graduate Record Exam (GRE). Some teachers in our sample also took the Praxis tests prior to the state’s requiring it in 1997 (likely because the tests were required in another state), and a number of teacher records also include scores on the Praxis I because it has been required for admission into North Carolina-approved teacher preparation programs. As a result of the long-standing testing requirements in North Carolina, the data include information on some type of teacher test for over 91 percent of the North Carolina teacher work force.
All teacher tests are normalized (to have a mean of zero and standard deviation of one) to place teachers on the same metric. The Praxis tests are normalized relative to all Praxis test takers in a given year based on national means and standard deviations for each Praxis test in each year of test administration. In theory, this normalization is
5. Student information for fifth- and sixth-graders for 1996-97 is missing from the data set.
not necessary as the tests are designed to be equivalent across years such that the tim-ing of the test administration should not influence a candidate’s performance (Edu-cational Testing Service 2005). Nevertheless, the normalization is useful in order to place teachers who took different Praxis tests or the NTE on the same metric.6
Some teachers have multiple test scores on their record, either because they took a single test multiple times (in order to pass a performance threshold), because they took multiple Praxis II area tests, or because they did their teacher training in North Carolina (where most institutions require the Praxis I). I use these multiple tests to construct a ‘‘compositez-score’’ for teachers, which is simply the average of a teacher’sz-scores on individual licensure tests.
In 1997, North Carolina’s cut score on the Curriculum test was 153 while the cut score on the Content test was 127. In 2000, the state eliminated individual test mini-mums and replaced them with a two-test combined cut score of 313. This change, cou-pled with the fact that applicants are allowed to take tests multiple times (each of the scores are reported in the teacher’s record) and bank their scores, means that some teachers have relatively low reported scores for some tests. In addition, teachers may teach in a North Carolina school without meeting the Praxis II requirement with a temporary license that is valid for one year, but must then achieve an acceptable score on the Praxis II in order to continue teaching (North Carolina Department of Public Instruction 2003). I take advantage of the policy shift in 2000 to address some concerns about sample selection by identifying teachers in today’s work force who were hired under the 1997 cut scores but who would not have been granted entry under the 2000 cut scores, and vice versa. In addition, I focus on the pass/fail signal associated with the established cut scores in Connecticut, a state in which many North Carolina teachers would be ineligible to teach (based on their existing reported Praxis scores). The student achievement measures in the data come from state-mandated stan-dardized reading and math tests that are tied to the North Carolina Standard Course of Study (2005). These criterion-referenced tests are vertically aligned and used by the NCDPI’s Accountability Department to determine performance and growth goals and ratings for all schools as part of the state’s ‘‘ABC’’ education reform program. All student test scores are normalized within grade and year to have a mean of zero and a standard deviation of one. Thus, the coefficient estimates from the models de-scribed above measure the predicted impact of the independent variables on a stu-dent’s standing within the performance distribution (in standard deviation terms); a positive coefficient on the teacher licensure test variable would therefore indicate that teachers who perform better on licensure tests are predicted to have students who experience gains in the performance distribution relative to their peers.
The analysis is restricted to teachers who reported teaching a self-contained class and who have valid NTE and/or Praxis test scores. It is also restricted to students in Grades 4-6 who have a valid math and/or reading pre-test and post-test score (for
6. I am grateful to ETS for supplying the test distribution information necessary to normalize the Praxis scores. I could not obtain similar information for the NTE, so I normalized the distribution to have a mean of zero and a standard deviation of one based on the performance of teachers in North Carolina (the sample in each year). An alternative is to norm the NTE based on the year in which teachers sat for the exam. I opted against this because I could only do it relative to the teachers who are in the North Carolina teacher work force from 1994-95 to 2003-2004, and there is clear evidence (discussed below) of nonrandom attri-tion from the teacher work force.
example, the end-of-year fourth-grade math score would be used as the post-test when a student’s end-of-year third-grade math score was used as the pretest).7The argument for these restrictions is that they allow an analysis for a group of students who are highly likely to be matched to their teachers of math and reading.8The re-stricted sample includes 24,237 unique teachers (71,183 teacher observations) and 722,166 unique students (1,172,019 teacher-student observations).
Table 1 reports sample statistics for select variables by teacher licensure-test perfor-mance quintile. The means reported here are derived by averaging across all teacher-year observations in a given quintile, thus represent the characteristics faced by the average teacher within a given licensure performance classification. There appear to be significant differences in both the characteristics of teachers who fall into different quintiles and in the characteristics of the students they teach. In particular, teachers who fall in the lower quintiles of licensure performance are much more likely to be minority teachers and they tend to be teaching more minority and disadvantaged stu-dents. However, there are no clear trends for student performance—for instance, the magnitude of growth for both subjects varies by little more than one point in Grades 3-4 and 4-5 across all quintiles, and moving further up the test distribution does not consistently imply higher levels of growth at any grade level or in either subject.9
V. Results
This section describes the findings on the value of using teacher li-censure tests as a screening mechanism and as a signal of teacher quality. Subsection A explores the value of licensure tests as a screening device for teacher quality using the sample of teachers who have valid Praxis II tests on their record. I identify the screening value of licensure testing by comparing teachers who pass a particular li-censure test standard (several different cutoff standards are explored) to those who fail to achieve that standard. Subsection B focuses on the signal value of licensure tests, first using the sample of teachers who have valid Praxis II tests and then ex-panding the sample to all teachers with a valid licensure test reported on their record (Praxis or the previously used NTE). These models identify the value of licensure testing as a signal of teacher quality through variation in teacher test performance.
7. While not reported, I have experimented with other samples—including a larger sample created by relaxing the requirement that teachers be in a self-contained classroom and instead matching teachers to students based on the subject code of class (that is, a teacher is reported as teaching a reading or math class). The findings discussed in the next section are not materially affected by the variations in the sample used for the analyses. Furthermore, the great majority of sixth grade students in North Carolina are enrolled in middle schools, thus restricting the sample to include only self-contained classes eliminates most sixth-graders (they make up, in total, 1.9 percent of the student observations used in the analysis). For a discus-sion of the changes to a sample resulting from relaxing the restriction to self-contained classrooms, see Clotfelter, Ladd, and Vigdor (2003).
8. Teachers and students are matched based on the teacher of record listed on a student’s state test. Students are not tested prior to the third grade and they almost always switch teachers for grades above the sixth grade.
9. Student test-score growth means are computed by first averaging the growth in that subject among all students in a given teacher’s class in a single year, then averaging across all teacher-year observations in a given test quintile.
Table 1
Selected Sample Statistics by Teacher Licensure Test Score (Composite Z-score) Quintiles (standard deviations in parentheses)
Teacher Licensure Test Quintiles
Quintile 1 Quintile 2 Quintile 3 Quintile 4 Quintile 5
Student test scores
Reading Math Reading Math Reading Math Reading Math Reading Math
Table 1 (continued)
Teacher Licensure Test Quintiles
Quintile 1 Quintile 2 Quintile 3 Quintile 4 Quintile 5
Years of
Sample size 14,022 14,071 14,022 14,072 14,021 14,069 14,022 14,073 14,021 14,068
Finally, Subsection C explores the potential sources of bias resulting from sample selection, the nonrandom match of teachers to schools and classrooms, or to non-random teacher attrition from the labor force.
Prior to focusing on the teacher testing variables, a few peripheral findings war-rant brief notice. In both reading and math and across the model specifications reported below, minority students (black and Hispanic), male students, participants in the free and reducprice lunch program, students whose parents have less ed-ucation, and/or students with reported learning disabilities score lower than their reference groups. Teacher quality has a much larger impact on student achievement than other schooling variables such as class size: Using a fixed-effects model, a 1 standard deviation increase in teacher quality is estimated to increase student achievement by about 31 percent of a standard deviation in both math and read-ing.10 This effect is significantly larger than that found by Rivkin, Hanushek, and Kain (2005) and Rockoff (2004), but in line with that of Koedel and Betts (2005). As Koedel and Betts describe in their paper, the difference in magnitude of the findings may be due to the sensitivity of the testing instrument (for example, the degree to which there are test-ceiling effects).
Consistent with much of the educational productivity literature (for example, Hanushek 1986; 1997), little evidence exists that a teacher having a masters degree (or higher) is a signal of teacher effectiveness. My findings also suggest that students of teachers who graduate from a North Carolina-approved training program outper-form students whose teachers do not (that is, teachers who get a degree from an al-ternative state program or from a program outside the state) by about 1 percent of a standard deviation. Furthermore, consistent with recent evidence that National Board for Professional Teaching Standards (NBPTS) certification serves as a signal of qual-ity (Cavalluzzo 2004; Goldhaber and Anthony 2007), I find that teachers certified by NBPTS outperform noncertified teachers by 1 to 4 percent of a standard deviation, with larger effects in math. By contrast, I find only spotty evidence in the student math-achievement models, and none in the reading-achievement models, that grad-uating from a more-selective college (based on the average institutional SAT of the college from which teachers graduated) leads to increased student achievement, and the effects are consistently small.
Finally, I find that teachers see the largest gains in productivity during the early years of their career. Students with a teacher who has one to two years of experience outperform students with novice teachers by 3 to 7 percent of a standard deviation; dents with teachers who have three to five years of experience tend to outperform stu-dents of teachers with one to two years of experience by an additional 2 percent of a standard deviation (though the difference is not statistically significant across all model specifications). I find little evidence, however, of statistically significant pro-ductivity gains associated with increases in experience beyond five years. The findings on teacher experience are broadly similar to those reported in Boyd et al. (2006a); Clotfelter, Ladd, and Vigdor (2006); and Rivkin, Hanushek, and Kain (2005).
10. The impacts on student achievement reported here extract the signal from the noise within the variance of estimated teacher fixed effects, since the raw standard deviation of teacher fixed effects will otherwise overstate the impact on achievement due to noise created in estimation of the fixed effects for each teacher. See Koedel and Betts (2005) and Rockoff (2004) for further discussion of the methodology employed here.
A. Licensure Tests as a Screening Device
Table 2 reports the estimated relationship between student achievement and whether a teacher passes or fails the licensure exam based on a set state standard. The models correspond to Equation 1 from Section III, and include an unusually rich set of stu-dent background controls (the specific indepenstu-dent variables used in each model specification are reported in notes below the table), but they exclude any teacher var-iables as I am interested only in assessing the pass/fail screening value of the test. The coefficients change very little, however, when the models include additional teacher controls.11
I begin (in Column 1 for reading and 4 for math) by exploring whether North Carolina’s current cut score (which is a combined score of 313 on the Praxis II tests) serves as a screening device for teacher quality. In the pass/fail models, I focus on the subsample of teachers for whom the Praxis II (the required state test in North Car-olina) information is available. Because teachers may teach in a North Carolina school with a temporary license that is valid for one school year without meeting the Praxis II requirement, the sample includes some teachers who have not met the current testing requirement. Additionally, the sample includes some teachers who took the Praxis tests prior to 2000 whose scores would have made them ineli-gible to teach based on the new 2000 standard. In total, 372 teachers (for whom Praxis II information exists) in the sample have taught in the state without having met the state’s 2000 licensure test eligibility requirements.12The positive coefficient estimates on the pass/fail indicator variable, which provides a comparison of the teachers who did not meet the 2000 standard to teachers who did, suggest there is a value to using licensure tests as a screen: Teachers who meet the current North Car-olina standard are more effective in math than teachers who do not, by about 6 per-cent of a standard deviation. The findings for reading are smaller (about 2 perper-cent of a standard deviation) and only marginally significant (at the 12 percent level).
As noted in Section III, there is reason to believe that sample selection could bias the estimated impact of passing the licensure test relative to failing it. In particular, I would hypothesize a downward bias in the estimate of the North Carolina pass/fail coefficients, as it is possible that teachers who are in the profession, despite not meet-ing the standard, might have unobserved attributes that make them effective in the classroom. An interesting question to consider—although it does not directly address this potential source of bias—is the extent to which the pass/fail coefficient changes if a different cut score is utilized. For example, if I arbitrarily declare a much higher cutoff, suddenly more so-called failures will appear in the sample. The test’s devel-opers (ETS), however, caution against such arbitrariness, saying that scores other
11. Recall the argument for excluding the teacher variables is that states do not require information on the aforementioned characteristics, so they should not be included in the models that identify the value of the pass/fail licensure test signal. The effect of these teacher characteristics on student achievement is captured by the licensure test variables (as well as the other variables included in the model) though their partial correlations.
12. 301 teachers in this subsample did not meet the 2000 standard but are teaching under a temporary license; 41 teachers met the 1997 state standard but, based on their reported scores, would not have met the 2000 test standard and were grandfathered in; and 30 teachers taught under a provisional license prior to 2000 but had scores that failed to meet either the 1997 or 2000 standard.
than the cut score may not have the same predictive value (for instance, because of increased measurement error away from the cut point).
But what about another state’s cut score, or a previous cut score in North Carolina? Surely state education policymakers do not consider their cut scores to be arbitrary? North Carolina’s earlier (1997–2000) standard offers one interesting comparison, and Connecticut’s pass/fail standard offers another. While Connecticut’s standard isn’t directly comparable to the current North Carolina combined cut score, it is directly comparable to North Carolina’s earlier two-test standard. Both states had (and Con-necticut still has) cutoff requirements on the same two subsections (Curriculum and Content) of the Praxis II test. The Connecticut requirements, however, were about 0.6 standard deviations higher than North Carolina’s 1997 requirement on the Cur-riculum test and 1.75 standard deviations higher than the requirement on the Content test.13 Consequently, a significant portion of the North Carolina teacher sample would not be eligible to teach based on the Connecticut standard.14Given that Con-necticut is using the assessment to determine teaching eligibility, one can reasonably assume that its standard is valid around its cut score.
Columns 2 (for reading) and 5 (for math) of Table 2 report the results for the value of the pass/fail indicator for the 1997–2000 North Carolina pass/fail signal. A com-parison of Columns 1 and 2 (for reading) and 4 and 5 (for math) shows that the es-timated value of the pass/fail signal does not change much when moving from the current North Carolina standards back to the standards utilized between 1997– 2000.15Given that the standard did not significantly change with North Carolina’s adoption in 2000 of the combination score requirement (getting a combined 313 on the two Praxis tests), it is not surprising that the coefficient estimates are quite similar to those for the current licensure standards, as there also isn’t a significant change in the sample of test failers.
Columns 3 (for reading) and 6 (for math) of the table report the results of using a significantly higher cutoff standard. This analysis provides an unbiased indication of what the impact of the Connecticut test would be, were the potential pool of teachers to be the North Carolina teacher work force. Contrary to what one would expect if sample selection led to a downward bias in the estimated effects of the licensure test pass/fail coefficients, the coefficient on the higher Connecticut standard is actually quite a bitsmallerthan the estimates based on the lower North Carolina standard. The Connecticut standard appears to be a weaker signal of quality, at least as judged
13. These differences are based on the national distributions on the Praxis II tests obtained from ETS. Con-necticut requires a 163 on the Curriculum, Instruction, and Assessment test and a 148 on the Content Area Exercises test (for information on state requirements, see http://www.ets.org/portal/site/ets/menuitem.22 f30af61d34e9c39a77b13bc3921509/?vgnextoid¼d378197a484f4010VgnVCM10000022f95190RCRD). 14. There are 1,278 teachers in North Carolina whose reported scores would have made them ineligible to teach in Connecticut based on the Connecticut Praxis cutoff requirements. Though the difference in com-bined scores is small (and Connecticut actually has a lower comcom-bined requirement), the fact that Connect-icut requires minimum scores on both exams means that many teachers who just meet or slightly exceed the combined requirement in North Carolina will fail by Connecticut standards unless they happen to get the exact distribution of scores dictated by Connecticut’s minimum scores for each test.
15. Of the 372 teachers who did not meet the state’s 2000 standard, 224 have reported test scores that either did meet or would have met the earlier 1997 standard. Conversely, there are 20 teachers whodidmeet the 2000 standard (combined score) but who, based on their reported test scores, would not have met the earlier 1997 standard—yielding a total of 168 teachers in the sample who did not meet the earlier 1997 standard.
by the magnitudes of the pass/fail coefficients. The finding that raising the bar to the Connecticut standard reduces the magnitude of the pass/fail coefficient results from the fact that a significant proportion of the sample gets reclassified (about 7.5 per-cent); this reclassification increases the estimated average teacher contribution to stu-dent achievement of failing teachers while having almost no impact on the estimate of the average contribution of passing teachers.
B. Licensure Tests as a Signal of Teacher Quality
The signal value of licensure test performance for teachers in the work force is an important policy issue, as local school districts might wish to use this signal in help-ing to make hirhelp-ing decisions. To investigate the signal value, I estimate student achievement models (corresponding to Equation 2) that focus on the entire teacher test-performance distribution, using model specifications that include dummy varia-bles indicating the quintile of teacher performance on the test (the lowest quintile being the reference category).16Unlike the pass/fail models discussed above, these models include a full set of teacher variables to represent the fact that districts have more information about teachers during the hiring process and likely care about the information value of tests beyond that provided by the other teacher variables. Table 2
Licensure Test Performance as a Screen: Relationship Between State-Imposed Teacher Test Score Requirements and Student Achievement (robust standard errors in parentheses)
Sample size 173,522 173,522 173,522 174,589 174,589 174,589
**, *: Significant at 1 percent and 5 percent confidence level, respectively.
Note: Sample sizes reflect student-teacher observations. In addition to the variables specified above, the models also include the following controls: grade-level, year, a student’s pretest score, grade, race/ethnicity, gender, free/reduced-price lunch status (free/reduced-price lunch information is available for 1999 and be-yond), parental education (whether a parent has a BA), Limited English Proficiency status, learning disabil-ity status, class size, and percent minordisabil-ity in the class. Mean value replacement was used for cases where values for the explanatory variables were missing. Reported standard errors are corrected for clustering of students within classrooms.
16. While not reported here, models that allow for a linear relationship between the teachers’ composite z-scores and student achievement suggest a small positive relationship between the two. Specifically, the point estimates suggest that a 1 standard deviation change in teacher test-score performance is predicted to increase student test scores by slightly less than 1 percent of a standard deviation in reading and slightly less than 2 percent of a standard deviation in math. These results are along the same order of magnitude as those of Clotfelter, Ladd and Vigdor (2006) and Goldhaber (forthcoming).
Table 3 presents the estimated coefficients for several different tests that are avail-able on teacher records. Recall that two distinct Praxis II tests are currently required by the state: the Curriculum test and the Content test. Columns 1 and 3 report the estimated coefficients of student reading- and math-achievement models that include teacher licensure performance on the Content test, and Columns 2 and 4 report these estimated coefficients for the Curriculum test. Casual observation suggests rel-atively little evidence that the Content test predicts student achievement in either math or reading. The Content test is only statistically significant for the top quintile of performance (relative to the bottom quintile) in math. By contrast, there is far more evidence that the Curriculum test provides a signal of teacher effectiveness. While not all of the quintile coefficients are statistically significant, the point esti-mates in reading suggest a consistent positive relationship between teacher perfor-mance on the test and student achievement, andF-tests reject the null hypothesis of no significance for both math and reading achievement. The coefficient estimates of the two teacher tests are surprisingly similar when both tests are entered into the same model (they only change in the thousandths place), and anF-test shows the coefficients on the curriculum test quintiles remain marginally statistically significant (above the 90thpercent confidence level in both math and reading).
Teachers who score in the top quintiles on the Curriculum test appear to be signif-icantly more effective: In the reading models, relative to the bottom quintile, students of teachers in the top quintile score about 2.2 percent of a standard deviation higher. In the math models, the point estimate suggests that students of teachers scoring in the top quintile would have math achievement scores that are about 3.5 percent of a standard deviation higher than students whose teachers score in the bottom quintile. And, while the other coefficients are not statistically significant, the pattern of results (the upward trend between teacher performance and teacher effectiveness) is consis-tent with the findings in the reading models.17
When I expand the sample to the ‘‘composite z-score sample,’’ which includes teachers who haveanylicensure test on their record (and therefore many more ex-perienced teachers), the findings are even stronger.18The results from these model specifications are reported in Columns 3 (for reading) and 6 (for math). In reading, there is a clear upward trend between teacher licensure performance and student achievement. Teachers in Quintile 2 are estimated to produce student achievement gains that are 1.5 percent of a standard deviation higher than those of teachers who score in the lowest quintile. Teachers in Quintiles 3 and 4 are estimated to pro-duce student achievement gains of just over 2 percent of a standard deviation higher (the difference between these quintiles is not statistically significant), and teachers in Quintile 5 are estimated to produce student achievement gains that are about 3 per-cent of a standard deviation higher than teachers at the bottom (the difference be-tween Quintiles 5 and either Quintiles 3 or 4 is statistically significant).
17. Many teachers in the state also have a Praxis I test score on their records, because this test is required by most in-state teacher training institutions. While I do not report the results here, I find evidence that teachers who do well on the math component of the test are more effective in teaching math.
18. The use of the compositez-score allows me to include in the models information from the full sample of teachers (for whom any licensure exam score—NTE, Praxis I, or Praxis II—exists on a teacher’s record), and not just teachers hired after 1996 at the time the Praxis test came into use.
I also estimated model specifications exploring whether the signal value of licen-sure tests may be different for different types of teachers or students. I do not report these here, but in general, the pattern of results reported in Table 3 is found for both black and white teachers and for the various subgroups of students: Students who have higher-performing teachers tend to have higher achievement levels in both read-ing and math. In particular, it does not appear that racial test prediction bias (Vars and Bowen 1998) exists in the context of licensure testing, as models that allow the licensure test-student achievement relationship to differ by teacher race (for ex-ample, by including race licensure quintile interaction terms) show little evidence that it does so. There are, however, some interesting differences in findings across student types: for example, the impact of having a higher-scoring teacher tends to be larger for nonblack students and for students who are not eligible for free and reduced-price lunch.19
On the whole, my findings suggest that teacher test performance, particularly on the Curriculum test, does provide a signal of teacher effectiveness across the perfor-mance distribution for different types of teachers teaching different types of students; however, as I noted in Section III, there are at least three sources of bias that threaten the assessment of the licensure test signal.
C. Threats to the Validity of the Measure of the Teacher Licensure Test Signal
1. Sample Selection
The potential for bias arising from sample selection is difficult to address in the con-text of this data, because teachers who are not in the work force are not observed. Nevertheless, there are compelling reasons to believe that sample selection is not a significant problem. First, empirical evidence suggests that relatively few teachers (no more than 10–15 percent) are screened out of the labor market by licensure tests (Angrist and Guyan 2004). Second, a significant share of the sample of North Carolina teachers used here actually failed the North Carolina standard because of the shifts in state policy. Third, a considerable number of teachers in the sample (17 percent) have multiple scores for the same test because they initially failed to achieve the required cutoff. Using this information, I estimate the pass/fail models based on a teacher’s lowest reported score to see whether teachers who initially fail a test but pass on a retake appear to be systematically different from teachers who pass on their first attempt. The estimated coefficients from models that utilize a teacher’s lowest reported score are not appreciably different from those reported in the models specified in Table 3. Furthermore, I find no evidence from models that include a dummy variable indicating an initial (or multiple) test failure that teachers who retake a test are systematically different from teachers who do not.
Finally, the shift from the North Carolina standard to the higher Connecticut stan-dard actually lowered the strength of the pass/fail signal, rather than increasing it. Were it the case that individuals in the teacher labor market with failing scores
19. Some evidence also exists, particularly in math, of the type of role-model effects found by Dee (2004). For example, while not consistently statistically significant, the magnitude of the estimates suggest that black teachers who are teaching black students tend to outperform black teachers who are teaching white students.
Table 3
Licensure Test Performance as a Signal: Relationship Between Teacher Test Performance and Student Achievement (robust standard errors in parentheses)
Reading Math
Teacher Licensure Performance Along the Test Distribution (reference group is bottom quintile)
Quintile 2 0.003
Teacher sample Praxis II subsample Compositez-sample Praxis II subsample Compositez-sample
R2 0.66 0.66 0.68 0.70 0.70 0.71
Sample size 173,522 1,081,142 174,589 1,087,226
**, *: Significant at 1 percent and 5 percent confidence level, respectively.
Note: Sample sizes reflect student-teacher observations in each of the teacher samples indicated. The models include the student controls described in Table 2, as well as the following teacher controls: a teacher’s race/ethnicity, gender, teaching experience (indicated with a series of indicator variables), whether a teacher is certified by the National Board for Professional Teaching Standards, license type (Continuing, Temporary, Provisional, Initial), whether a teacher received a degree from an education program approved by and located in the state of North Carolina, whether a teacher has an MA or higher degree, and selectivity of the college from which a teacher graduated. Reported standard errors are corrected for clustering of students within classrooms.
Goldhaber
tended to have unobservable attributes positively correlated with student achieve-ment, one would expect the increase in the standard to increase the magnitude and significance of the pass/fail indicator variable, and a smaller percentage of the teacher observations falling into the failing category would have positive errors—a point buttressed by a closer examination of the signal value of the tests along the distribution.
Bias in the signal value of the teacher licensure test is most likely due to teachers who are in the labor market despite having failed to achieve the required cutoff score. Thus, one might expect the signal value associated with linear changes in the score to be different for these teachers. To test this theory, I employ a quasi-regression discon-tinuity approach in estimating a model where the licensure score is entered as a linear explanatory variable, but which also allows the slope and intercept of the licensure score coefficient to vary above and below the cutoff score. Further, in this model I restrict the sample to teachers who have entered the labor force since 2000, to create a sample of teachers who clearly entered the teacher labor market despite having failed to achieve the post-2000 North Carolina test cutoff requirement. AnF-test fails to reject the hypothesis that the slope and intercept of the licensure test for failing teachers is different than it is for passing teachers, suggesting that no bias exists. While all the above specification tests are imperfect ways of assessing the implica-tions of having mainly test-eligible teachers in the sample, none of the tests suggests that this type of sample selection leads to systematic bias in the estimates of the pass/ fail signal.
2. Nonrandom Teacher Sorting
A second threat to the validity of the measure of the teacher test signal is that the estimates of the teacher test coefficients are biased due to nonrandom matching of teachers and students: evidence exists that teachers tend to sort across students such that the more senior, credentialed teachers are teaching the higher-achieving students (Lankford, Loeb, and Wyckoff 2002), and that this sorting pattern affects the esti-mated returns to teacher characteristics (Clotfelter, Ladd, and Vigdor 2006; Gold-haber and Anthony 2007). I address this issue by estimating models that include school and student fixed effects, which are reported in Table 4. In these specifications, the teacher effects are identified based on variation in teacher qualifications within schools across classrooms (in the case of the school fixed-effects model) and across students over time (in the case of the student fixed-effects model).20I do not estimate model specifications that include both school and student fixed effects, as models would be identified solely by students who switch schools.
I utilize the ‘‘compositez-score sample’’ for the model specifications in Table 4. For comparison purposes, the coefficient estimates for models that do not include fixed effects are reported in Columns 1 (for reading) and 4 (for math). Columns 2 and 5 report the specifications that include school fixed effects, and Columns 3 and 6 report the specifications that include student fixed effects. An examination of the full sample (the novice teacher sample is discussed below), reported in Panel A
20. A lagged measure of student achievementis notincluded in these models, though the inclusion of this lag does not appreciably change the coefficients of the teacher licensure test variables.
Table 4
Testing for Potential Sources of Bias: School and Student Fixed-Effects Specifications (robust standard errors in parentheses)
Composite
Z-score Quintiles
Reading Math
1 2 3 4 5 6
Teacher Licensure Performance Along the Test Distribution (reference category is bottom quintile) Panel A. Full Teacher Sample
Quintile 2 0.015**
Fixed effects None School Student None School Student
R2 0.68 0.68 0.93 0.71 0.71 0.94
Sample size 1,067,235 1,067,235 1,067,235 1,073,172 1,073,172 1,073,172
Panel B. Novice Teacher Sample
Table 4(continued)
Composite
Z-score Quintiles
Reading Math
1 2 3 4 5 6
Quintile 4 0.022
(0.015)
0.036* (0.014)
0.003 (0.035)
0.046* (0.020)
0.071** (0.018)
0.006 (0.035)
Quintile 5 0.027
(0.015)
0.035* (0.015)
-0.008 (0.038)
0.069** (0.020)
0.089** (0.019)
0.001 (0.035)
Fixed effects None School Student None School Student
R2 0.68 0.69 0.99 0.70 0.73 0.99
Sample size 75,554 75,554 75,554 76,019 76,019 76,019
**, *: Significant at 1 percent and 5 percent confidence level, respectively. Note: Sample sizes reflect student-teacher observations. Models include the same set of controls as those specified in Table 3, with the exception of the student fixed-effects models (Columns 3 and 6), which do not include a lagged test score nor time-invariant student characteristics. Reported standard errors are corrected for clustering of students within classrooms.
786
The
Journal
of
Human
of Table 4, illustrates that school and student fixed effects are significant predictors of student achievement in both reading and math models.21And the results of these models suggest that teacher sorting accounts for some of the positive correlation be-tween teacher and student test performance. The comparison bebe-tween similar models that do not include fixed effects (Columns 1 and 4 for reading and math, respectively) with the school fixed-effects models (Columns 2 and 5, respectively) or with the stu-dent fixed-effects models (Columns 3 and 6, respectively) shows a marked decrease in the point estimates for the teacher test-performance quintile variables.
In reading, the coefficient estimates drop by around half (for each quintile) when moving from no fixed effects to school fixed effects. The decrease in the magnitudes of the quintiles is smaller when moving from school to student fixed-effects models, and there are no longer statistically significant distinctions between the top four quin-tiles; however, the point estimates continue to suggest that teachers in any of the top four quintiles are more effective than teachers who score in the bottom quintile. In math, the magnitude of the teacher performance quintiles drops when moving from no fixed effects to school fixed effects to student fixed effects, but the drop in mag-nitude is far less, percentage wise, than in the reading models. And, in the math mod-els there continues to be a statistically significant difference between teachers at the top of the distribution and teachers below.
In sum, the results show that the nonrandom sorting of teachers across schools and students does have an impact on the estimated relationship between teacher test per-formance and student achievement; however, the findings continue to suggest that performance on licensure tests does provide a signal of teacher effectiveness. Finally, results from fixed-effects specifications of the teacher pass/fail models are not mate-rially different from the estimates reported in Table 2. The coefficient estimate from the reading pass/fail model with school or student fixed effects is not statistically sig-nificant, as was the case before. The coefficient estimate from the math pass/fail model with fixed effects is smaller (suggesting effects in the range of 3 to 4 percent of a standard deviation), but still statistically significant. Thus, it does appear that, at least for math achievement, the state cutoff represents an important teacher-quality screen.
3. Nonrandom Teacher Attrition
To address the final identified threat to the assessment of the validity of the licensure test signal—nonrandom attrition from the sample—I focus on a sample of novice (first-year) teachers, replicating the model specifications reported above for Panel A of Table 4.22The estimated coefficients from these novice teacher models, without fixed effects (Columns 1 and 4), with school fixed effects (Columns 2 and 5), and with student fixed effects (Columns 3 and 6), are reported in Panel B of Table 4.
The findings from models with no fixed effects, as well as models with school fixed effects, tends to confirm what I reported earlier: Teacher licensure test perfor-manceisa signal of teacher effectiveness. If anything, these results suggest a stron-ger signal of licensure test performance: Outside of the student fixed-effects models,
21. Thepvalues for allF-tests fall below 0.01.
22. This sample includes 4,639 unique teachers and 76,019 unique students.
the magnitudes of the coefficients are consistently larger in the novice subsample than the full teacher sample (a comparison of estimates across Panels A and B) and this is true for both reading and math achievement models. This is, in fact, what one would expect if the teachers who do well on the licensure exam and leave the North Carolina teacher work force are the same ones who tend to produce a high level of value-added for students.
The story is quite different for the student fixed-effects models, as few of the coef-ficients are statistically significant for either math or reading achievement. I interpret these findings cautiously, however—the student fixed-effects models are identified by students who have at least two consecutive novice teachers, and this sample of stu-dents is relatively small (3,900). Since student assignment is clearly not random, with low-achieving students tending to be assigned to less-experienced and less-credentialed teachers (Lankford, Loeb, and Wyckoff 2002), there is some concern that students who are repeatedly assigned to novice teachers are systematically different from other stu-dents in ways that are not accounted for by the time-invariant student effects.
VI. Public Policy Implications and Conclusions
Licensure testing as a requirement for employment in public schools is widespread, despite the fact that little quantitative research exists showing its ef-ficacy. The results presented here generally support the hypothesis that licensure tests are predictive of teacher effectiveness, particularly in teaching mathematics, and the finding is robust to alternative specifications of the model, including specifications that account for nonrandom sorting of teachers across students. If states are seeking criteria to ensure a basic level of quality, then licensure tests appear to have some student achievement validity.
What do the results mean in terms of student achievement? That depends on how teacher tests are used in shaping the teacher work force. The most straightforward use of licensure tests is in determining employment eligibility, and the point esti-mates from North Carolina’s pass/fail cutoffs suggest that teachers who pass the test produce, on average, student achievement gains that are in the range of 3 to 6 percent of a standard deviation higher (in math) than teachers who fail.23The approach usu-ally employed to interpret the magnitude of an educational intervention is to measure the effect size relative to the standard deviation of the test (either the level, as is done here, or the gain). Recent work, however, suggests that this method may understate the true impact of the intervention because of measurement error inherent in any type of testing (Boyd et al. 2006b).24
23. Based on the findings from Column 4 of Table 2 and similar models (not reported) that include either school or student fixed effects.
24. This study shows that measured effects relative to estimates of the standard deviation of theuniversal score (an estimate of the underlying academic achievement, purged of test measurement error) substantially understate the effects of educational resources when the effects are measured relative to the standard de-viation of studentgainscores. In this case, the findings suggest that the true impacts of educational resour-ces may be as much as four times larger. However, the degree to which effects are understated when using the standard deviation in test scorelevelsis far lower, on the order of 25 percent.