PERCEPTU4L QUALITY OF GEOMETRICALLY DISTROTED IMAGES PART 1: THE Hf JMOGENITY-BASEJJ PERCEPTUAL QUALITY MEASUREMENT (HPQM) !won 51erymmn
PERCEPTUAL QUALITY OF GEOMETRICALLY DISTORTED
IMAGES
PART I:
THE HOMOGENITY-BASEI> PERCEPTUAL QUALITY
ャヲeasureャセヲent@ fHPQM)
Iwan Setyawan
(iwan.setyawanra>ieee.org)
Ab!)·fract ·-.:·
Measurement of the perceptual impact of geometric distortions applied to images or
\ideo on human obsen ers is a difficult and not \Yidely researched subject. As a result.
we are currently stiJJ lacking the proper objectiYe methods to measure the perceptual
quality of such distorted images. In this paper. \Ye propose an objectiYe quality
measurement method suitable for assessing the perceptual quality of geometricaJJy
distorted images. In the second part of this series. we "iJJ eYaluate the proposed
system by performing a user test experiment.
k・ケキッイャャNセZ@ Geometric distortion. human Yisual system. perceptual quality
measurement of images
1.
Introduction
Geometric distortion has always been a problem in the deYelopment of
watermarking systems. Tllis distortion happens '"hen the \Yatermarked data undergoes
a geometric operation. This can happen due to Yarious reasons. but basicalh
geometric distortion occurs either due to the explicit application of geometric
transformations or as a by-product of other processes (or attacks). Explicit application
of geometric transformation includes non-malicious operations performed by a user.
for example resizing of an image to fit one· s desk:top. and malicious operations for
example application of random bending to an image using tools such as Stir Mark [ 1]. Examples of processes or attacks that produce geometric distortion as a by-product
are the distortions incurred during the printing and scanning process [2] {due to the
Techne Jurnal Ilmiah Elekiroteknika Vol. 8 No. 2 Oktober 2009 Hal 59- 76
using a hand-held camera in a theatre in the digital cinema scenario [3] (due to the
position ofthe camera lens distortions, etc.).
We can also classify geometric distortion based on its locality. In this respect
geometric distortions can be classified as either global or local. In global geometric distortions. the underlying geometric transformation describing the geometric
distortion applied to the whole image can be described using a single anal)1ical
expressiOn and a smgle set of parameters associated with the expression. ln local
geometric distortions, the underlying geometric transformation uses different
analytical expressions and/or different paran1eter sets for each pru1 of the image.
There are two aspects of geometric distortion that me of interest for the
watermarking coimnunity, namely:
l.l.The watermark de-synchronizing aspect.
Geometric distortion poses a problem for watennru-k.ing systems because it can
de-synchronize the \Yatennark detector. making the watermru-k undetectable. A lot of
reseru-ch effort has been performed in this area \Yithin the watermru-king community.
The reseru-ch effort focusses on three approaches to dealing with this problem. The
first approach is designing \Yatermru-king schemes that are inYariant or insensitiYe to
robust against geometric distortion [4.5]. The second approach inYolves research on
methods (that is independent of the \Yatermark detection) to inYert the geometric
distortion [6,7.8]. Finally, the third approach is to embed a S)nchronization signal in
the \Yatermark. itself to facilitate re-synchronization of the watermark by the
embedder in the eYent of geometric distortion [9].
1.2.
The visual quality degradation aspect.
Geometric distortion degrades the Yisual quality of the" atennarked data. Like
all other distoi1ions that affect "atennru-king systems. distortions due to geometric
transformation are also bounded by the maximum visual quality degradation it can
incur 「・ヲッセ・@ the dist011ed image loses ru1y commercial Yalue. It is therefore important to be able to measure such distortion. The result of such measurement can be fed back
into the design process of \Yatermru·king systems robust against geometric distortions
Tllis aspect of geometric distortion has not been widely discussed in the literah1re. As
a result. we are currently lacking ru1 objectiYe measure to quantify such distortion.
PERCEPTUAL QUALITYOFGEOMETR/CALLY DISTROTEDIMAGES PART/: THE HOMOGENITY-BASED PERCEPTUAL QUALITY MEASUREMENT (HPQM)
!won Serymnm
Existing objecti,·e Yisual quality assessment tools. for example PSNR are not suitable
to be used to quantify ,·isual quality due to geometric disto11ions because they rely on
the pixel-per-pixel relationship between the original and the distorted images. An
image distorted by geometric transformation loses most. if not alL such relationship to
the original image. Measuring a geometrically distm1ed image using PSNR "ould.
tlwrt>fnre 'ield nn meaningful rFsult
In this paper we address the second aspect of the geometric distot1ion problem
for "atermarking systems We propose a new Yisual quality measurement method
suitable for tlli.s class of image distortion. Our approach is based on our preYious work
[I 0]. In this paper "e limit ourseh·es to the Yisual quality measurement of global
geometric distortions on still images. This paper is organized as follows In Section 2.
''"e "·ill present the underlying hypothesis on "·hich our proposed method is based. In
Section 3. we "·ill present how we test the hypothesis and quantify the geometric
distortion applied to an image. In Section 4. '"e ""ill present the test setup we used to
test our proposed method. as well as the results of our experiments. Finally. in Section
5. '"e will present our conclusions and an outlook for further research.
2. The underlying hypothesis
2.1. Modeling global geometric transformation
The number of possible geometric transformations that can be applied to an
image is essentially limitless. TI1e possibility ranges from simple transformations to
more complex ones. An example of geometric transformations is the RST (rotation.
scaling and translation) transform described by the following equation·
(
II
l
=
s(
cos R - sin RJ(
XJ
+ (
セG@
J
v; sm R cos R セ@ y 1, (1)
Ahernatiyely. an example of more complex geometric transformations is the
bilinear transform described by the follo"ing equation·
l
(
u )\=I
(a cj\(
x\j
+(
1..' '\ /Xl'+l
( g 'i)
Techne Jurnal llmiah Elektroteknika Vol. 8 No. 2 Okiober 2009 Hal 59- 76
Due to the Yast number of possible geometric transforms applied to the image.
it is impossible to model each of them individually. There are some approaches that
can be used to soh·e this problem One approach is to use simpler transformation
models. for exan1ple RST or affine transform, to approximate the underlying complex.
global geometric transform [9]. The approach is based on the assumption that a
complex geometric transformation applied on a global scale can be approximated by a
::;unplct iransCurmation mudel applied on more local "rah' \nother pnssib'" approach IS to use orthogonal polynomials to do the approximation [8]. In this
chapter. we use local RST/affine transform to approximate the global underlying
transform
2.2. The hypothesis
At tllis pomt we would like to present our definition of the homvgenelfy of u
global geometric distortion. as follows: A distortion is said to be homogenous
tr
theunderlying global エイ。ョNセGヲHュョ@ can be approximated h)' one R.\'T or ajfine エイ。ョNセヲッイュ@
with one se1 (:{parameters (.tssoclated 'Yl•ifh If. The reader should note that from this
definition we make a distinction between global and homogenous distortions. The
first term refers to the locality "ith \\·Jlich we apply the underlying geometric
transformation. \\bile the second term refers to the locality of the approximation of
the underlying global transformation using RST or affine transforms. In other \Yards.
non-homogenotJs distoi1ions must be approximated by multiple local. RST/affine
geometric transforms These local transforms haYe parameters that are Yaf)·ing from
one part of the image to the other.
The following figure presents an original image. along with two distorted
Yersions of the Image The first distorted Yersion (Figure l(b)) ts the result of rotating
the original image by 3 degrees followed by cropping and rescaling. The second
distorted Yersion (Figure l(c)) is the result of applying a complex sinusoid-based
transform to the original image.
PERCEPTUAL QUALITY OF OEOMETRJCAT.T. Y TJTSTROTEJ) IMAGES PART l: THE HOMOOENITY-BASED PERCEPTE4L QUALITY MEASUREMENT (HPQM)
lw£1n Setymwn
[image:5.495.71.451.51.186.2](a) (h) (<.:)
Figure 1. E':i.:ample of'geometrically distorted images.
From the Yisual quality point of Yiew. it is easy to see that the first distortion is
less disturbing compared to the second distortion. From the distortion homogeneity
point of Yie''· the first distortion can be classified as homogenous. since it can be
approxunated by one RST/affine transform and 1ts corresponding parameter set. The
second distortion is not homogenous. because this distortion has to be approximated
by multiple local RST/affine transforms with parameter sets that are Yarying from one
part of the image to the other.
Based on these obserYations. we propose the following hypothesis regarding
the Yisual quality of geometrically distorted images: The visual qua/1ty ofan image
distorted h)' a global geometric distortion is determined by the degree Hセサィッュッァ・ョ・ゥエケ@
Hセャ@ the geometric distortion The less homogenous the distortion, the wor.1·e the visual
qualify would he. Furthermore. it is ob\ ious that the seyerity of the geometric
distortion itself also determines the OYerall Yisual quality.
We haYe searched the literature to find supporting eYidence for. or arguments
against this hypothesis. The literah1re we considered includes topics in digital
\\atennarking. computer Yision. computer graphics. image coding and medical
sciences. HoweYeL so far we haYe not been able to find any related \YOrk on the
human perceph1al quality assessment for geometrically distorted images.
3. Measuring distortion homogeneity
In order to be able to measure 'isual quality according to our hypothesis. "e
need to be able to measure dist011ion homogeneity. To measure homogeneity. \Ye use
Techne Jurnal Ilmiah Elektrotelmika Vol. 81'
distortion homogeneity by measunng the locality of the simple geometric
transformation used to approximate the global transform.
3.1. Distortion locality approximation
There are tY\O approaches that we can use to find the parameters of the
transformation which best approximate the global distortion. The first approach is
the :,econd approach uses the origmal and disto1ted images 、オ・」エャセN@ In both approaches. we first perform the approximation on a global scale and then. if
necessary. increase the localit\· of the approximation to achieYe the final result.
3.1.1. Approximation using analytical description
In th1s approach. "e assume that "e ktlO\\ the anal} tical description of the
function [)(•) that transforms the original image I into the distorted image !'. Therefore. the registration process can rely on the exact displacement Yector of every
pixel position in the image. Considering a field of displacement vectors for a given
region of the image. the parameters of the simple geometric transformation can be
computed using a least square error optimization. The registration criterion consists of
the mean error 8 of the resulting approximation.
Let (x,.y,) be a set of original coordinates and (11,. v,) be the corresponding set of coordinates transformed by the function D(•). The least square error optimization
consists of fmding the set of transform parameters (p1• p;: .... p11 ) that nunimizes the
cost function c. Let F{•) be the simple geometric transformation function used to
nppro\.imate lhe global geometric distOJtion Tllis function transforms the original
coordmates ( ... y,) h) the corresponding coordmates (x. '. y, ').
r x' \
I ·
:
1
=P(r,. ".
l' ).\.1', j ,· . f
(3)
\Yhere
p (4)
PER('EPTUAL (!UALITYOFOEOMETRICALLY DISTROTED IMA(i£S PART!: THE HO.M()(,'ENJTY-BASED PERf'EPTUAL QUALITY MEASUREMENT (HNJM)
!wan .\'eo mnm
(5)
where parameter hi is a weighting factor. When the simple geometnc transformation
F(•) is the RST modeL this optimization yields a linear system "·hose solution can be
found in [lOI.
3.1.2. Approximation using the original and distorted images directly
In thts approach. we do not assume kno\Yledge of the tmderlying function
describing the global distot1ion. Instead. only the original {!) and the distorted (!')
images are nrailable. We apply the simple geometric transformation to the original
image I to produce rm intermediate image !" The parameters of Lllis simple geometric
transform are taken within a certain range of parameters. There are some strategies
that can be used to search the parameters within this set. for example exhaustiYe
search. gradient search or coarse-to-fine search.
The next step is to compute the approximation error based on pixel mlue {e.g ..
lunlinance or color) comparison. The approximation error c is computed between
r
and I' as foUo\\·s:
B
(1"-I'Y
(6)\\here I" and I' refers to the luminance 'alue of the intermediate and distorted images
(or local areas of those images). respectiYely. The error measurement in Equation (6)
is ,-alid if \Ye assume that only geometric distortion has occurred and there are no
luminance changes (e.g .. brightness or contrast changes) between the original and the
distorted images
3.2. Comparison of the two approximation approaches
The adYantage of the first approach is that it does not inYoiYe actual images
and the computationally expensiYe operations associated \\'ith them. This approach
only compares the pixel position and is therefore faster. Fm1hermore. it enables
precise characterization of a known distortion model The second approach operates
Tcchne Jurnal Hmiah Elektroteknika Vol. R No. :
( e g.. luminance) and is therefore computationally expensi Ye. Ho" eYer. smce the
second approach deals directly with the image content it has some adYantages "hen
"e are trying to assess the quality of the distorted image. Furthermore. this approach
can be used in scenarios where the analytical description underlying geometric
distortion is not ktlO\Yll.
The second approach. as described aboYe. is more sensiti' e in areas \\ith
texture/structure than in flat areas. As a result the locality of the approxunauon Will
be less accurate in flat areas. In other ''ords. the locality of the approximation in flat
areas is less in areas with stmcture. eYen if both areas experience the same geometric
distortion. Since "e base our distortion measurement on the locality of tlus
approximation. this means that in this case the flat area \\til be declared to haYe less
distortion than the area with stmch1re. This property can be seen as an adnmtage of
the second approximation approach oYer the first approach, because a human obserYer
will also be less likely to notice distortion in flat areas. Using the first approach. every
pru1 of the image experiencing the same distortion would yield the same
approximation. This may result in a measurement that does not correspond to human
perception. HoweYer. if one wru1ts to chru·acterize the distortions occurring in a
particular system. it might be adYantageous not to depend on a specific content in
order to measure the aYerage (or worst case) degradation that the system introduces.
In this \York we chose to use the second approach to perform the test on our
hypothesis NeYertheless. similar (although content-independent) results could be
obtained using the first approach.
3.3. The proposed method to measure distortion homogeneity
This section proYides more detailed description of the proposed
Homogeneity-based Percepnial Quality Measurement (HPQM). The HPQM methodology proceeds
by iteratiYe computations of the approximation error mer progressiYely increasing
approximation locality. This operation is repeated until either the approximation error
ts lower than a predetennined threshold or the locality of the transform reaches a
predetermined leYel. We use quadtree partitioning to increase the local1ty of the
approximatiOn. The first quadtree partitionmg 1s performed on the whole Image
PERl 'EPTllAI. QUALITY OF GEOMETRIC4LLY /)J,\'TROTEJJ IMA(1£S PART 1: THE HOMOllENITY-BASED PERCEPTUAL Ql !AJJTY MEASUREMENT (HPQM)
/won ,\i!f)•ownn
blocks in which the approximation error is stHI aboYe the predetermined threshold. The block stze of the quadtree structure is therefore dependent on the locality and accuracy ofthe approximation.
The proposed procedure is illustrated in Figure 2. The system has t\YO inputs. nameh the original (1) and the distorted (!') images. Furthermore. there are two parameters that control the system The parameters are the mHumum block s1ze Um.;:
and the maximum error threshold 0 The first parameter. Hmm. controls the precision of
the ャッ」。jゥエセ@ approximation of the globa.l geometric distortion. The choice of this
parameter ts a trade-off between the precisiOn and the reliability of the approxunat10n. as block sizes that are too small will make the approximation less reliable. The error threshold 0 controls the precision of the approximation and must be traded-off "ith computation time. In our experiments. "e use the Optical Flow Estimation algorithm to estimate the RST/affine parameters. as presented in [I Ll2]. The use of this a.lgoritlun offers significant speed and estimation precision adYantages when compared to a more straightforward option using exhaustiYe search 113]. We performed the OFE algorithm in four resolution leYels. namely 1/ 8 resolution. Y4 resolution. Y2 resolution and the original full resolution.
The procedure goes as follows. In the first iteration. we try to approximate the global underlying geometric distortion \\ith one global RST/affine transform and compute the approximation error c. This approximation error is then compared to fJ. If the minimum l: obtained in tllis process is larger than 0. we go to the second iteration
Techne .lurnal Ilmiah Elektrotcknika Vol. X No ., BGMセ@ ... セセ@ ..,, .. ,o Unt .;;u- 7r,
to be more seYere than the one applied to Figure 3( b). Here "e can see that the image
with the larger distortion is more finely partitioned than the one with less disto11ion .
... ;, '' 」NG|エZ[ゥャャエZ、ANZエセャ@
セ@ measurement ,..-: Image(!'') I
_J2'_ __ ,
セMMスMMサ@
cッャセセゥZセ@
J.セu。Mォセ@
-T-ウエイオ」エオイセ@ Final
Score
Figure 2. The procedure used fo measure distortion homogenei(l'
In order to obtain the final numerical score that "ill indicate the Yisual quality
of the distorted image. '"e need to be able to quantify this quadtree stmcture. There
are some possibilities to do so. including eYaluating the aYerage block size. the
Yariance of the block size or the Yariance of the parameter sets associated to each
block in the quad tree stmcture. In our experiments "e chose to include the block size
and the RST/affine parameter set P, of each quadtree blocks to quantify the quadtree
structure. The final score of an image is calculated using the folio" ing relation:
\"
s
='LP,
(7)
•=I
In Equation 7. Sis the final score of the image. jJ, is the score of each mdiYidual block
i of the quadtree structure and N is the total number of blocks in the quadtree structure. ヲjセ@ is calculated as follo,YS.
(8)
In Equation 8. parameter
e,
is based on the size of the block I. Smaller blockstze [image:10.495.66.455.91.542.2]PER( 'EPTFlL QE4LJTY OF GEOMETRIC411 Y DISTROTED IMAGES PART/: THE 1/0MOGENITY-HASE/J PERCEPTUAL (jl!A UTY Ml:.'ASUREMENT (HPQM)
bmn 51e f) ·ow on
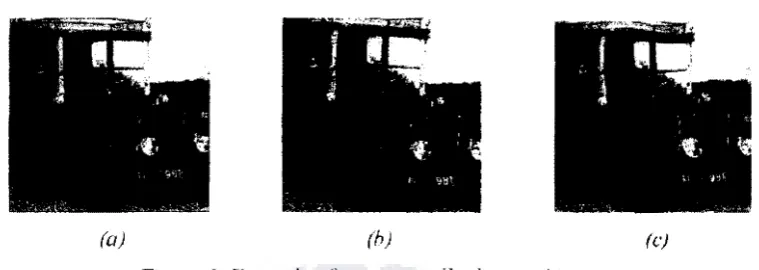
score. Thus the Yalue of this parameter is lmYer for smaller blocks. The parameter !J.1,,
is the difference bet" een the RST/affine parameter set of each block and the
RST/affine parameter set "·hen there is no RST/affine distortion1 The difference is
expressed as the 1-'2 norm distance bet\Yeen the 2 parameter sets. In the difference
calculation. the parameters for Rotation and Scaling are giYen larger "·eights
\..VtlljJi.UeJ lu iJJe palatllelt:l::> lui liJ.IlSli.lliUH, オ・セNZ。オウ・@ Ulll obse1 \ lli!Ull 111dH.:UleS that
Rotation anct Scaling parameters giYe a larger impact on the m erall perceptual アオ。ャゥエセ@
of the image The larger the difference. the lower the score for the block will be This
is because eyen "hen the RST/affine transformation of a block can be ー・イヲ・」エAセ@
estimated (i.e . zero residual error). such a block can still heaYily influence the m erall
perceptual quality of the image if the local RST/affine transformation is seYere. The
parameter {), and the 'Yeighting factors of the RST/affine parameters are determined
experimentally. Finally. the calculation of the final score is normalized so that the
ma:ximum score that can be achieYed by an image is 100.
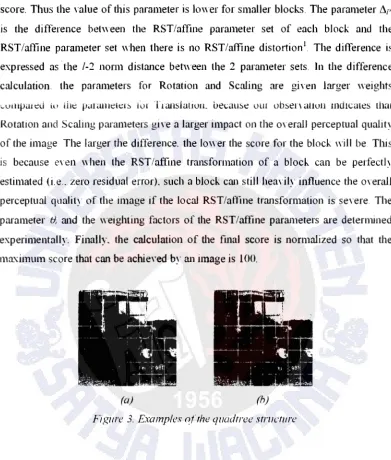
(a) (h)
Figure 3. E.-ramples n(the quadtree structure
As a fmal note. "e "ould like to point out that the quad tree structure examples
111 Figure 3 sho'Y hmY the image content influences the measurement procedure. as
already pointed out in Section 3.2. In this example "e can see that areas "ith a lot of
texture or structure are more accurately approximated and finely partitioned compared
to the flat areas or areas "ith less details although they undergo similar distortion. As
[image:11.494.56.447.63.523.2]Technc Jurnnl Ilmiah Elektroteknikn Vol. 8 No. 2 Oktober 2009 Hal :'i<J-76
4. Test setup and results
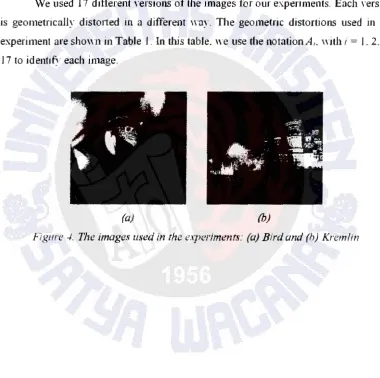
We used two images. Bird and Kremlin. as a basis to build the test set to
eYaluate the performance of the proposed HPQM method. These images. shO\m in
Figure 4. are 8-bit grayscale images with 512 , 512 pixels resolution. The images are
chosen primarily due to their content Wllile image content does not play a large role
in the 0bjecti1 e lest experiment. it plaYs a significant role in the user test experunent
that \Yilt be described in the next paper of this series.
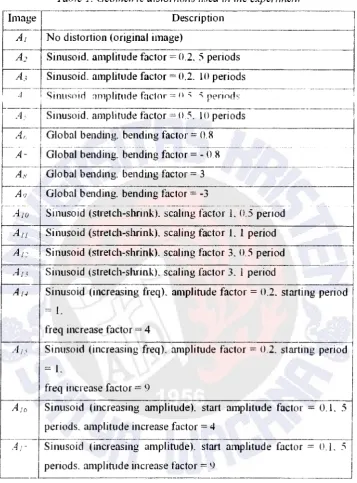
We used 17 different yersions of the images for our experiments. Each Yersion
is geometrically dist011ed in a different \my. The geometric distortions used in the
experiment are shom1 in Table 1. In this table. we use the notation A,. with i = I. 2 ..
17 to identify each image.
[image:12.497.69.449.190.568.2](a) (b)
Figure -/.. The images used in the e.1periments: (a) Bird and (h) Kremlin
PERCEPTI!AL QUALITY OF GEOMETRICHLY DISTROTEJ> IMAGES PART/: THE HOMOliEN/1'1'-BASEO PERCEPTUAL (JUAL/l'Y MEASUREMENT (HPQM) !wan !)etyawan Table 1. Geometric distortions used in the e:xpenmenf
ᄋMMMMᄋᄋᄋMMMMMセMᄋMᄋᄋMMMZMMMZMMMMMMMM
Description
---AJ No distortion (original image)
- MᄋMBセMMMM MᄋセMMᄋN@ ... Mセ@
-A1o Sinusoid (stretch-shnnk). scalmg factor l. 0.5 penod
1 Au Sinusoid (stretch-shrink). scaling factor L 1 period
Ar , Sinusoid (stretch-shrink). v_ ... ....
I
An Sinusoid (stretch-shrink). scaling factor 3. 1 period
Au Sinusoid (increasing fi·eq). amplitude factor = 0.2. starting period
=1.
freq increase factor 4
A1 , Sinusoid (increasing freq). amplitude factor= 02.
=L
freq increase factor= 9
Sinusoid (increasing amplitude). start amplitude factor = 0.1. 5
セᄋᄋᄋᄋᄋᄋᄋᄋᄋᄋᄋᄋᄋᄋᄋᄋᄋᄋMQMMー・⦅イセゥッセ、セウᄋL@
amplitude increase factor 4I
L
4 1 1 Sinusoid (increasing amplitude). start amplitude factor periods. amplitude increase factor 9 = 0. Lセi@
The distottions chosen for the test set range from distortions that are
perceptually not disturbing to distortions that <Ue easily Yisible. These distottions are
particularly usen1l to compnre the performance of the HPQM method to the other
objectiYe quality measurement methods (for example the PSNR measurement).
Furthermore. these dtstottions are also useful to eYaluate the correspondence between
[image:13.495.73.431.65.549.2]T echne Jurnnl Tim in h El ektroteknikn Vol 8 1\
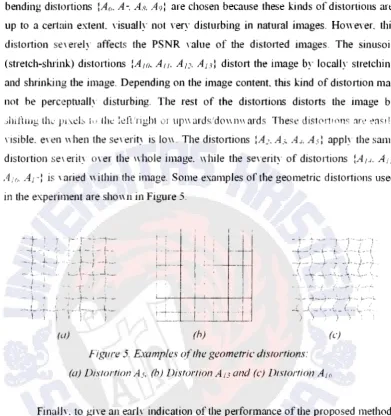
bending distortions lA(J. A-. As. Aol are chosen because these kinds of distortions are.
up to a cetiain extent Yisually not Yery disturbing in natural images. Ho,yeyer. this
distotiion se' erely affects the PSNR 'alue of the distotied images. The sinusoid
(stretch-shrink) distotiions :AJ(). An A1:>. A13l distort the image by locally stretching
and shrinking the image. Depending on the image content this kind of distotiJOn may
not be percept1wlly disturbing. The rest of the distortions distorts the image by
usible. eYen "hen the se\ ・イゥエセ@ is lo". The distortions :A:. A3, aセN@ A5l apply the same
distortion se\ ・イゥエセ@ mer the "hole image. "hile the seYerity of distotiions [AJ./. A1 _,
A,(,, A1 -: is Yaried "ithin the image. Some examples of the geometric distortions used
in the experiment are sho\\ n in Figure 5.
- t
セQMN@
\ I
,_
T
I(
-- セM
i ;
(u} (h)
Qセ@
II
IMセQ@
--r-
MセM Mセ@ -t--- --: ---セM -セM -:----セ@ --jl).
;
-)--i-
セ|@___;;;.,,---'. MMMセNMMMMセMMM
'-(c)
Figure 5. Examples o(lhe geometric distortions:
(a) Distortion A5, (h) Distortion A13 and (c) lJistortion A11,
Finally. to gtYe an early indication of the performance of the proposed method.
we also perftJrm PSNR measurements of the images and a preliminary subjectiYe test.
A more detailed companson of the performance between the proposed method and
other objectJ' e test methods "ill be described in the next paper. Ltke" ise. a more
[image:14.495.68.460.41.458.2]PERCI:PTU4L OU4UTY OF (;EOMETRICALLY DISTROTED IMAGES PART 1: THE HOMlJUENITY-BASED PERCEPTUAL QUALITY MEASUREMENT (HPQM)
]wan ,\'eryawnn
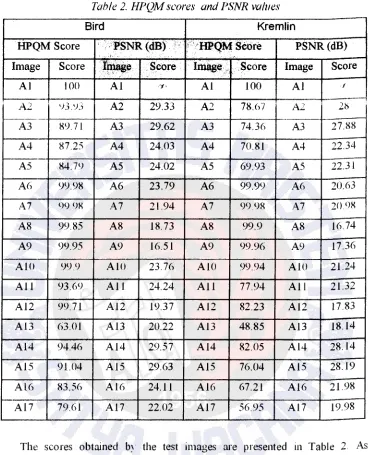
Table 2. HPQM scores and PSNR values
Bird Kremlin
HPQM Score · .• ·PSNR (dB) ·· •HPQMSeore PSNR(dB)
.r.
'"
Image Score jセ・@ .. Score I .. llUlge,, Score · . Image Score
AI 100 Al ..
..,.
Al 100 Al IA2 '
'J3.'J.) A2 29.33 A2 78.<)7 A2 21:'>
-A3 8lJ. 71 A3 29.62 A3 74.36 A3 27.88
A4 87.25 A4 24.03 A4 70.81 A4 22.34
AS 84.N A5 24.02 AS 69.93 AS 22.31 A6 99.98 A6 23.79 A6 99.99 A6 20.63
A7 99. <JX A7 21.94 A7 99 9R A7 20 98
A8 99.8S A8 18.73 A8 99.9 A8 16.74
A9 99.95 A9 16.51 A9 99.96 A9 17.36
AIO l)l) <) AIO 23.76 AIO 99.94 AlO 21.24
All 93.6l) All 24.24 All 77.94 All 21.32
Al2 99.71 Al2 19.37 Al2 82.23 Al2 17.83
Al3 63.01 Al3 20.22 Al3 48.85 Al3 18.14
Al4 94.46 Al4 29.57 Al4 82.05 Al4 28.14
AlS 91.04 AlS 29.63 Al5 76.04 AlS 28.19 Al6 83.56 Al6 24.11 Al6 67.21 Al6 21.98
Al7 79.61 Al7 22.02 Al7 56.95 Al7 19.98
The scores obtained by the test images are presented in Table 2 As a
comparison. we also present in this table the PSNR values of the distorted images.
Our preliminary subjective observation indicates that the scores obtained using the
HPQM method correspond better to the perceiYed quality of the images compared to
the PSNR Yalues (" ith the obYious exception of image At) For example. image As
(presented in Figure 6) of the Bird set has a Yery lmY PSNR yaJue but it receiYes a
high HPQM score. indicating high perceptual quality. When looking at the image. "e
obsen e that the distortion applied to tllis image IS indeed not 'ery disturbing and If
one does not 、ゥイ・」エAセ@ compare it to the original undistorted image. one mm· not eYen
[image:15.494.71.445.63.518.2]Techne Jurnal llmiah Elektroteknika Vol. R No. 2 Oktober 2009 Hal 59- 76
image). In other words, the perceived quality of the image is high. The same can be
said for most of the other images in the test set
Figure 6 Image A8fi'mn the Bird test s..:t
(HPQMscore: 99.85, PSNR value: 18.73 dB)
5. Conclusions
and future works
The conclusions we can draw based on the discussion in this paper are as
follows:
74
l. We haw proposed a definition of geometric dislortion homogeneity. based on
the locality of the approximation of the underlying global geometric
transformation using RST/affine transforms.
2. We hm-e proposed an hypothesis of ho\v to アオ。ョエゥセᄋ@ a geometric distortion. based on its homogeneity.
3. We haYe proposed and tested a method. called the Homogeneity-based
Perceptual Quality Measurement (HPQM), to measure the perceptual quality
of geometncally distotied images.
4. The preliminary ウオセェ・」エゥy・@ obseiTation indicates that the proposed HPQM inethod has a !ugh correspondence to human perception of the quality of the
test images. In this sense. the HPQM method clearly outperforms the PSNR
[image:16.497.73.464.91.591.2]PERCEPJ'l/AL Ql!AHTY OF (IEOME1'RICAI,LY IJJSJ'RlJTED IMA&'ES PART 1: THE Hl JMO(iENITY-BASEJ> PER( 'EP1VAL QVAUTY MEA.'iUREMENT (HPQM) !wan Setymran
design and analysis of a more elaborate user test experiment will be described
in the next paper of the series.
The proposed system is still a work in progress and currently there are still
some limitations that should be addressed. The improYements of these limitations are
the topics for our future works. In particular. \Ye think that the following topics should
l>t: 111\t:SlJgaied mute lhoroughh.
1. Refinement of the procedure used to determine distortion homogeneity. The
discriminating po"·er of the objectiYe test scores is fmrly small (see Table 2 ).
This could be due to the discriminating po"er of the equations "e use to
compute the final score being too small or due to the chosen Yalues of the
parameters used in the equation being not Yet optimal Further research should
be conducted to inYestigate and improYe the performance of the method in this
respect.
2. Take image content more into account since human perception of geometric
distortiOn is highly influenced by the presence of certain structures in the
image. In our experiments. this aspect has been indirectly taken into account
due to the fact that our distot1ion homogeneity measurement procedure is
influenced by image content. HoweYer. further UlYestigation should be
performed to find ways to explicitly imolYe the image content in the final
score calculation.
6. References
F.AP. Petitcolas. RJ. Anderson and M.G Kuhn. Attacks on copvright markmg
'>J'Stcm<- in Information Hiding: 2"d Int Workshop (lecture Notes in Computer
Science). Vol. 1525. pp. 218 238. Berlin. Springer-Verlag. 1998
U Cox. J Kilian. T. Leighton and T. Shamoon. ,\'ecure !1pread specrmm
watermarkingfhr images, aud1o and video. in Proceedings of lEEK ICIP 1996.
pp. 243 セM 246. Lausanne. 1996
3. J Haitsma and T. Kalker. A watermarkmg .'>·chemej(Ju/tgllal cmema.in
Tcchnc Jurnal llmiah Elcktrotcknika Vol X No. 2 Oktober 21109 Hal "i() - 7(,
4. J.J. K.
6
Ru:maidh and T. Pun. RotMion. scale and translation invurwnt d1gital image l-l'afermarking. in Proceedings ofiEEE. ICIP 1997. pp. 536- 539. Santa Barbara. CA. 1<>975. I. Sety<m an. G. Kakes and R. L. Lagendijk .. \)mchmnization-insensitive video watermarkmg 11sing stmctured noise paffern. in Proceedings of SPIE Security :md Watermarking of Multimedia Contents IV_ Vol. 467:'\_ pp :'120- 530. San Jose. LA . ...:u\1..:.
<->. P. Loo and N. K.mgsbury. Motwn-est11natwn-hased regwra11un セセセ@ geometncuiiJ
distortc(/ trnugctor l-1 otcrmurk recove1y m Proceedings of SPIE. s・」オイゥエセ@ and
Watermarking of Multimedia Contents Ill Vol. 4314. pp. ()O(, - 61 7 _ San Jose.
CA. 2001
7. D. Dela.nna). J-F Delaigle. B. Macq and M. Barlaud. ( 'ompensatwn of geomemcol detormatwnstor watermark extrocrwn 111 the dlglfal ctnemLJ
appl!cot!On. in Proceedings of SPIE. Security and Watermarking of Multimedia Contents III.Vol4314_ pp. 14l)- 157_ San Jose. CA. 2001
X. P.J.O. Doets. I. SetymYarl and R.L. Lagendijk._ Complexity satiable compensurwn q(geometrical distortions in image watermarking. in Proceedings ofiEEE. ICIP 2003. Vol. L pp. 513- 51 6_ Barcelona. 2003
9. F. Deguillaume. S. VoloshynoYskiy ar1d T. Pun. A methodji>r the estimation and recovering ti·om general c!ffine tronstimns 111 digitcll watermarking applications. in Proceedings ofSPIE. Security ar1d Watermarking ofMultimedia Contents IV. Vol 4() 7 :'. pp. 313 - 322. Sar1 Jose. CA. 2002
10. D. Delmmay. I. Setya" ar1. R.L. Lagendijk and B. Macq. Relevant modeling and
cO/JijJt:JI"!son olgeumetnc disTortions 111 wuturmorkmg system.1. in Proceedings of
SPIE. Application of Digital Image Processing XXV. Vol 47l)0_ pp 200-21 (J
Seattle. W A 2002
It Tekalp. AM .. Dtgital Video Processing. Prentice-Hall. Inc .. Upper Saddle RiYer. 1995
J 2. Tekalp. AM.. n,tferenrial Methods_ pru1 of the lecture notes for Digital Video
pイッ」セウウゥQQァN@ uョゥy・イウゥエセ@ of Rochester. Ne'' York. USA. 2001
13. I. Set) a\\ an. D. d・ャ。ョョ。セN@ B. Macq ar1d RL Lagendijk. Perceptual Quality
OセカッOiiwiPOQ@ of <icomemcuil) ャjエN|wイエセZ、@ Inwgc., usin,f!, R.c/nr;.mt gセNMᄋLュjlエイ[Gᆳ