IJG Vol. 46, No.2, December 2014 (177 - 186) © 2014 Faculty of Geography UGM and he Indonesian Geographers Association
Characterization of Jos City Road Network, Nigeria
Olumide Akinwumi Oluwole, Nwanret Gideon Daful
Received: 29 10 2014 / Accepted: 30 10 2014 / Published online: 31 12 2014 © 2014 Faculty of Geography UGM and he Indonesian Geographers Association
Abstract he performance of road network depends on its topological characteristics which help to deine its connectiv-ity. his paper analyses the topological characteristic of Jos city road network and its bearing on traic low situations. Simple graph theoretic measures ofered the framework on which the problem was approached. he study requires the abstraction and analysis of the topological structure by selection of certain variables relating to the road connectivity. hese include the Beta, Gamma and Alpha index, the PI, Cyclomatic number, and the spread and density of the network. Information on these variables was obtained through the use of vector data model to abstract the road network graph from the Quick-bird satellite imagery used for the study. Results of the indings reveal that, the road network of Jos City Centre as a whole have achieved an average level of connectivity, showing Beta index values of 1.4049, Gamma index value of 47.06%, Alpha index Value of 20.63%; and a pi and cyclomatic number of 24.74 and 165 respectively, the spread of the network is moderate exhibiting a value of 23, even though some areas have more concentration of roads than the others; and has a road density of 52 links per km2. Based on these indings, the need for construction of new roads is imperative so as to improve the eiciency of connectivity and accessibility within the city.
Abstrak Kinerja jaringan jalan tergantung pada karakteristik topologi yang yang membantu untuk menentukan konekti-vitas jalan tersebut. Tulisan ini menganalisis karakteristik topologi jaringan jalan Kota Jos-Nigeria dan pengaruhnya pada arus lalu lintas. Graik teoritik sederhana digunakan sebagai kerangka pendekatan masalah tersebut. Penelitian ini meng-gunakan abstraksi dan analisis struktur topologi dengan pemilihan variabel tertentu yang berkaitan dengan konektivitas jalan. Variabel tersebut terdiri dari Beta, Gamma dan Alpha indeks, PI, Bilangan Cyclomatic, serta penyebaran dan kepa-datan jaringan jalan. Informasi tentang variabel tersebut diperoleh melalui penggunaan model data vektor abstrak graik jaringan jalan dari citra satelit Quickbird yang digunakan untuk penelitian. Hasil temuan menunjukkan bahwa, jaringan jalan dari Pusat Kota Jos secara keseluruhan telah mencapai rerata tingkat konektivitas, menunjukkan nilai indeks Beta 1,4049, nilai indeks Gamma 47,06%, indeks nilai Alpha 20,63%; serta PI dan Bilangan Cyclomatic sejumlah 24.74 dan 165. Penyebaran jaringan moderat menunjukkan nilai 23, meskipun beberapa daerah memiliki konsentrasi lebih jalan dari yang lain; dan memiliki kepadatan jalan dari 52 hubungan per km2. Berdasarkan temuan ini, kebutuhan untuk pemban-gunan jalan baru sangat penting sehingga dapat meningkatkan eisiensi konektivitas dan aksesibilitas dalam kota. Keywords: Topological characteristic, connectivity, traic low, theoretic measures, vector data
Kata kunci: Karakteristik topologi, konektivitas, arus lalulintas, pengukuran teoritik, data vektor
he term topology refers to the study of those properties of geometric objects that remain invariant under certain transformations such as bending or stretching [Massey, 1967 in Chang, 2010]. Geometric relationships between spatial objects such as connectivity and adjacency that are not altered by distortion, as long as the surface is not torn [Lusch, 1999]. It refers to the way all the objects are related to each other in space, how are they arranged? Which one lead to the other? From topology a spatial pattern develops. hese patterns include connectivity and adjacency. Rodrigue and Ducruet [2013] “he arrangement and connectivity of a network is known as its topology, with each transport network having a Olumide Akinwumi Oluwole and D. Nwanret Gideon
Department of Geography, Nigerian Defence Academy. email: [email protected]
speciic topology”. he most fundamental elements of such a structure are the network geometry and the level of connectivity. Transport networks can be classiied in speciic categories depending on a set of topological attributes that describe them. It is thus possible to establish a basic typology of transport networks that relates to its geographical setting as well as its modal and structural characteristics.
CHARACTERIZATION OF JOS CITY Olumide Akinwumi Oluwole and Nwanret Gideon Daful structure designed to tie together various points, which
are located in space. Consequently, the capacity and the characteristic of a network is an important factor in regional and national development. A well developed road network is a strong mediating factor in the accessibility of life enhancing factor facilities such as health care, education, market and inance houses to the people. Hence the corollary is that where transportation rudimentary is poorly developed the people will sufer from mobility deprivation, such as market for every good produced, because the area will be remote and inaccessible [Hamilton, 1997]. Roads are strip of land that provides routes for travel by automobiles and other wheeled vehicles.
Transportation if well planned contributes greatly to the economic development of a place, the standard of living, the level of economic growth as well as the standard of productivity of the people. hese are no doubt determined by the eiciency of movement in the given area. his movement is facilitated by the availability of a good transport network [Hoyle, 1973]. Interactions among and between people is promoted by the facilities involved in the movement of people, materials, goods and services. For interaction to really take place between cities there must be accessibility which has become a major area of concern for transportation geographer [Rodrigue, 2013].
he road network in Jos City appears to be well planned and connected, but in driving through the city centre one oten inds hitches that obstruct traic on a road, this perhaps hampered accessibility and hindered the full utilization of the road network. hus, in planning for the development of socio-economic activities in Jos City of Plateau State, knowledge of the nature of connectivity of roads could enhance our understanding of this aspect.
his study analyzes the topological characteristic of Jos city road network and its bearing on traic low situation.
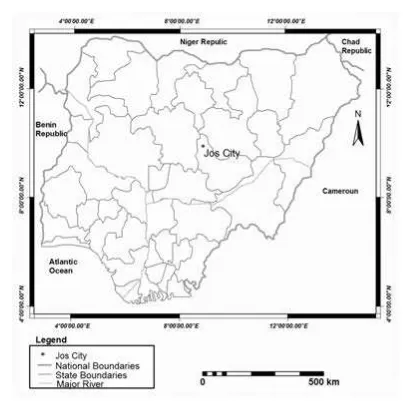
Jos City (Figure 1) is the capital of Plateau State. It is located almost in the geographical center of Nigeria; it is about 1,000 Km north east of Lagos, 400 Km south of Kano, 900 Km north of Port-Harcourt, 600 km south west of Maiduguri, 1000 km south-east of Sokoto and 300 km away from Abuja. he state occupies an approximate total land area of about 39,934 square kilometer. he coordinates of the study area, “Jos Central” are given between latitude 9° 53”N and latitude 9° 56”N of the equatorial plane and longitude 8° 54”E and longitude 8° 52”E of the Greenwich Meridian, and have an elevation which rise between 1,276 M and 1,160 M above mean sea level. It is located at the northern point of the plateau, which bears its name at an elevation of about 1,200 M above mean sea level. As a town it is the most asymmetrically placed state capital in the whole of Nigeria, located at the extreme northern end of the State. Except on its northern part, the town is almost surrounded by hills. To the east are Dogon Dutse
and Shere Hills which rise to over 1,400 M and 1,777 M respectively, on the west side are the Jentar Hills which also rise to over 1,280M above mean sea level. To the south are many other small and large inselbergs and rock out crops. In the north the topography is worsened by many unreclaimed old mining paddocks [Morgan, 1979].
he city of Jos is synonymous with mining and commerce; it is mainly a colonial creation and one of the earliest and busiest cosmopolitan centers in Nigeria. Most inhabitants of this bustling city are immigrants attracted by the numerous commercial prospects available there in. Jos is indeed an attractive place to live in, because of the unique physical features, favourable climate, variety and scenic beauty and pleasurable social atmosphere. he geology of the area comprises Precambrian basement complex rocks (migmatites, gnesis and older granite), the Jurassic younger granite (mostly biotite-granites) and the Tertiary as well as Quaternary volcanic rocks (mainly basalt, pumice, and lava low and ash deposit) [Macleod et al, 1971]. he geomorphology is closely related to the underlying rock types. he area has been broadly divided into three broad physiographic units including hills and mountains, dissected terrain and undulating landscapes [Hill and Rackham, 1974].
he population of Jos City has increased immensely over the years. Jos town was not founded until the twentieth century, but its growth was preceded by two settlements in the vicinity, at Naraguta and Gwash [Bingel 1978]. he town started its growth as early as 1800 but gained ascendance only “between” 1900 – 1914. When in 1900, the Royal Niger Company started a trade in Tin with the indigenous and Hausa traders on the Jos Plateau, the tin mining industry led to inlux of migrants mostly from within and outside the country, the industry and trading in the city ensue; greatly inluence the population, economic and spatial growth of the town then. As the mining activities decline, the inhabitants quickly embrace agriculture and trading, but the subsequent choice of Jos as a regional capital and then state capital attracted a lot of people [Obiefuna and Agbo 1999], creating diverse form of population problems.
Jos city being the administrative capital, and the commercial nerve centre of plateau state, is the most densely populated area in the state. According to the 2006 Nigerian census result, the city has a population of 836,910 people, and with a present projected population of about 1.1 million people. he city normally witness great inlux of people from within and outside the state, for various socio economic activities, such as education, health services, and tourism and administrative purposes. Jos city will continue to attract and absorb more people and diverse forms of human activities from the already overloaded city centre.
can be regarded as the mathematics of relation. Kansky [1963] looked at graph theory as a branch of mathematics known as combinatorial topology, which deals with abstract coniguration consisting of points (nodes or vertices) and routes (lines, arcs or edges). here are two types of graph; the planar and non planer graphs.
A graph is termed planner “if all the links connecting the nodes can be mapped in to plane, such that the links have no points in common other than the nodes” [Steenbrink, 1974]. A non planer graph refers to that in which all point of intersection may not necessarily be nodes. For instance, a normal crossroad where two roads intersects is planar where as motor way junction where one passes over the other traic from one moves to another by means of iltering system (ly over routes) is term non planer.
Geographers are generally interested in the analysis of overall transport networks especially since there is a strong relationship between transport system and
economic development. Transport network difers in terms of concentration, extent and eiciency and those variations result from various physical, cultural, technological and economic functions. According to Chapman [1979] a network may either be static feature at a point in time or dynamic phenomenon which is subject to changes through time. hus a network grows over time. To assess the eiciency of any network system Kansky [1963] came up with some basic measures and indices that can be used to either expressing the relationship between the values and the network structures they present or comparing diferent transportation network at a diferent point in time. hese measures are the Beta (β), Gamma (γ), Alpha (α), Pi (л), Cyclomatic, Spread of the network and network Density indices.
2. he Methods
In this study the vector data model was used, the vector data model was used because of its advantages, Source : National Centre for Remote Sensing Jos, Nigeria
CHARACTERIZATION OF JOS CITY Olumide Akinwumi Oluwole and Nwanret Gideon Daful
Source: Analysis result [2013]
Source: Analysis result [2013]
CHARACTERIZATION OF JOS CITY Olumide Akinwumi Oluwole and Nwanret Gideon Daful
Source: Analysis result [2013]
Table 1. Show the Numbers of Edges (E), Vertices (V), and Sub-graphs (x) Found in Each Graph
S/N Graph Edges (E) Vertices (V) Sub-graph no (x)
1.
2.
3.
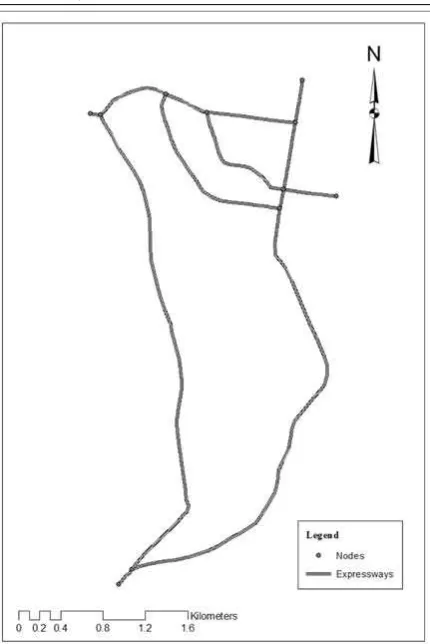
Figure 4.1, Showing expressway network only
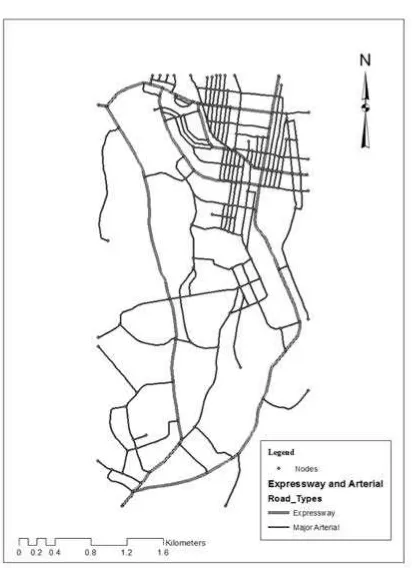
Figure 4.2, Showing expressway with major arterial network
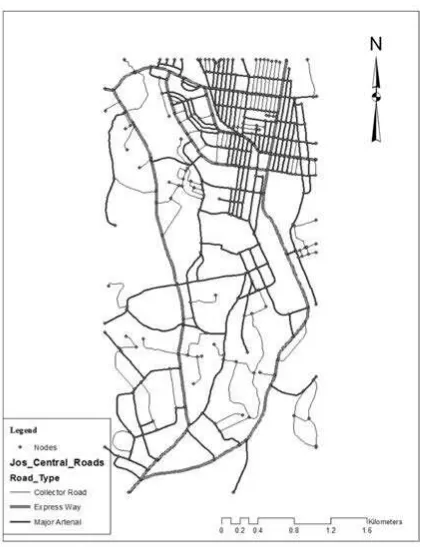
Figure 4.3, Showing expressway, ma-jor arterial and the collector network
13
328
569
11
221
405
1
1
1
Source: Analysis result [2013]
Table 2. Jos City Expressway Road Network Connectivity Measures
Indices Beta (β) Gamma (γ) Alpha (α) PI (π) Cyclomatic
Number Formula
Calculation
Result Percentage
1.1818 0.48148
48.148%
0.1764 17.64%
6.5 3
Source; Authors’ Analysis (2013)
Table 3. Jos City Expressway and Major Arterial Road Network Connectivity Measures
Indices Beta (β) Gamma (γ) Alpha (α) PI (π) Cyclomatic
Number Formula
Calculation
Result Percentage
1.4842 0.4992
49.92%
0.2471 24.71%
18.22 108
Source: Analysis result [2013]
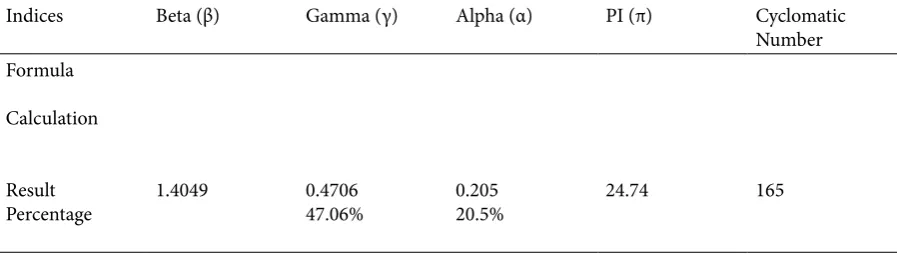
Table 4. Jos City Expressway, Major Arterial and Collectors Road Network Connectivity Measures
Indices Beta (β) Gamma (γ) Alpha (α) PI (π) Cyclomatic
Number Formula
Calculation
Result Percentage
1.4049 0.4706
47.06%
0.205 20.5%
24.74 165
CHARACTERIZATION OF JOS CITY Olumide Akinwumi Oluwole and Nwanret Gideon Daful which tries as much as possible to represent features
the way they are in reality. hus in vector modeling, the spatial characteristic of objects such as position (location), size (area), perimeter, shape and spatial relationship like distance, proximity, contiguity, etc are largely maintained.
he following operations were carried out in this research;
A Geo-reference Quick-bird satellite image of the study area captured in 2013 was acquired.
he Quick-bird image was imported in to the Arc GIS sotware, in which the desired portion of the image was subset using the clip (extract) operation function of the sotware.
Since the image has already been geo-referenced, polyline and polygon shape iles were created for the digitization of the roads (streets) as polyline for the topology analysis and measurement of street length. In the digitization all routes were digitized as an arc and the road junctions and terminal point as nodes. And the digitization was done in such a way that a particular street was digitized from the beginning to the end without stopping before starting another street (each street have its own unique identity number), this is to have an easy and eicient way of measuring the length of the roads. And digitized the land area of the road network as polygon, this is to aid in the calculation of the land area covered by the road network, for the road density calculation.
Field survey was then carried out in December 2013 to update the routes and nodes digitized from the image and to identify the various road types in the network.
he Attribute table of the polygon shape ile was opened, and a ield was added and named as Area in square kilometer, in which the column was then highlighted and right clicked and the calculate geometry option was used to calculate the land area covered by the network. And the same operation was also carried out for the polyline shape ile for the calculation of the length of each street in the network. his was used for the calculation of the road network density.
Geo-database of the road types was then built for the polylines shape ile, this enable the research to query and calculate the number of routes and nodes of the various road types.
he number of arcs, nodes and sub graphs of each road type, and the land area were fed into a Customized Sotware design and used for the topology analysis using Visual Basic Studio 2010.
he graph theoretic approach was employed to analyze the topological structure of the road network of Jos city. he graph theory provides an analytical tool for road networks. It is the mathematics of relations which provides a basis for the analysis of road networks through theoretic measure involving the abstraction of network into graphs. hese measures are Beta (β), Gamma (γ), Alpha (α), Pi (л), Cyclomatic, and network Density indices.
3. Result and Discussion
he major task of graphical analysis in road network investigation is to determine the degree of connectivity of the abstracted graph. his was also to determine the number of nodes/vertices and edges/links in the abstracted graphs. he abstracted graph of the network of Jos City is shown in Figure 2, 3 and 4.
From the abstracted graphs of the road network, numbers of edges and vertices in each of the graphs were identiied as presented in table 1. he degree of connectivity of the network was measured using the beta, gamma, alpha indices, pi and cyclomatic indices. hese indices where calculated from the graph using the customized sotware design, the results are as shown in tables 2, 3 and 4.
he density is usually expressed as the number of links per unit area of the total network length divided by the area it covers.
he topological characteristics of the road network of Jos Central have been assessed by some connectivity measures such as the Beta, Gamma, Alpha cyclomatic number and the pi index’s, its spread and density.
Beta index, value of 1.1818, 1.4842 and 1.4049 were obtained from the graphs of the network for the Expressway as shown on Figure 2, Expressway with major arterial as shown on Figure 3 and Figure 4 expressway with major arterial and collectors respectively, as shown on Table 2, 3 and 4. his imply that the graph of the expressway has a low level of connectivity, the graph of the expressway with major arterial has an average level of connectivity which is signiicantly higher than that of the expressway graph and the graph for the expressway with major arterial and collectors has a low level of connectivity although higher than that of the expressway but a little lower than that of the expressway with major arterial, this is due to the increase in the numbers of dead-ends (cul-de-sacs) in the collectors routes. Hence the inluence of adding major arterial to the expressway as shown on Figure 3 can be said to D = ∑L/A
Where D = Density
L = Total network length = Number of links in the network
A = Area covered by the network = 11.1263 Sq Km (i) he density from igure 4.1 for the expressway network only
D = ∑L = 13
A 11.1263 Sq Km = 1.2 links per Sq KM
(ii) he density from igure 4.2 for the expressway with major arterial network
D = ∑L = 328
A 11.1263 Sq Km = 29.5 links per Sq KM
(iii) he density from igure 4.3 for the expressway with major arterial and collectors network
D = ∑L = 569
be positive though choice of alternative routes did not signiicantly increase, while the inclusion of collectors to the graph of the expressway with major arterial as shown on Figure 4 increase the level of connectivity, but the increase in dead-ends (cul-de-sacs) of the collectors route makes it to be having a lower value of connectivity than that of the expressway with major arterial routes on Figure 3. Since the range of value for Beta index ranges from 0 to 3, the values of the beta index obtained shows that the network has a simple road connectivity, which is a low and implies that the number of routes on the network of Jos City is not suicient for the free low of goods and services. he beta index gives the picture of the route connectivity as a whole.
he gamma index gives us information about the ratio of the number of arcs or edges in a network to the maximum number of arcs possible in that network, which may exist between a speciied number of vertices or to the maximum possible in that network. A gamma index value of 0.4815 when converted to percentage (48.15%) was obtained for the expressway network in Figure 2, 0.4992 when converted to percentage (49.92%) for the graph of the expressway with major arterial on Figure 3 and 0.4706 when converted to percentage (47.06%) for the expressway with major arterial network graph on Figure 3. hose showed that the expressway network graph on Figure 2 has 48.15% connectivity which is fair, but not suiciently enough for an adequate circulation within Jos city centre, the expressway with major arterial network graph in Figure 3 has 49.92% connectivity which is a little improvement to that of Figure 2 but can still not be assumed to be having a single circuit but only fairly good, though still not suicient for the city centre circulation of goods and services, and the expressway with major arterial and collectors network graph in Figure 4 has 47.06% connectivity which is also fair but a decrease to that of the other two graphs, this is said to be as a result of the increase in the number of dead-ends in the collectors routes. Under the gamma index, the network can be said to have a minimal connectivity which is fair but not adequate for an excellent low of traic on the road network.
he alpha index is one of the most useful and perhaps the best measures of the connectivity of a network, especially a fairly complex network. his index expresses the ratio of the number of fundamental circuits (e – v + 1) to the maximum possible number of circuits in a network 2(V – 5), which may exist in a network. he alpha index expresses information on the percentage redundancy of the road network. It has a range of value from 0% for a minimally connected network to 100% for a maximally connected network. An alpha index value of 0.1764, 0.2471 and 0.205 was obtained for the network on Figure 2, 3 and 4 respectively. his shows that the network has a branching or minimal tree. When converted to percentage, values of 17.64%, 24.71% and 20.5% were
obtained which shows that the networks has achieved 17.64% circulatory connectivity for the network in Figure 2, 24.71% circulatory connectivity for the network in Figure 3 and 20.5% circulatory connectivity for the network in Figure 4. Figure 2 maximum possible numbers of circuits is 17 but have only 3 fundamental circuits, Figure 3 maximum possible numbers of circuits is 437 but has only 108 fundamental circuits and Figure 4 maximum possible number of circuits is 805 but has only 165 fundamental circuits.
he pi index indicates the extent of real development. he index has lower value of 1 with no ixed upper limit. his is dependent on the complicated nature of transport network in the area. Greater value of transportation network development is delected by higher value. he pi index is expressed as the ratio of the total network distance (L) to the diameter (d) which is the shortest distance between two farthest points in the network. A pi index value of 6.5, 18.22 and 24.74 were obtained for the study. he graphs reveal that the extent of development of the road network is fair, but not adequate for an excellent low of traic on the city road network, hence, the needs to improve upon the development of the network.
he cyclomatic index measures the number of complete fundamental circuit in a network (e – v + 1). he index is based on the principle that if a network has enough number of links to form a tree, then the addition of any tree will lead to circuit formation. he study reveals a cyclomatic index value of 3 for the graph on Figure 2; it reveals 108 for the graph in Figure 3 and 165 for the network in Figure 4.
4. Conclusion
CHARACTERIZATION OF JOS CITY Olumide Akinwumi Oluwole and Nwanret Gideon Daful
Bingel, A.D. (1978), Jos Origin and Growth of the Town
1900 – 1972, Occasional Publication Department
of Geography and Planning University of Jos. Campbell, J. (2001), Map Use and Analysis, Forth
edi-tion, McGraw hills publishers, United State of
America.
Chang, K.T. (2010), Introduction to Geographic
Infor-mation System, McGraw-Hill Publishers, United
States.
Chapman, K. (1979), People, pattern and Process: An
In-troduction to Human Geography.
Hamilton, D. (1997), Analysis of Road Network Acces-sibility, M.Sc hesis, Department of Computer Sci-ence, University of Montana.
Hill, I.D., & Rackham, I.J. (1974), Interim report on the landforms, soils and vegetation of the Jos Plateau 1: landforms and soils. LRD, Tolworth Tower, Surrey, England.
Hoyle, B.S. (1973), Transportation and Development, Macmillan Publishers, London.
Kanksy, K.J. (1963), Structure of Transport Networks: Relationships between Network Geometry and Regional Characteristics, Research papers No. 84, Department of Geography, University of Chicago. Lusch, D.P. (1999), Fundamentals of Geographic Infor-mation System, Emphasizing GIS Use for Natural
Resource Management, Center For Remote Sensing
& GIS, Michigan State University
Macleod, W.N., Turner, D.C., and Wright, E.P. (1971),
he geology of the Jos Plateau, Geological Survey
Bulletin 32, Geological Survey of Nigeria, Lagos. Massey, W.S. (1967), Algebraic Topology: An
Introduc-tion, Harcourt, Brace and world, New York. Morgan, W.T.W. (1979), he Jos Plateau; a Survey of
Environment and land use, Occasional Publication
(New series) No 14, Department of Geography,
University of Durham, Durham, England.
Obiefuna, G.U., & Agbo, O. (1999), Spontaneous Settle-ments in Urban Areas and their Challenges to Ur-ban Planning; A case study of Gangare Ward, Jos,
Journal of Environmental Sciences University of Jos 3 (2):193 – 204.
Rodrigue, J.P. (2013), he Geography of Transport Sys-tem, third edition, dept of global studies and geog-raphy, Hofstra university, New York.
Rodrigue, J.P. & Ducruet, D. (2013), he Geography of Transport System, third edition, Hofstra university, New York.
Steenbrink, P.A. (1974), Optimization of Transport Net-work, John wiley and sons Ltd, London.