ISBN 978-979-8389-19-1 Proceeding of 2013 International Seminar on Climate Change and Food Security (ISCCFS 2013)
Abstract.
Alternative specifications of model of supply response of Jambi rice crop and their economic implications are considered in terms of the existences and nature of production lags, and the choice between expected price and gross returns as the preferred explanatory of producer‘s response to changing economic condition. The analysis indicates that there are lags which are due primarily to the difficulties and cost of rapid adjustment rather than to the time required to revise expectations. The statistical results were similar for the alternative specification of gross margins and prices as the economic decision available. However, the price elasticity derived using the gross margins specification were about a third of those using the prices specification. The gross margin specification yielded additional information in the form of yield and input cost elasticity.Keywords:
Dynamic Supply response, Production response, Rice, Jambi Province1. Background
Agriculture is the largest sector in the Indonesian economy in terms of contribution to GDP, foreign exchange earning and employment creation. The sector had been neglected until 1986‘s because growth was thought to be synonymous with industrialization. This view was justified by the belief that industry is the dynamic sector, while agriculture is static and unresponsive to incentives. This belief led to the taxing of agriculture by turning domestic terms of trade against agriculture. The consideration that agriculture is unresponsive implied that resources generated in agriculture could be transferred to other sectors of the economy without significantly affecting agricultural growth (Pearson et al, 1991).
In the context of modernizing traditional agriculture Moseand Kuvyenhoven (2007) argued that lack of knowledge with respect to the contribution of agriculture to growth has bred many a doctrine and political dogmas. One of such doctrines was that farmers are not responsive to economic incentives. An important dimension of the question in this context was could agricultural production in low income communities be substantially increased by an efficient allocation of the factors of production at their disposal? How much additional agricultural production can be achieved by improving allocative efficiency of farming? (Guyomard et al, 1996)
The role of incentives which has become to be taken for granted for the success of any agricultural development program today was not always like so. A number of empirical studies in the 1960s (Behrman 1989, and Yotopoulos1972, Choi, and Helmerger 1993, Mose and Kuvyenhoven, 2007, Keeney, and Hertel. 2008) addressed the question of farmers‘ response to economic incentives and efficient allocation of resources through the analysis of both time series and cross sectional data from a number of developing countries.
Agriculture sector in Jambi Province during the last three decades or so has witnessed a number of developments both in the factor and product markets and experienced many policy shifts resulting in substantial changes in the structure of market incentives faced by farmers. However, quite a few of these changes have been crop specific/crop oriented, as there have been wide variations in quantum of changes in the incentives (Edison, 2011).
The performance of rice crop has important bearing not only for the growth and development of agriculture but also the capacity utilization and growth of the industrial sector which depends for the supply of its raw material on agriculture. From the foregoing it is apparent that there are many forward linkages of rice crop with the industry and other sectors of the economy, which generate employment and value addition in the economy (Yu et al. 2010).
+
Corresponding author. Tel.:
ISBN 978-979-8389-19-1
Proceeding of 2013 International Seminar on Climate Change and Food Security (ISCCFS 2013) Palembang, South Sumatra-Indonesia, 24-25 October,2013
The objective of this study was to increase our understanding of the specification and estimation of agricultural supply response as well as to provide instruments for agricultural policy analysis. The structure of the paper is as follows: Section 2 discusses theoretical model and dynamic supply analysis, Section 3 discusses methodology, Section 4 discusses results and discussion, Section 5 conclusions.
2.
Theoretical model and dynamic supply analysis
.
An agriculture supply function describes how the quantity of the product offered for sale varies as its price varies to relative to other product prices (Cochrane, 1995). Cochrane distinguishes between supply response functions. The supply function describes the quantity which would be supplied at different prices with all other things constant, while the supply response relationship describes what will happen to the quantity supplied when all other things are not held constant (Askari and Cummings, 1977). Nerlove (1958) provided much of the theoretical frame work in the supply response studies.
Let the supply equation be
Qt = ao +a1Pt+ a2Zt ……….……….... (1)
Qt = Actual quantity produced Pt = Actual price of rice produced. Zt = Supply Shifters
Qt = ao+ a1 P*t + a2 Z*t……… (2)
Where Qt = Quantity produced in time t P* = Expected price
Z*t = Supply shifters expected
The expected price is not observable and is explained as expected „normal‟ price, i.e., the level about which the future price is expected to fluctuate. This can be expected as: Actual P-Pt-1
P* - P* t-1= β (P t-1-P*t-1), 0 ≤β≤ 1………... (3)
We assume the expected price is actual price. P = P*
We can get the following equation by getting the value of P* from equation (2) and substituting in into equation (1) and rearranging it,
Qt = bo + b1 Pt–1 + b2 Qt-1 + b3 Zt–1 + b4 Zt-1……. ………..…... (4)
The equation (3) can be estimated economically.
To estimate elasticities the formula used was ∂Q/P. P/Q the first term for short and long run will be: Short run ∂Qt/Pt-1 and Long run: b1/1-b2
3.
Methodology
This section discusses the nature, sources, and limitations of the data and specification issues. The empirical analysis of this study will be conducted with a sample of annual data that cover Jambi‘srice crop for the time period 1986 to 2012. In addition to the economic factors as manifested by the prices of a given commodity/crop a number of other factors like the availability of water and other inputs, development of infrastructure, institutional support, economics of competing crops, etc impact on farmers allocation of resources to a given crop.
In the estimated models crop area has been used as a dependent variable. The crop area has been preferred over the production as farm production is also influenced by weather conditions, which are
ISBN 978-979-8389-19-1
Proceeding of 2013 International Seminar on Climate Change and Food Security (ISCCFS 2013) Palembang, South Sumatra-Indonesia, 24-25 October,2013
beyond the control of farmers. Yield is subject to more random variation than acreage due to factors outside the farmers‘ control such as the weather. Based on our extensive review of literature, discussions with experts and knowledgeable farmers we have identified the following factors impacting on farmer‘s allocation of crop area. Acreage = f (real price of output at time t-1, yield of output at time t-1, area planted to output at time t-1 Prices of a commodity received by the farmers in the recent past in lieu of the expected price at harvest time which is not known at the planting time, yield of the given crop obtained in last year as it inter alia shapes economic incentives for the commodity, yield of competing crops as a proxy for the opportunity cost and farmers‘ know how and experience about the cultivation of the crop.
3.1
Mathematical form of the ModelThe following models were chosen among the various mathematical forms on the basis of economic, statistical and econometric criteria as dynamic supply response (Colin and Townsend, 2011).
A. Production Response
QRt = f (PRt-1, QRt-1, ,Dt, et ) ……….………... (5) B. Acreage Response
ARt = f (PRt-1, ARt-1, Dt, et) ………..……..……... (6)
Where:
QRt is the total rice production (ton) in year t. AR t is the total acreage under rice (ha) in year t
PRt-1 is the wholesale price of Rice (Rp/kg) in year Lagged t-1
QRt-1 is the total rice production (ton) in year lagged t-1
ARt-1 is the total acreage under Rice (ha.) in year Laggedt-1
Dt is the dummy variable for new order era1986 - 1997 = 0 and for 1998 – 2011 = 1 et is the random disturbance term.
4. Results and discussion
The time series for the present study was from 1986 to 2012 and secondary data will be collected for the analyses (Source Economic Survey of Jambi Various). The results were obtained by using SPSS and presented in Table 1, and 2.
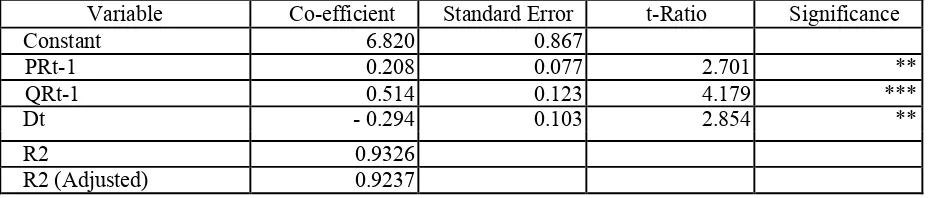
(A) Production Response
Ln QRt = Ln 6,82 + 0.208 Ln PR t-1+ 0,514 LnQR t-1 – 0.294 Ln Dt
Table 1. Structural co-efficient, their significance and value of R2 for rice production response in Jambi (1986-2012)
Variable Co-efficient Standard Error t-Ratio Significance
Constant 6.820 0.867
PRt-1 0.208 0.077 2.701 **
QRt-1 0.514 0.123 4.179 ***
Dt - 0.294 0.103 2.854 **
R2 0.9326
R2 (Adjusted) 0.9237
***= Significant at 1 percent level of Significance.
ISBN 978-979-8389-19-1 **
Proceeding of 2013 International Seminar on Climate Change and Food Security (ISCCFS 2013) Palembang, South Sumatra-Indonesia, 24-25 October,2013
The examination of the co-efficient of determination for production response equation indicated that 92% variation in the production of rice in Jambi was explained by the explanatory variable included in the model. The Coefficient of lagged price of rice had a positive sign with a value of 0.208. The coefficient is significant at 5% confidence level which indicated that with one unit increase in the price of the rice in the last year, the production increased by 0.208 units. The sign and magnitude of co-efficient was according to expectations. The co-efficient of this variable had a positive sign with a value of 0.514 and was significant at 0.1 confidence level, which showed that lagged production of rice had a significant influence on the production of the rice. The size and sign of co-efficient was according to the expectations based on theory. The dummy variable represented the new order era before in 1998. The co-efficient was negative, as was expected with a value of 0.294 and a significant at 5 percent confidence level. The negative influence of new order era on production might be due to non-availability of inputs at crucial stages in the production.
(B) Acreage Response
Ln ARt = Ln 9.203 + 0.0897 Ln PR t-1 + 0.126 Ln AR t-1 – 0.102 LnD t
Table 2. Structural co-efficient, their significance and value of R2 for acreage response in Jambi
Variable Co-efficient Standard Error t-Ratio Significance
Constant 9.203 1.043
PRt-1 0.0897 0.0389 2.306 **
ARt-1 0.126 0.128 0.984
Dt - 0.102 0.0473 2.156 **
R2 0.9604
R2 (Adjusted) 0.9564
***= Significant at 1 percent level of Significance. ** = Significant at 5 percent level of Significance
The examination of the co-efficient of determination was 0.9564, which indicated that 96% percent variation in the acreage under rice in Jambi was being explained by the independent variable included in the model. The Coefficient of lagged price of rice had a positive sign with a value of 0.0897. The coefficient is significant at 5% confidence level which indicated that lagged price of rice had significant influence on acreage under rice. The lagged acreage under Rice had a positive sign, according to expectations, with a value of 0.126 and was non-significant. This indicated that scope of horizontal expansion in Jambi was limited. The dummy variable represented the new order era in 1998, the co-efficient was negative, as was expected with a value of 0.102 and a significant at 5 percent confidence level. This indicated that war had a negative impact on the acreage under rice, which might be due to destruction of irrigation and other infrastructure and non-availability of inputs and other services.
(C) Elasticity
The estimated short-run and long run elasticity for production and acreage response under rice are summarized in Table.3.
Table 3. Own Price Elasticity for Production and Acreage under Rice in Jambi
Production Response Acreage Response
Short Run 0.104 0.084
Long Run 0.428 0.103
ISBN 978-979-8389-19-1 **
Proceeding of 2013 International Seminar on Climate Change and Food Security (ISCCFS 2013)
Palembang, South Sumatra-Indonesia, 24-25 October,2013
The own price elasticity for production shows that with the increase in the price of Rice by 1 percent during the period of analysis, the quantity of rice production increased by 0.104 percent in the short run and 0.43 percent in the long run. In case of acreage response, with the increase in the price of rice by 1 percent during the period of analysis, the acreage under rice increased by 0.084 percent in the short run and 0.103 percent in the long run.
5.
Conclusions
The ―bestǁ model was a long linear form, many variables were not including in the model due to non-availability of data, and important variables are included. The results of the analysis indicate that rice crops response to changes in the prices of rice in the case of production and acreage under rice response. The dummy variable for the new order era period had a negative impact both on production and acreage under rice in the years 1986-2012. The co-efficient of lagged acreage was non significant, which indicated that horizontal expansion in area is limited in Jambi, any increase in production will come through vertical expansion in future. This is a policy implication for government policy makers and researchers. With regards to elasticity. The own price elasticity of rice is 0.104 and 0.428 for short-run and long run production response and were acceptable on economic and statistical criteria.
6.
References
[1] Askari H. and Cummings J.T. 1977.Estimating Agricultural Supply Response with the Nerlove Model. .International Economic Review. 18(2): 257-92.
[2] Behrman J. R. 1989. Supply Response in Underdeveloped Agriculture. Amsterdam. North Holland.
[3] Choi, J.S. and Helmerger P.G. 1993. How Sensitive are Crop Yield to Price Changes and Farm Programs Journal Agr. and Applied Economics. 25:237-244.
[4] Cocharne, W.W. 1995. Conceptualizing the supply relation in Agriculture .Journal of Economics, 37(5) 1161-75. [5] Colin, T and Townsend R. 2011.Dynamic Supply Response Estimation. Annual Conference of AARES. Melbourne Australia.
[6] Edison, 2011.The Responsiveness of Jambi Rice Acreage to Price and Production Costs. Proceeding International Seminar CRISU-CUPT 2011 in Unsri, Palembang.
[7] Guyomard, H.; Baudry, M. and Carpenter, A. 1996. Estimating Crop Supply Response in the Presence of Farm Programmes: Application to the CAP. European Review of Agricultural Economics 23:401-420.
[8] Keeney, R. dan T.W. Hertel. 2008. Yield response to prices: implications for policy modeling. Working Paper Dept. of Agricultural Economics Purdue University. Pp. 1-36.
[9] Mose, L.B.K and Kuvyenhoven, A 2007, 'Aggregate Supply Response to Price Incentives: The Case of Smallholder Maize Production in Kenya', African Crop Science Conference Proceedings, vol 8, no. -, pp. 1271-1275.
[10] Nerlove, M. 1958. The dynamics of supply response estimation of Farmers response to price. John Hopkins press, Baltimore, USA.
[11] Pearson, S. Falcon, W. Heytens, P. Monke, E and Naylor, R. 1991. Rice Policy in Indonesia, Cornell University Press. Ithaca New York.
[11] Yu, B. Liu, F, and You, L. 2010. Dynamic Agricultural Supply Response Under Economic Transformation. IFPRI Discussion Paper, Washington, D.C. U.S.A.