62 LAMPIRAN A
HASIL UJI MUTU FISIK MASSA TABLET
LAMPIRAN B
HASIL UJI KESERAGAMAN KANDUNGAN TABLET SUBLINGUAL PROPRANOLOL HCL
Hasil Uji Keragaman Kandungan Tablet Formula A Batch I Abs C sampel W sampel C teoritis Kadar (persen)
64
Hasil Uji Keragaman Kandungan Tablet Formula A Batch III Abs C sampel W sampel C teoritis Kadar (persen)
Hasil Uji Keragaman Kandungan Tablet Formula B Batch II
66
Hasil Uji Keragaman Kandungan Tablet Formula C Batch I Abs C sampel W sampel C teoritis Kadar (persen)
Hasil Uji Keragaman Kandungan Tablet Formula C Batch III
68
Hasil Uji Keragaman Kandungan Tablet Formula D Batch II Abs C sampel W sampel C teoritis Kadar (persen)
LAMPIRAN C
HASIL UJI KEKERASAN TABLET SUBLINGUAL PROPANOLOL HCL
BATCH I
No Kekerasan tablet Propranolol HCl (kgf)
Formula I Formula II Formula III Formula IV
1 6,5 10 6,3 7,8
No Kekerasan tablet Propranolol HCl (kgf) Formula I Formula II Formula III Formula IV
70 BATCH III
No Kekerasan tablet Propranolol HCl (kgf) Formula I Formula II Formula III Formula IV
1 5,3 5,5 5,2 5,2
2 4,5 5,6 6,1 5,8
3 6,9 5,6 5,8 4,5
4 5,2 5,6 6,1 4,1
5 6,7 6,2 5,4 5,1
6 4,7 4,9 5,2 5,5
7 6,1 5,8 5 5,3
8 4,5 6,4 5,7 4,8
9 5,2 6,1 6,8 5,1
10 6,4 5,3 6,5 4,7
Rata-rata 5,55 5,7 5,78 5,01
SD 0,9071 0,4447 0,5959 0,4977
LAMPIRAN D
HASIL UJI KERAPUHAN TABLET SUBLINGUAL PROPANOLOL HCL
Formula Replikasi
72 LAMPIRAN E
HASIL UJI WAKTU HANCUR TABLET SUBLINGUAL PROPANOLOL HCL
Replikasi Waktu Hancur (menit)
Formula I Formula II Formula III Formula IV
1 12 5 30 11
2 12 3 29 11
3 10 3 30 9
LAMPIRAN F
HASIL UJI PENETAPAN KADAR PROPANOLOL HCL DALAM TABLET
Formula Replikasi Absorbansi Csampel (µg/ml)
Cteoritis (µg/ml)
Kadar (%)
X±SD SD rel (%)
1 0,574 26,090 300,9 26,168 99,86
A 2 0,56 25,453 300,9 25,530 ± 0,27
3 0,562 25,544 299,5 25,502 0,27
1 0,622 28,271 300,3 28,300 100,05
B 2 0,638 28,999 300,5 29,047 ± 0,31
3 0,627 28,499 298,8 28,385 0,31
1 0,616 27,999 300,1 28,008 99,96
C 2 0,565 25,680 301,1 25,775 ± 0,32
3 0,619 28,135 299,2 28,060 0,32
1 0,634 28,817 302,5 29,057 99,75
D 2 0,631 28,680 299,6 28,642 ± 0,51
3 0,637 28,953 300,2 28,972 0,51
74 LAMPIRAN G
HASIL UJI DISOLUSI TABLET SUBLINGUAL PROPRANOLOL HCL
Sesungguhnya Wt
FORMULA D
Replikasi A
C
sampel FP C Sesungguhnya Wt
% obat terlepas
I 0,7269 18,745 2,5 46,863 23,431 58,58
II 0,7261 18,705 2,5 46,763 23,381 58,45
76 LAMPIRAN H
CONTOH PERHITUNGAN
Contoh perhitungan sudut diam:
Formula A:
W persegi panjang = 2,69 gram W lingkaran = 0,52 gram Luas persegi panjang = 350,96 cm2
Luas lingkaran = 350,96
Contoh perhitungan indeks kompresibilitas:
Formula A :
Berat gelas = 132,39 g (W1)
Berat gelas + granul = 197,38 g (W2)
V1 = 100 ml
Bj nyata =
Contoh perhitungan akurasi & presisi:
Absorbansi = 0,644 → y = 0,022x + 0,00003 Konsentrasi sebenarnya = 29,27 ppm Konsentrasi teoritis = 29,31 ppm
78 Contoh perhitungan % obat terlepas:
% obat terlepas = 100% dosis
Wt
Formula A replikasi 1 pada t = 15 menit % obat terlepas = 100% 34,78%
40
LAMPIRAN I
SERTIFIKAT ANALISIS BAHAN
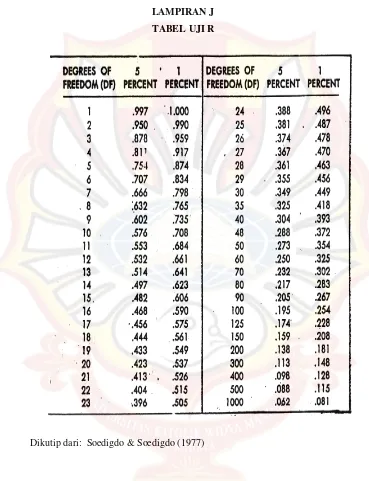
LAMPIRAN J
TABEL UJI R
82 LAMPIRAN K
LAMPIRAN L
UJI F KURVA BAKU PENETAPAN KADAR
Uji Kesamaan Regresi
REPLIKASI I
84
S X2 SXY S Y2 N SSi RDF
Regresi I 4784 105,7080 2,3486 7 2,3265 6 Regresi II 4480 92,4640 1,9104 7 1,8897 6 Regresi III 4497,9379 94,8694 2,0020 7 1,9809 6 16984,3764 376,7139 8,3915 8,3250 18 Ssc = 8,3694
LAMPIRAN M
UJI F KURVA BAKU DISOLUSI
Uji Kesamaan Regresi
REPLIKASI I
27695,2396 17,7866 696,9919 REPLIKASI II
27585,0099 19,8350 734,7416 REPLIKASI III
86
S X2 SXY S Y2 N SSi RDF
Regresi I 27695,2396 696,9919 17,7866 7 17,7614 6 Regresi II 27585,0099 734,7416 19,8350 7 19,8084 6 Regresi III 27585,0099 733,6293 19,7631 7 19,7365 6 82865,2594 2165,3627 57,3847 57,3063 18 Ssc = 57,3585
LAMPIRAN N
PERHITUNGAN ANAVA KEKERASAN
Response 1 kekerasan
ANOVA for selected factorial model
Analysis of variance table [Partial sum of squares - Type III]
Sum of Mean F p-value
Source Squares df Square Value Prob > F
Model 1.34 3 0.45 0.66 0.6005 not significant
A-Xanthan gum 0.41 1 0.41 0.60 0.4607
B-Gelatin 0.29 1 0.29 0.43 0.5304
AB0.64 1 0.64 0.94 0.3599
Pure Error 5.42 8 0.68
Cor Total 6.76 11
The "Model F-value" of 0.66 implies the model is not significant relative to the noise. There is a 60.05 % chance that a "Model F-value" this large could occur due to noise.
Values of "Prob > F" less than 0.0500 indicate model terms are significant. In this case there are no significant model terms.
Values greater than 0.1000 indicate the model terms are not significant.
If there are many insignificant model terms (not counting those required to support hierarchy), model reduction may improve your model.
58
Std. Dev. 0.82 R-Squared 0.1979
Mean5.98 Adj R-Squared -0.1029
C.V. % 13.77 Pred R-Squared -0.8047
PRESS 12.20 Adeq Precision 1.746
A negative "Pred R-Squared" implies that the overall mean is a better predictor of your response than the current model.
"Adeq Precision" measures the signal to noise ratio. A ratio of 1.75 indicates an inadequate signal and we should not use this model to navigate the design space.
Coefficient Standard 95% CI 95% CI
Factor Estimate df Error Low High
VIF
Intercept 5.98 1 0.24 5.43 6.53
A-Xanthan gum 0.18 1 0.24 -0.36 0.73
1.00
B-Gelatin -0.16 1 0.24 -0.70 0.39
1.00
AB-0.23 1 0.24 -0.78 0.32 1.00
Final Equation in Terms of Coded Factors:
kekerasan =
+5.98
+0.18 * A
-0.16 * B
-0.23 * A * B
Final Equation in Terms of Actual Factors:
kekerasan = +5.41729
+0.26521 * Xanthan gum +0.095208 * Gelatin
-0.057708 * Xanthan gum * Gelatin
60 LAMPIRAN O
PERHITUNGAN ANAVA KERAPUHAN
Response 2 kerapuhan
ANOVA for selected factorial model
Analysis of variance table [Partial sum of squares - Type III]
Sum of Mean F p-value
Source Squares df Square Value Prob > F
Model 0.059 3 0.020 903.15 < 0.0001 significant
A-Xanthan gum 0.021 1 0.021 942.11 < 0.0001
B-Gelatin 0.019 1 0.019 876.70 < 0.0001
AB0.020 1 0.020 890.63 < 0.0001
Pure Error 1.756E-004 8 2.195E-005
Cor Total 0.060 11
The Model F-value of 903.15 implies the model is significant. There is only a 0.01% chance that a "Model F-Value" this large could occur due to noise. Values of "Prob > F" less than 0.0500 indicate model terms are significant. In this case A, B, AB are significant model terms.
Values greater than 0.1000 indicate the model terms are not significant.
If there are many insignificant model terms (not counting those required to support hierarchy), model reduction may improve your model.
Std. Dev. 4.685E-003 R-Squared 0.9971
Mean0.29 Adj R-Squared 0.9960
C.V. % 1.62 Pred R-Squared 0.9934
PRESS 3.950E-004 Adeq Precision 60.537
The "Pred R-Squared" of 0.9934 is in reasonable agreement with the "Adj R-Squared" of 0.9960. "Adeq Precision" measures the signal to noise ratio. A ratio greater than 4 is desirable. Your ratio of 60.537 indicates an adequate signal. This model can be used to navigate the design space.
Coefficient Standard 95% CI 95% CI
Factor Estimate df Error Low High
VIF
Intercept 0.29 1 1.352E-003 0.29 0.29
A-Xanthan gum -0.042 1 1.352E-003 -0.045 -0.038
1.00
B-Gelatin 0.040 1 1.352E-003 0.037 0.043
1.00
AB0.040 1 1.352E-003 0.037 0.043 1.00
62 Final Equation in Terms of Coded Factors:
kerapuhan =
+0.29
-0.042 * A
+0.040 * B
+0.040 * A * B
Final Equation in Terms of Actual Factors:
kerapuhan = +0.38161
-0.051023 * Xanthan gum -0.010248 * Gelatin
+0.010090 * Xanthan gum * Gelatin
LAMPIRAN P
PERHITUNGAN ANAVA WAKTU HANCUR
Response 3 waktu hancur
ANOVA for selected factorial model
Analysis of variance table [Partial sum of squares - Type III]
Sum of Mean F p-value
Source Squares df Square Value Prob > F
Model 1117.58 3 372.53 343.87 < 0.0001 significant
A-Xanthan gum 546.75 1 546.75 504.69 < 0.0001
B-Gelatin 468.75 1 468.75 432.69 < 0.0001
AB102.08 1 102.08 94.23 < 0.0001
Pure Error 8.67 8 1.08
Cor Total 1126.25 11
The Model F-value of 343.87 implies the model is significant. There is only a 0.01% chance that a "Model F-Value" this large could occur due to noise. Values of "Prob > F" less than 0.0500 indicate model terms are significant. In this case A, B, AB are significant model terms.
Values greater than 0.1000 indicate the model terms are not significant.
If there are many insignificant model terms (not counting those required to support hierarchy),
64 model reduction may improve your model.
Std. Dev. 1.04 R-Squared 0.9923
Mean13.75 Adj R-Squared 0.9894
C.V. % 7.57 Pred R-Squared 0.9827
PRESS 19.50 Adeq Precision 43.267
The "Pred R-Squared" of 0.9827 is in reasonable agreement with the "Adj R-Squared" of 0.9894. "Adeq Precision" measures the signal to noise ratio. A ratio greater than 4 is desirable. Your ratio of 43.267 indicates an adequate signal. This model can be used to navigate the design space.
Coefficient Standard 95% CI 95% CI
Factor Estimate df Error Low High
VIF
Intercept 13.75 1 0.30 13.06 14.44
A-Xanthan gum -6.75 1 0.30 -7.44 -6.06
1.00
B-Gelatin 6.25 1 0.30 5.56 6.94
1.00
AB-2.92 1 0.30 -3.61 -2.22 1.00
Final Equation in Terms of Coded Factors:
waktu hancur =
+13.75
-6.75 * A
+6.25 * B
-2.92 * A * B
Final Equation in Terms of Actual Factors:
waktu hancur = +7.93750
-1.18750 * Xanthan gum +5.31250 * Gelatin
-0.72917 * Xanthan gum * Gelatin
66 LAMPIRAN Q
PERHITUNGAN ANAVA DISOLUSI
Response 4 disolusi
ANOVA for selected factorial model
Analysis of variance table [Partial sum of squares - Type III]
Sum of Mean F p-value
Source Squares df Square Value Prob > F
Model 11781.35 3 3927.12 603.52 < 0.0001 significant
A-Xanthan gum 8928.74 1 8928.74 1372.18 < 0.0001
B-Gelatin 2846.23 1 2846.23 437.41 < 0.0001
AB6.38 1 6.38 0.98 0.3511
Pure Error 52.06 8 6.51
Cor Total 11833.41 11
The Model F-value of 603.52 implies the model is significant. There is only a 0.01% chance that a "Model F-Value" this large could occur due to noise. Values of "Prob > F" less than 0.0500 indicate model terms are significant. In this case A, B are significant model terms.
Values greater than 0.1000 indicate the model terms are not significant.
If there are many insignificant model terms (not counting those required to support hierarchy), model reduction may improve your model.
Std. Dev. 2.55 R-Squared 0.9956
Mean47.42 Adj R-Squared 0.9940
C.V. % 5.38 Pred R-Squared 0.9901
PRESS 117.13 Adeq Precision 57.957
The "Pred R-Squared" of 0.9901 is in reasonable agreement with the "Adj R-Squared" of 0.9940. "Adeq Precision" measures the signal to noise ratio. A ratio greater than 4 is desirable. Your ratio of 57.957 indicates an adequate signal. This model can be used to navigate the design space.
Coefficient Standard 95% CI 95% CI
Factor Estimate df Error Low High
VIF
Intercept 47.42 1 0.74 45.72 49.12
A-Xanthan gum 27.28 1 0.74 25.58 28.98
1.00
B-Gelatin -15.40 1 0.74 -17.10 -13.70
1.00
AB-0.73 1 0.74 -2.43 0.97 1.00
68 Final Equation in Terms of Coded Factors:
disolusi =
+47.42
+27.28 * A
-15.40 * B
-0.73 * A * B
Final Equation in Terms of Actual Factors:
disolusi = +27.96354
+14.18562 * Xanthan gum -7.15354 * Gelatin
-0.18229 * Xanthan gum * Gelatin