45
THE ROLE OF HOTEL AND RESTAURANT TAXES AND ITS
EFFECT ON BANDA ACEH’S LOCAL OWN SOURCE REVENUE
Asnita Sitompul1, Sofyan Syahnur2 and Chairul Ichsan3
1Postgraduate Student in Economics, University of Syiah Kuala, Banda Aceh, Indonesia
2Senior Lecturer, Faculty of Economics, Syiah Kuala University, Banda Aceh, Indonesia 3Professor, Faculty of Economics, Syiah Kuala University, Banda Aceh, Indonesia
Abstract: The purpose of this research is to describe the role and the effect of hotel and restaurant taxes on Banda Aceh’s local own source revenue. Its role will be focused on analyzing tax contribution, the efficiency and effectiveness of tax collection system. Meanwhile, its effect on local own source revenue can be identified by regression analysis for 27 years (1984-2010). The results show that the average contribution of hotel and restaurant taxes is still relatively low. Moreover, the system of tax collection in Banda Aceh has been performed efficiently and effectively. But, there is a gap between the potentiality and the realization of taxes. Furthermore, hotel and restaurant taxes are statistically significant influenced local own source revenue. Therefore, government should pay more attention to improve the tax administration system in the future, enhance the quality of tax administrator, increase tax efforts intensively than extensively, and implement rewards and punishment on the overall systems. In sum, the role and the effect of hotel and restaurant taxes can induce Banda Aceh’s local own source revenue.
Keywords: Hotel and restaurant taxes, Efficiency, Effectiveness, Effect of Tax, Local Own Source Revenue
Introduction
One of the effects of regional autonomy from the central government started in 2001, the authority of Banda Aceh Municipality becomes higher in managing the local affairs, especially in financial sector. Some prominent sources of local finance (local own source revenue (PAD)) come from local taxes (PD), local user charges, and others (Bahl and Linn, 1992:32). Generally, the most of local revenue is contributed by local taxes.
In this context, the Banda Aceh government should be able to optimize the tax revenue and its potentiality in order to finance the sustained local development. Meanwhile, the condition of local own source revenue and local taxes revenue of Banda Aceh during 1984 to 2010 tends to increase annually. In 1984, local own source revenue started at 0.6 billion rupiahs and increased continuously until reaching out 52.8 billion rupiahs in 2010. One of the reasons is because local taxes increased. In 1984, local taxes (PD) realization increased from 0.2 billion rupiahs in 1984 up to 27.3 billion rupiahs in 2010. The others are a higher tax consciousness of taxpayer and a better services point on tax administration might have affected this condition.
46
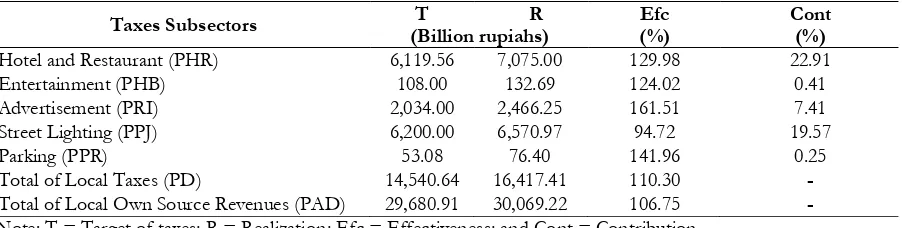
Table 1.1. The Contribution of Each Tax Subsectors on Banda Aceh’s Local Own Source Revenue, 2009
Taxes Subsectors T R Efc Cont
(Billion rupiahs) (%) (%)
Hotel and Restaurant (PHR) 6,119.56 7,075.00 129.98 22.91
Entertainment (PHB) 108.00 132.69 124.02 0.41
Advertisement (PRI) 2,034.00 2,466.25 161.51 7.41
Street Lighting (PPJ) 6,200.00 6,570.97 94.72 19.57
Parking (PPR) 53.08 76.40 141.96 0.25
Total of Local Taxes (PD) 14,540.64 16,417.41 110.30 -
Total of Local Own Source Revenues (PAD) 29,680.91 30,069.22 106.75 - Note: T = Target of taxes; R = Realization; Efc = Effectiveness; and Cont = Contribution
Table 1.1 also shows the effectiveness of tax collection system. The realization of hotel and restaurant taxes exceeds the target of taxes. It means that tax collection system has been very effective. However, has the target determination been realistic? What is the basic for setting it? It is known that the level of effectiveness depends on the target determination. So, whenever the target is underestimated, then it affected the effectiveness. On the other hand, how the cost of administrations that has been expended remains unknown, is it efficient or inefficient? Therefore, the first objective of this research is to describe the role of hotel and restaurant taxes by analyzing its contribution to local own source revenue, as well as to analyze the efficiency and effectiveness of its collection system. Moreover, based on the final reports of Financial Audit Agency (BPK) as quoted on the newspaper (Serambi Indonesia, 2010:3), Banda Aceh’s government still have taxes arrears in 2007-2009 amounted about 1.69, 0.44, and 2.84 billion rupiahs, respectively. The direct impact is the funds collected from those taxes subsectors cannot be functioned immediately to finance government spending. For instance, nearly 1.65 billion rupiahs of funds came from hotel and restaurant taxes arrears in 2009 were disable to be functioned immediately by the government. Additionally, government has lost the opportunity to get money as a fine charge of tax administration by letting it happened. These situations, of course, stimulated some questions whether local government have been allowing this happened continuously, what had government do in order to anticipate this situation, so it would not be going to happen anymore in the future. Letting it happened means violating what has been contained in local regulations, Acts No. 5/1998 about Hotels and Restaurants taxes collection system in Banda Aceh. Therefore, the second objective of this research is to analyze the influence of hotel and restaurant taxes on local own source revenue of Banda Aceh Municipality.
LITERATURE REVIEW
47
The some previous studies have found the important conclusions. Darniati (2006) compared the ratio between hotel taxes contribution and restaurant taxes contribution in Banda Aceh. She concluded that the average contribution of hotel and restaurant taxes amounted to 4-6 per cent during 1997/1998-2004. The research about the efficiency and effectiveness of hotel and restaurant taxes in inducing local own source revenue examined by Daud (Halim, 2004:61-165) in Kendari regency. Starting data samples in 2000 as the base year, the effectiveness was calculated at 3.80 per cent, which means yet ineffective. He found the efficiency was about 96.13 per cent. By expressing his pre assumption of efficiency, he determined the rate of efficiency was lesser than 40 per cent as the efficient criteria; otherwise, it was included inefficient. The result shown efficiency rates at 96.13 per cent which indicated that hotel and restaurant taxes were still inefficient in Kendari regency. Furthermore, regression of analysis is conducted by Marpaung (2009) to observe the influence of hotel and restaurant taxes on local own source revenue in Medan during 2003-2007. By using hotel and restaurant taxes as independent variables and local own source revenue as dependent variable, he expressed in his paper that hotel taxes have negative influence to local own source revenue in Medan, but the restaurant taxes have a positive influence on it. This is shown by the regression coefficient which is about -0.456 and 1.425, respectively. It implied that hotel and restaurant taxes influenced local own source revenue significantly in Medan during 2003-2007.
RESEARCH METHOD
In analyzing the role of hotel and restaurant taxes and its influence on Banda Aceh’s local own source revenue (PAD), this research uses two types of data, that is primary and secondary data. The primary data is collected by using Stratified Random Sampling method with 25 samples of selected hotels in Banda Aceh. The data consists of the number of rooms available (Rai), daily room rates (Rri), and daily amount of tax paid (PHi) in 2009. On the other hand, the secondary data is obtained from various institutions and other related department, such as Central Bureau of Statistics (BPS), Local Finance and Asset Management office (DPKAD), libraries, etc. Meanwhile, the type of secondary data is time series data for 27 years of observations (1984–2010), namely: the target and realization of hotel and restaurant taxes (PHR), hotel and restaurant administrative cost of collection (AC), realization of local taxes (PD), realization of local own source revenue (PAD), and others.
Furthermore, the role of hotel and restaurant taxes on local own source revenue will be focused on analyzing the contribution, the efficiency and effectiveness of it. The contribution analysis is calculated by using this following formula (Halim, 2004:163):
= �
� � % … … …
Where Pn referred to the contribution of hotel and restaurant taxes on local taxes and on
local own source revenue (in rupiahs), QX denotes as the amount of hotel and restaurant taxes (in
rupiahs), and QY denotes as local taxes or local own source realization (in rupiahs).
As the previous research, Darniati (2006) used the same formula. But, it is different from hers, this research more emphasize on what condition has been applied in the collection system, so that the role of taxes occurred in such of percentage. Therefore, the research tries to investigate the condition of hotel tax paid (PHi) that levied by the government, to describes its real potentiality and real realization, to estimates the gaps in between, as well as to finds the factors affected it. Meanwhile, the efficiency of hotel and restaurant tax is calculated by the following formula (Halim, 2004:164):
48
And the amount of tax effectiveness is calculated by this following formula (Halim, 2004:164):
= ���� � � � � � � %..
Where “Efi” and “Efc” stand for Efficiency and Effectiveness. In this research, the formula
in the equation 2) and 3) above are similar to the formula that has been used by Daud (Halim, 2004:61-165). But, Daud used different standards concerning tax effort performances. Meanwhile, this research uses the standard of tax effort performance based on Table 3.1.
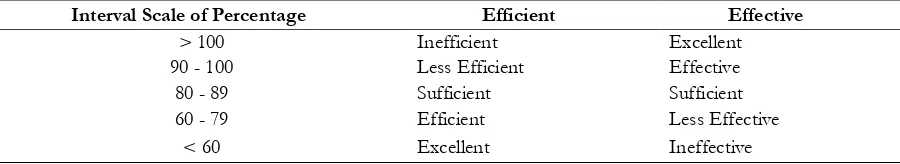
Table 3.1. Tax Effort Performances
Interval Scale of Percentage Efficient Effective
> 100 Inefficient Excellent
90 - 100 Less Efficient Effective
80 - 89 Sufficient Sufficient
60 - 79 Efficient Less Effective
< 60 Excellent Ineffective
Sources: Depdagri, Kepmendagri No.690.900.327/1996
Whenever the percentage ratio between target and realization approaching 100 per cent. It means that taxing performance has been effectively collected. The more effective taxing effort can be seen by comparing effectiveness percentage of recurrent year to the previous one. In contrast, the efficient performance may happen whenever the calculated percentage value is higher than the percentage value in Table 3.1. The smaller percentage means the more efficient of taxing effort performance.
To investigate the amount of taxes paid (PHi) and the condition of factors affected it in 2009, this research tries to calculate it by multiplying hotel revenues with hotel taxes base, as formulated as follows (Halim, 2004:164):
��= � � � � � � � ….… (4)
And then, calculated tax paid as follows:
�� = �� � � …...………….... (5)
Where RHirefers to the revenue of hotel -i (in rupiahs), PHi stands for the amount of hotel -i tax paid (in rupiahs), Rai is as the total numbers of rooms available in hotel -i (in unit rooms), Rri
denotes as the average of hotel –i daily room rates (in rupiahs per day), OCRi denotes as the
Occupancy room rates of hotel -i (in percentage), Di stands for the number of days within a year,
assumed 365 days (in days), Tb denotes as the tariff of hotel tax base, which is 10 per cent (in
percentage).
Furthermore, the effect of hotel and restaurant taxes (PHR) on local own source (PAD) is investigated by regressing hotel and restaurant taxes realization (PHR) to local own source revenue realization (PAD). The formula is as follows (Marpaung, 2009:47):
� = + 1 � + �………... (6)
49 RESULT AND DISCUSSION
The Growth of Local Taxes and Local Own Source Revenue
By decades, the growth of local taxes and local own source revenue had been increased. First decade was from 1984 to 1990, the second was the time from 1991 to 2000, and the last decade was the time from 2001 to 2010. At the beginning, it shows that local taxes grew at 13.28 per cent on the average while local own source revenue existed on 15.91 per cent. In the middle time, they had decreased to the level 11.56 per cent and 6.65 per cent, respectively. The decreasing situation is stimulated by the economic instability. Finally, they returned to increase; local taxes reached 63.69 per cent and local own source revenue reached 54.05 per cent. It happened because of some improvement in the tax regulations and in the economic conditions. The average growth of local taxes was about 30.82 per cent and the average growth of local own source revenue was about 26.02 percent annually.
Figure 4.1 The Growth of Local Taxes and Local Own Source Revenue of Banda Aceh, 1984-2010 (in Percentage)
Source: Data Processed (2010)
Notes: - PD = Local Taxes; - PAD = Local Own Source Revenue
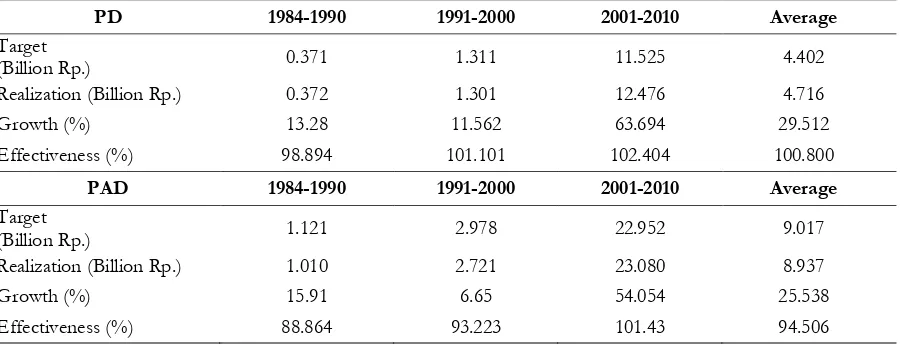
Table 4.1 The Growth of Local Taxes and Local Own Source Revenue of Banda Aceh, 1984-2010
PD 1984-1990 1991-2000 2001-2010 Average
Target
(Billion Rp.) 0.371 1.311 11.525 4.402
Realization (Billion Rp.) 0.372 1.301 12.476 4.716
Growth (%) 13.28 11.562 63.694 29.512
Effectiveness (%) 98.894 101.101 102.404 100.800
PAD 1984-1990 1991-2000 2001-2010 Average
Target
(Billion Rp.) 1.121 2.978 22.952 9.017
Realization (Billion Rp.) 1.010 2.721 23.080 8.937
Growth (%) 15.91 6.65 54.054 25.538
Effectiveness (%) 88.864 93.223 101.43 94.506
In addition, Table 4.1 shows local taxes and local own source revenue in the perspectives of its effectiveness. The lowest average of local taxes realization occurred during 1984-1990, amounted to 0.372 billion rupiahs and the highest realization was occurred during 2001-2010, that is about 12.476 billion rupiahs. It brings the effectiveness of local taxes realization to 100.800 per cent on average. Meanwhile, the lowest average of local own source revenue realized at 1.010
50
billion rupiahs during 1984-1990 and reached the highest revenue, which is about 23.080 billion rupiahs during 2001-2010. The effectiveness of local taxes is rated at 100.800 per cent annually and the effectiveness of local own source revenue is rated at 94.506 per cent annually. It means that the collection of local own source revenue is less effective than the collection of local taxes for the last 3 decades.
The Growth of Hotel and Restaurant Taxes
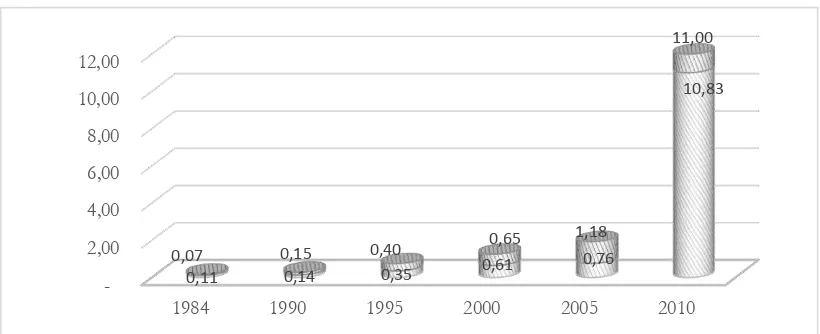
Hotel and restaurant taxes (PHR) have a positive trend over the past 27 years, as shown by Figure 4.2. Mostly, the realization always exceeds the target (18 of 27 targets is reachable). In 1984, the realization of it amounted to 0.07 billion rupiahs which is over its target at 0.11 billion rupiahs. In 1990, it realized at 0.15 billion rupiahs which exceeded its target on 0.14 billion rupiahs. In 2000, the realization of it unreached the target (0.61 over 0.65 billion rupiahs). Currently, its realization was only 10.83 billion rupiahs over the target that amounted to 11 billion rupiahs.
Figure 4.2 Hotel and Restaurant Taxes of Banda Aceh, 1984-2010 (in Billion Rupiahs)
The Role of Hotel and Restaurant Taxes Contribution Analysis
Figure 4.3 above displayed the graph of hotel and restaurant tax contribution on local taxes, as well as on local own source revenue. The analysis conducted by comparing the ratio of recurrent contribution to the previous one. The result shows that the real contribution of hotel and restaurant taxes to local own source revenue is ranged between 10 and 34 per cent or reached about 15.52 per cent annually within 27 years. Meanwhile, hotel and restaurant taxes contributed about 32.81 per cent on annual average to local taxes. In the perspective of its contribution, the role of hotel and restaurant taxes on local own source revenue of Banda Aceh is still low or insufficiently, as its contribution only reached 15.52 per cent. As the critical value of tax contribution, this research used the same standard of financial performance on Table 4.2 on Munir, et al. (2004:47). So, it may say that under 20 per cent of revenue contribution is stated as a low role of taxes to induce local own source revenue; yet it insufficiently accommodating the local development needs of funds. Revenue shared under 20 per cent will lead to local authority lost their power in carrying out the mandate of regional autonomy, as they still have a highly level of dependency on central government. Therefore, it still needs some improvements in taxes collection systems in Banda Aceh.
2,00 4,00 6,00 8,00 10,00 12,00
1984 1990 1995 2000 2005 2010
0,11 0,14 0,35
0,65
0,76
11,00
0,07 0,15 0,40
0,61
1,18
10,83
51
Figure 4.3. The Contribution of Hotel and Restaurant Taxes on Banda Aceh’s Local Own Source Revenue, 1984-2010 (In Percentage)
Efficiency Analysis
Concerning the data constraints in compiling the exact administrative cost data of hotel and restaurant taxes, then this research used indirect indexes to replace it. It means substituted administrative costs of hotel and restaurant taxes with the administrative costs of local taxes (see Appendix A). On this research, administrative costs (AC) estimation only available for 13 years.
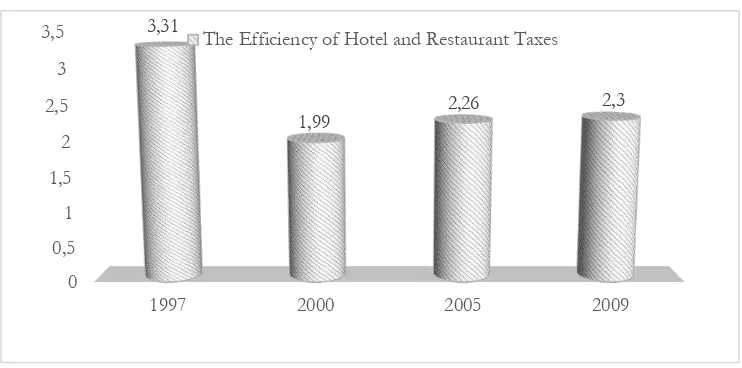
Figure 4.4. The Efficiency of Banda Aceh’s Hotel and Restaurant Taxes, 1984-2010 (In Percentage)
The efficiency of hotel and restaurant taxes collection is displayed on Figure 4.6 above. It varied from 1.22 per cent to 4.40 per cent. The average efficiency is about 2.52 per cent for 13 years. Thus, on the perspective of administrative cost, as recalled Table 3.1 above, we may conclude that taxes collection system has efficiently implemented, but it still needs some improvements in the future.
Effectiveness Analysis
The effectiveness of hotel and restaurant taxes (PHR) collection is measured by the ratio between realization and target of hotel and restaurant taxes (PHR) revenue. The effectiveness and the realization of hotel and restaurant taxes collection can be seen the table below.
28,51
1984 1988 1992 1996 2000 2004 2008 2012
CONTRIBUTION OF PHR TO PD CONTRIBUTION OF PHR TO PAD
52
Table 4.2 . The Effectiveness of Banda Aceh’s Hotel and Restaurant Taxes, 1984-2010 (In Percentage)
No. Year PHR (Billion Rupiahs) Effectiveness
(%) Target Realization
1 1984 0.11 0.074 67.63
7 1990 0.143 0.146 101.98
12 1995 0.35 0.398 113.84
17 2000 0.645 0.769 119.19
22 2006 0.76 1.175 157.54
27 2010 9.553 10.827 113.88
Average 107.57
The maximum rate of effectiveness is reached 157.54 per cent. Meanwhile, the minimum rate happened in 1984, amounted to 67.63 per cent. Then, the average of effectiveness has reached about 107.57 per cent annually for 27 years of observation. Referred to Table 3.1 above, then we may draw the conclusion that hotel and restaurant taxes collection has been performed effectively, as the rate of its effectiveness is above 100 per cent. The result shows that taxes efforts had been efficiently and effectively performed. However, administrators still necessarily need to improve some more collection efforts. In this context, research found that there are some constraints to the efforts affecting the performance efficiently and effectively. One of those emerged in the case of targeting predictions that seemed to be unrealistic since the target inaccurately predicted in the planning session. Of course, the lack of it will influence the rate of effectiveness.
It is had been observed that the implementation of target prediction is based on the previously realization of taxes revenue. This is yet optimal and unrealistic to reflecting the real potentiality of taxes. In targeting prediction, not only it should consider its previous realization, but also it should consider its potentiality, the annual growth, the mean value of it, and so on. Besides, it should concern the economic condition, as well as political and social condition. The positive economic growth, social and political sustainability could bring the opportunity to government in achieving the target easily, of course, combined by tax compliance and tax consciousness from the society (Riduansyah, 2003:52).
The Gap Between Potentiality and Realization of Tax
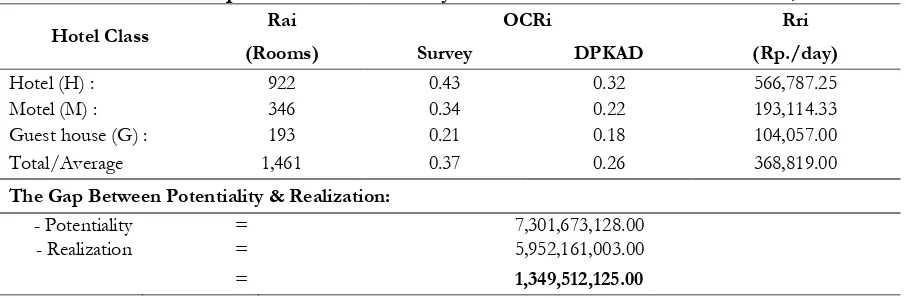
In terms of calculating the real potentiality of hotel revenues (or equals to hotel taxes paid), this research compiled the primary data and the results are summarized in the Table 4.3 below.
Table 4.3 The Gap between Potentiality and Realization of Hotel’s Taxes, 2009
Hotel Class Rai OCRi Rri
(Rooms) Survey DPKAD (Rp./day)
Hotel (H) : 922 0.43 0.32 566,787.25
Motel (M) : 346 0.34 0.22 193,114.33
Guest house (G) : 193 0.21 0.18 104,057.00
Total/Average 1,461 0.37 0.26 368,819.00
The Gap Between Potentiality & Realization:
- Potentiality = 7,301,673,128.00
- Realization = 5,952,161,003.00
= 1,349,512,125.00
53
of hotel taxes of Banda Aceh was still high, it reached 1.349 billion rupiahs in 2009. It means that there are taxes funds that are yet able collected by the tax administrator. Therefore, it makes the government loss their opportunity to increase tax revenues. The gap between potentiality and realization of taxes is a common situation that happened in every country in the world. The problem is how large the gap is occurred, because it will impact government revenues. Waweru (Cheesemen and Griffith, 2005:11) observed about the gap between tax that ought to be paid (potentiality) and tax that actually paid (realization). He said that in general, the gap ranged in 10-40 on the average percentage, but there are countries which have the gap over 10-40 per cent its realization. In the case of Banda Aceh, the gap potentiality and realization of taxes occurred is about 1.349 billion rupiahs or equals to 22.67 per cent.
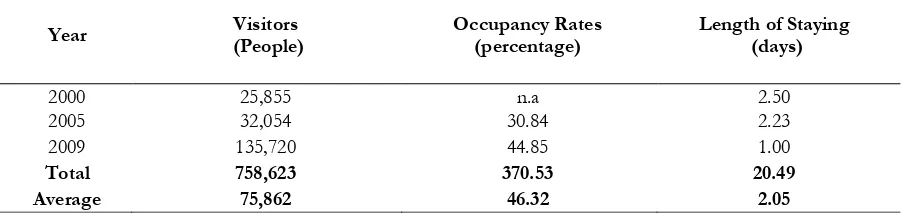
Table 4.4. Number of Visitors, Occupancy Rates, And Length of Staying on Banda Aceh’s Hotel, 2000 – 2009
The Influence of Hotel and Restaurant Taxes
Recently, numerous improvement of hotel and restaurant sectors emerged in Banda Aceh. Based on BPS data in 2000, hotels amounted to 25 units. In 2005, it increased slightly to 26 units. Nowadays, it grows significantly to 41 units or increased almost twofold of its numbers in 2005. Of course, it brings hotel and restaurant sectors hold an important roles in improving the economic activities in Banda Aceh. These increasing numbers happened as the result of highly number of visitors who visiting Banda Aceh, as well as determined the number of occupancy rate, and visitors length of staying, as shown on Table 4.4. In brief, the table shows that visitors about 75,862 person yearly over the last 10 years. The increasing of visitors brings the improvement on the number of rooms available. How effective was exactly hotel rooms occupied during the time of observations are measured by calculating the ratio between number of rooms night occupied and the number of rooms night available, or it is known as the room occupancy rates (OCR). In Banda Aceh, the occupancy rates numbered at 46.32 per cent on yearly average, while the length of staying which is determined the amount of hotel revenues numbered about 2.05 days yearly.
By reviewing hotel and restaurant potentiality condition in Banda Aceh, Banda Aceh government has taken a policy to treat tourism sector as the basis sector. The facilities and infrastructures have already supported the policy implementation. One of the policy running by government was Visit Banda Aceh Year 2011. In lines with this context, government provides other policy to support the program, such as running visa on arrival policy, improving one stop services for business administration simplicity, and so on. This policy is implemented as the government effort to accelerating the economy or linkage economic activities which were creating multiplier effect to generate the social welfares. It is well known before that tourism industry can accelerate the economy through some sectors, such as (Soekarwo, 2003:10): (a) Changing the economic activity or creating the newly job opportunity on tourism, such as hotel, restaurant, transportation, etc. (b) Impact positively to the labor forces; (c) Market extension of local products; and (d) Accelerating economic activity circulation, and increasing public incomes as well.
54
so on. Those are the reasons why it can generate the multiplier effect acceleration. Meanwhile, to estimate the influence of hotel and restaurant taxes on local own source revenue, then this research had analyzed the simple regression model by using Ordinary Least Square (OLS) methods and the result is shown by the table below. Table 4.5 lists the output of the least squares regression analysis. Overall, the result shows that the model performs quite satisfactory with some 61.58 per cent of the total variation in local own source revenue (PAD) explained by the explanatory variable, while the rest of it, about 38.42 per cent, is explained by another variables outside the model (with assumptions others remain the same/ceteris paribus).
Table 4.5. The Influence of Hotel and Restaurant Taxes on Local Own Source Revenue, 1984-2010
Dependent Variable Coefficient Std. Error t-Stat. Prob.
Α -0.013 0.052 -0.239 0.000
1 0.962 0.155 6.202 0.000
R-squared = 0.615 Adj. R-squared= 0.599
D - W stat = 2.562 F-statistic = 38.464
Regression Equation : PADt = + 1 PHRt
Note: PADt = Local Own Source Revenue; PHRt = Hotel and Restaurant taxes.
Hotel and restaurant taxes variable in the model has the expected signs and statistically significant at 5 per cent level of significance. It indicated that hotel and restaurant taxes has influenced on local own source revenue significantly (see Appendix B). Therefore, we may conclude that every 1 per cent the increasing of hotel and restaurant taxes will influence local own source revenue about 0.962 per cent. The final linear regression expressed as following:
� � = − . + .96 ∗ � � + �
Where: PADt refers to the first differences of local own source revenue in natural logarithm (in percentages), PHRt stands for the first differences of Hotel and restaurant taxes revenue in natural logarithm (in percentages), and et stands or Error terms.
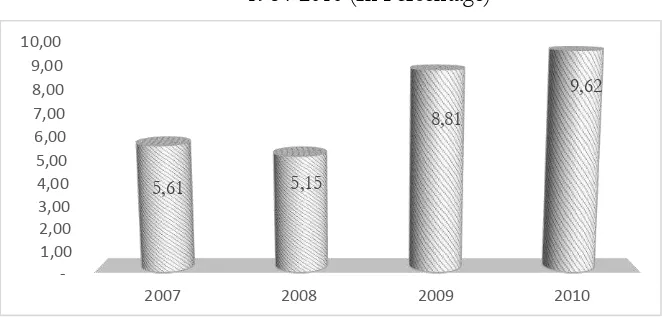
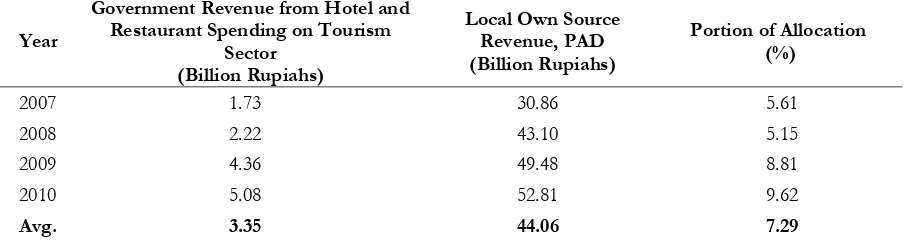
In addition, the model has been fulfilled the requirements of BLUE estimators and has been tested free from all of the classical assumption violation. According to local Acts No. 5/1998, as hotel and restaurant basic procedures of tax collection system, Banda Aceh’s government has regulated the rule about the allocation and distribution of taxes fund to support and improve tourism sector. The amount of it is required at least 20 per cent of its revenue. In this term, this research observed how large is the influence of hotel and restaurant taxes fund that had allocated on tourism sectors by the government. As the indicator of it, this research used the data of government revenue from hotel and restaurant spending on tourism sector. The data is only available for the last four years (2007-2010), as shown on Figure 4.5.
55
During 2007-2010, government revenue from hotel and restaurant spending on tourism sector has been increased yearly. Started from 5.61 per cent in 2007, it increased to 9.62 per cent in 2010. In the perspective of the amount of government spending, that increasing is equals to 1.73 million rupiahs and ups to 5.08 million rupiahs, as it shown on Table 4.10. It is shown that government has expended about 7.29 per cent of tax funds on tourism sectors. It means that budget allocation on tourism sector has unfulfilled those requirements (regarding 20 per cent of tax fund allocation). Hence, government should expend more in tourism sector to raise more of
this sector’s revenues.
Table 4.6 The Allocation of Tax Fund on Banda Aceh’s Tourism Sector, 2007-2010
Year
Finally, the allocation of tax fund on Banda Aceh’s tourism sector is numbered at 7.29 per
cent. It has indicated that the influence of hotel and restaurant taxes on local own source revenue need to be optimized in the future. Therefore, government should emphasize more efforts to enhance the role of it. The efforts consist of (Mardiasmo, 2004:44-45) such as (a) Keeping target of tax determination becomes more realistic by considering not only its previously realizations, but also determine its potentiality, its average growth, its economic and demographic condition, and so forth, (b) Eliminating tax evasion and tax fraud in the system, (c) Reinventing some taxes objects to increase its revenues, (d) Appling rewards and punishments policy, (e) Promoting good governances performances in tax administrations, (f) Simplifying taxes procedures and reducing constraints on the services procedures, and (g) Optimizing taxes compliance efforts. By implementing all of those efforts, hopefully it will raise the influence of hotel and restaurant taxes so that the role of hotel and restaurant taxes is bigger to induce local own source revenue in the future.
CONCLUSSION AND RECOMMENDATION
56
allocated about 32.19 per cent and contributed about 11.04 per cent to the capital investment. Thus, the hotel and restaurant taxes brings a positive influenced on Banda Aceh’s local own source revenue.
Here are some suggestions that can be inferred as the inputs to the government relating to enhance taxing efforts such as (1) Improves the tax administration system such as updating database, supervising, monitoring, and reporting. The research found that the data was cannot purely reliable as I found some versions of the data in the same year. Of course, it can mislead the users. Additionally, the supervision in the tax collection systems should be improved, the improvement of the quality of tax administrator as well, should get more attention from tax institution by giving them some training, short courses, etc, (2) In the planning and budgeting phase, target prediction of taxes and another local revenues should not only based on the previous year realization, but also should consider the real potentiality, the mean growth, the economic condition, as well as political and social condition. By doing so, then the target prediction can be more realistic, (3) In order to optimizing local revenues, it is worth enough for the policy makers considering the priority to enhance intensification efforts than to enhance extension efforts on tax collection system, (4) Apply rewards and punishments to create tax compliances on taxpayers and on administrators. For those taxpayers who immediately fulfill their obligation, they deserved some rewards in the form of discount rates, or free of compliances cost. In addition, the administrators who succeed to carry out their tasks in collecting taxes, they deserved some additional incentives, so it can stimulate their spirits in collecting efforts. In Contrast, the stubborn taxpayers should get any sanctions whether in the form of fined charges, as well as the possibility to close their business, or levied taxes forcedly by involving the police, law enforcement officers, and others, and (5) The allocation and distribution of tax fund must be clear, and transparently, so it can convince people to stimulate their consciousness and compliances. Transparency will motivate people to completing their tax obligations because they understand and realize obviously that the benefits of their contributions on paying taxes will repay by the government through the improvement provision of some public services and infrastructures.
REFERENCES
Anonymous, (1998), Peraturan Daerah Kotamadya Daerah Tingkat II Banda Aceh No.5 Tahun 1998 tentang Pajak Hotel dan Restoran hukum.bandaacehkota.go.id (August 29th, 2010).
Anonymous, (2009), Undang-Undang Republik Indonesia No. 28 Tahun 2009 tentang Pajak Daerah dan Retribusi Daerah, www.dsfindonesia.org (June 02nd, 2010).
Bahl, Roy. W., and Johannes F. Linn, (1992), Urban Public Finance in Developing Countries, World Bank Book, Publisher: Oxford University, New York, http://www-wds.worldbank.org
(August 29th, 2010).
Cheesman, N., and Robert Griffith, 2005, Increasing Tax Revenue in Sub Saharan Africa: The case of Kenya, Published by Oxford Council on Good Governance (OCGG), Economy Analysis No.6, United Kingdom, www.oxfordgovernance.org (2nd March, 2010)
Darniati, Nia, (2006), Analisis Perbandingan Penerimaan antara Pajak Hotel dan Pajak Restoran Kota Banda Aceh, Research paper, Syiah Kuala University.
Halim, Abdul, (2004), Bunga Rampai: Managemen Keuangan Daerah, Revised Edition, Publisher: UPP AMP YKPN, Yogyakarta.
Mardiasmo, (2004), Otonomi dan Manajemen Keuangan Daerah, First Edition of Regional Autonomy series, Publisher: Andi, Yogyakarta.
Marpaung, Junior N., (2009), Pengaruh Pajak Hotel dan Pajak Restoran terhadap Pendapatan Asli Daerah kota Medan, Research paper, University of Sumatera Utara,
www.repository.usu.ac.id (October 8th, 2010)
57
Riduansyah, Muhammad, (2003), Kontribusi Pajak Daerah dan Retribusi Daerah terhadap Pendapatan Asli Daerah (PAD) dan Anggaran Pendapatan dan Belanja Daerah (APBD) Guna Mendukung Pelaksanaan Otonomi Daerah (Studi Kasus Pemerintahan Kota Bogor), First Edition, Publisher: Rajagrafindo Persada, Jakarta. Serambi Indonesia, (September 22nd, 2010), Tunggakan Pajak Daerah Mencapai Rp. 2.8
Miliar, Banda Aceh.
Setiawan, Ferry, (2009), Posisi Pendapatan Asli Daerah (PAD) Kota Banda Aceh, Theses, Syiah Kuala University.
Siahaan, P. Marihot, (2008), Pajak Daerah dan Retribusi Daerah, First Edition, Rajagrafindo Persada, Jakarta.