THE RELATIONSHIP BETWEEN PRODUCT DIVERSITY AND THE
PERFORMANCE OF CREDIT UNIONS AND BADAN USAHA KREDIT
PEDESAAN IN YOGYAKARTA SPECIAL PROVINCE
Stephanus Eri Kusuma Universitas Gadjah Mada ([email protected])
Wihana Kirana Jaya Universitas Gadjah Mada
ABSTRACT
This study analyzes the relationship between product diversity and the performance of microfinance institutions (MFIs), especially Credit Unions (CUs) and Badan Usaha Kredit Pedesaan (BUKPs) in Yogyakarta. It employs a binary logistic regression method in its analysis and utilizes annual pooled cross section data from 16 CUs and 34 BUKPs in Yogyakarta from 2011. The result indicated that there was a direct negative relationship between the levels of saving–loan product diversity and the scale of outreach and also between the levels of saving– loan product diversity and depth of outreach. It also suggested an indirect negative relationship between the levels of saving–loan product diversity and staff productivity and also between the levels of saving–loan product diversity and self-sufficiency.
Keywords: product diversity, performance, microfinance institutions, CUs, BUKPs
INTRODUCTION
A shift of the paradigm and practice in the microfinance field in the last 10 years is the change in MFIs focus, from providing only a single product to offering combined microfin-ance products (Rossel-Cambier, 2008).1 Despite its increasingly widespread practice, the issue of combined microfinancing has received relatively little attention. The Rossel-Cambier‘s study stated that specific research questions such as whether combining credit and insurance services improved or weakened the organisational per-formance of micro-finance schemes remains underexplored.
Some previous empirical studies2 which focused on explaining the relationship between
1
Initially, MFIs only provided business loan service. Nowadays, they also provide loans and savings for many purposes, insurance, transfer, leasing and non-financial services.
2
Esho, et al. (2005), Goddard, et al. (2008), Barry and Tacneng (2009), Rossel-Cambier (2010a, 2010b, 2011) and also Lensink, et al. (2011).
product diversity, diversification and the per-formance of MFIs indicated that there was still no consensus regarding the relationship between product diversity and the performance of MFIs. Despite our best efforts to find empirical studies related to this study, the authors could not find a study focused on the product diversity issue in the context of Indonesian MFIs. To fill this gap, the authors performed a study which focused on analyzing the relationship between product diversity and the performance of MFIs operating in Indonesia, especially in the context of Credit Unions (CUs) and the Badan Usaha Kredit Pede-saan (BUKPs) in Yogyakarta Special Province.
Decem-ber 2011 was used in this research as the data period because it is the most up-to-date overall annual data that can be provided by the MFIs sampled at the time of data gathering (Septem-ber–December 2012).
The purpose of this research was to identify whether or not the relationship between product diversity and performance exists in the operation of the CUs and BUKPs in Yogyakarta Special Province. The CUs and BUKPs were chosen as the MFIs to be sampled with respect to certain considerations. First, the CUs and BUKPs were the two most sustainable examples of non-bank MFIs amongst the group of financial coopera-tives and village credit institutions (ProFi, 2006; Rahayani, 2009). Second, empirical studies which focused on credit unions and village credit institutions (including BUKPs) were still limited (Kusumajati, 2012). Third, the probability of accessing reliable and actual data from the CUs and BUKPs was relatively higher than from the other non-bank MFIs because most of the CUs and BUKPs have a structured and relatively up-to-date performance documentation system. Fourth, the individual CUs and BUKPs tend to have relatively similar main operational activi-ties, operational scales and effectiveness levels of the institutional system. This gives a logical reasoning for integrating the unit data from the two different MFIs.3
3
In regards to the operational activities of CUs and BUKPs, both MFIs have the same mission to serve people who are underserved or unserved by the existing financial institu-tions. In addition, both MFIs also place the provision of savings and credit services as their major activities. Regarding their scales of operation, the data showed that
The following section reviews the frame-work to understand the relationship between the product diversity and performance of the MFIs. The next section describes the methodology of this research. After that we explain the data and analysis of this study. The final section is the conclusion and recommendations.
Relationship between the Product Diversity and Performance of MFIs
Rossel-Cambier (2010b) stated that the pro-vision of combined microfinancing, by defini-tion, offered clients the possibility of a larger choice of financial services than that offered by mono-product MFIs. Offering more services means that more needs are addressed and hence more socially excluded people will make use of these services. According to Frankiewicz & Churchil (2011), conceptually, product diversity and diversification can bring both positive and negative effects to an MFIs performance. The positive effects arise from the increase in client satisfaction and loyalty that will be translated into the increase in word of mouth promotion by clients and loans-savings clients transactions quality. In addition, the more varied products provided by the MFIs enable them to diversify
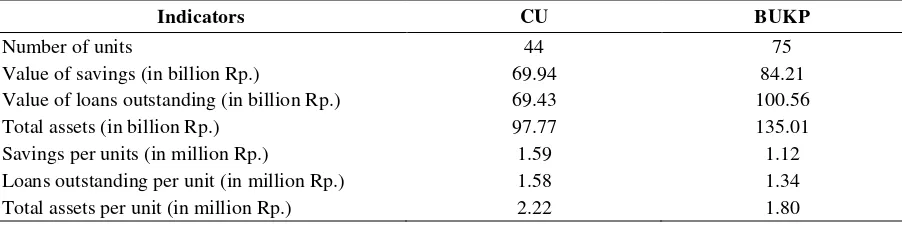
the average value of savings, credit and assets of the CUs and BUKPs in Yogyakarta Special Province is not very different (see table 1). Moreover, although the ownership and organization structure of these two MFIs are different, they have their own advantages regarding their institutional structured elements (e.g. formal and informal rules, monitoring and enforcement mechanisms) so that the effectiveness of their institutional systems are relatively similar.
Table 1. Some performance indicators of CU and BUKP in Yogyakarta Special Province, 2011
Indicators CU BUKP
Number of units 44 75
Value of savings (in billion Rp.) 69.94 84.21
Value of loans outstanding (in billion Rp.) 69.43 100.56
Total assets (in billion Rp.) 97.77 135.01
Savings per units (in million Rp.) 1.59 1.12
Loans outstanding per unit (in million Rp.) 1.58 1.34
Total assets per unit (in million Rp.) 2.22 1.80
their sources and use of funding, and hence in-crease the effectiveness of their MFIs risk man-agement. Those effects jointly generate an increase in the outreach and financial perfor-mance of MFIs. Meanwhile, the negative impacts arise from the financial and reputation loss risks, staff performance decreases because of over capacity, product canibalization or exclusion of the poor because of the inappro-priate design that potentially exists when a new product is launched.
Rossel-Cambier (2010a), according to some studies, stated that combined microfinancing will support the achievement of economies of scope, the effectiveness of loan delivery and the decrease of transaction costs. It can also facili-tate joint-client registration, the access to infor-mation about clients (for example through more direct contact from a more frequent transaction or saving transaction record) and access to a wider market. However, the Rossel-Cambier‘s study stated that the provision of combined microfinancing may increase the complexity of the operation of MFIs when excess transactions happen. In addition, a study by Lensink et al. (2011) stated that the provision of multiple products by MFIs, which combined financial and non financial services (named microfinance
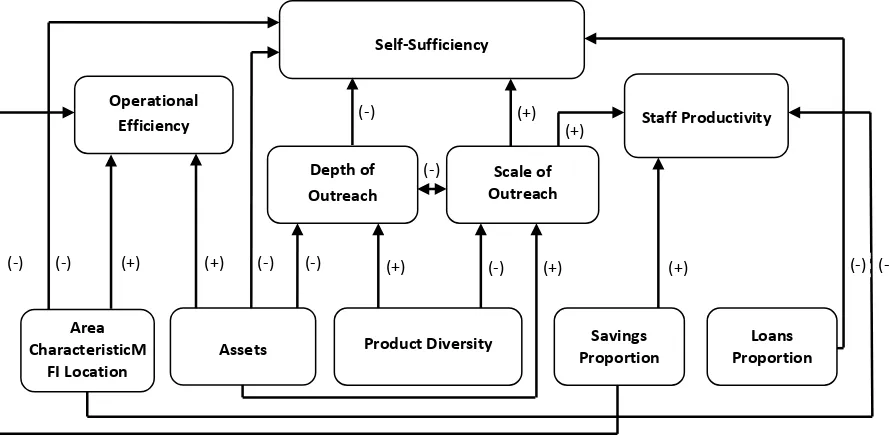
plus), was expected to: 1) solve multidimen-sional problems of poverty and be a tool to reach the poorest, 2) improve the human capital and loyalty of MFIs customers, 3) reduce the default risk hence the sustainability of MFIs and 4) build the comparative advantage of MFIs. But, microfinance plus can produce some unexpected impacts, such as: 1) higher operational costs, 2) an administrative burden, 3) poor quality or irrelevant services, 4) complex reporting and 5) low monitoring quality. The conceptual frame-work described above is illustrated in Figure 1 below.
Some empirical studies analyzed the rela-tionship between the diversity and performance of MFIs. Even so, there was no consensus regarding such a relationship. The study by Esho et al. (2005) indicated that an increase of the fee-based activity of CUs in Australia increased the financial risk and decreased the profitability of the observed CUs. The study by Goddard et al. (2008) found that the increase of fee-based activity in the operation of CUs in the United States was negatively related to the achievement of a risk-adjusted ROA of sampled CUs. The study by Barry & Tacneng (2009) found that MFIs which focused on loan delivery had a higher level of depth of outreach but a lower
Source: Rossel-Cambier (2010a, 2010b), Lensink et al. (2011), Frankiewicz & Churchil (2011), synthesized and figured by the authors.
Figure 1. Relationship between the product diversity and performance of MFIs Provision of more varied MFIs products
Positive effects
Fulfilment of client needs (inc. the poor) Increase of client satisfaction and loyalty Increase in saving-loan transaction quality
Increase in word of mouth marketing Increase in information about clients Diversification of sources and uses of funds
Diversification of risks Economies of scope advantages
Negative effects
Increase in complexity & staff responsibility Increase in monitoring problem Decrease in productivity & service quality
Product canibalization
Unmatched additional product(s) that exclude the poor
Financial and reputation loss risk in the introduction of additional product(s)
scale of outreach, financial performance and portfolio quality in comparison with MFIs that were not only focused on loan delivery. Barry &
Tacneng‘s study also indicated that MFIs that provide non loan-saving products, especially for education and health services, tended to have a higher scale of outreach, productivity and port-folio quality but this accompanied a lower self-sufficiency in comparison with the MFIs that did not provide education and health services. The study of Rossel-Cambier (2010a) found that the provision of combined microfinance was posi-tively related to the efficiency and productivity of MFIs, while the study by Rossel-Cambier (2010b) found that combined microfinance was positively related to the scale of outreach, but negatively related to the depth of outreach, of MFIs in Latin America and the Carribean. A case study conducted by Rossel-Cambier (2011) in Credit Union City of Bridgetown Barbados found that the introduction of new products restricted the access of poor clients as the attributes (procedures and costs) needed to access the new products did not match poor clients capacities. The study of Lensink, et al. (2011) which involved 290 rated MFIs in 61 countries indicated that MFIs which jointly pro-vide financial and non financial services, named microfinance plus, tended to have a higher level
of depth of outreach but a lower portfolio qual-ity. In addition, the provision of social services in the microfinance plus scheme tended to have negative effects on the financial performance of the sampled MFIs.
METHODOLOGY
Referring to Barry & Tacneng (2009), the authors built a model to test the relationship between the product diversity and performance of MFIs. The authors accomodated some addi-tional variables that could potentially influence the performance of the MFIs which were recommended by Arsyad (2005), Okumu (2007) and Nyamsogoro (2010). In general, the perfor-mance model used in this study can be written as:
̂
where
is the dependent variable that represents MFI performance; , ..., are the independent variables that represent some factorspotentially influencing the MFIs
‘
performance;
, ...,are the estimated
parameters for the independent variables
used in the regression model, and
̂ is the error term. Specifically, the model can bewritten as:
̂ … (Model 1)
̂ … (Model 2)
̂… (Model 3)
̂ … (Model 4)
Performance variables: 1) Scale of outreach (dummy of MFI active clients or DKLIEN); 2) depth of outreach (dummy of MFI loans dis-bursed per client or DRAPINJ) in which the big-ger the value of loans disbursed per client means a lower depth of outreach as the MFI then is fo-cused on relatively bigger scale (wealthier) loan clients; 3) staff productivity (dummy of loans disbursed per staff or DPROD), 4) operational efficiency (dummy of operational cost per aver-age asset based on periods or DRBO), 5) self-sufficiency (dummy of operational self-suffi-ciency or DOSS).
Product diversity variables: 1) The level of loans–savings product diversity (the number of loans–savings product types or SIMPIN); 2) the level of non loans–savings product diversity (the number of non loans–savings product types or
This study employed a binary logistic regres-sion method, a model regresregres-sion in which the dependent variable is a dichotomous variable. Following Goldberger, as cited in Maddala (1983), who suggested that the use of binomial or binary choice models could overcome the inefficient parameter estimation with ordinary least squares when the datasets were not nor-mally distributed, as in the case of the datasets available for this study. The binary regression method uses a discrete dependent variable and assumes that individuals are faced with a choice between two alternatives and that their choice depends on their characteristics. As all perfor-mance indicators in our datasets were continous variables, we converted them into dichotomous variables by dividing the value of each perfor-mance indicator (for example: the number of clients) into two: the one with a value above the average value of population or relatively high was coded as ‗1‘, and the one with a value below
or exactly same as the average value of popula-tion or relatively low was coded as ‗0‘.
There are some limitations that should be considered related to the models used in this study. First, the models used in this study may have suffered from an endogeinity problem. Regarding the endogeinity issue in an econome-tric model, according to Wooldridge (2012), an econometric model suffers from endogeinity
problems if at least one of the ―explanatory variables‖ is endogenous or jointly determined
with the dependent variable (In other words, the assumption of a zero covariance is violated). This problem may arise as a consequence of the exclusion of explanatory variable(s) from the models, called omitted variable(s). In our model formation, we excluded a variable, named insti-tutions. Institutions are a set of formal and informal rules and also its enforcement mechan-ism that determines individual and organiza-tional behavior (Burky & Perry, 1998). In the context of the MFIs operation, it is actualized in: 1) government or MFIs‘ regulations (formal rules) and 2) social conventions, culture, social norms, and ethics (informal rules) which are involved in the MFIs operations (Kusumajati, 2012). Based on our observations of the sampled MFIs used in our study, institutions were re-flected in the formal rules (governor‘s decrees, various government documents, supervisor guid-ance, written organizational policy and conven-tion, various kinds of standard operating proce-dures, planning documents), informal rules (organizational culture and ethics, client culture), enforcement mechanisms (reporting and moni-toring procedures/techniques, incentives and sanction mechanisms) adopted by each sampled MFI.
Some prominent Indonesian empirical mi-crofinance studies that focused on the effects of institutions on MFIs‘ performance in Indonesia confirmed that institutions significantly influ-ence MFIs‘ performance.4 Even so, it was
4
cult for us to find any quantitave proxy that was considered appropiate to represent the institu-tions variable. Initially, we considered the type of MFIs to be used in this study as the proxy of institutions. Unfortunately, our field observa-tions found that the institutional features of each MFI did not provide clear−cut evidence. In this case, similar types of MFIs (for example within CUs) did not always have the same features of institutions and achieve institutional perfor-mance, while the different types of sampled MFIs (for example between CUs and BUKPs) did not always have different features of institu-tions or achieve institutional performance. Thus, we cannot hypothesize that the type of MFIs reflect the type of institutions. Finally, as we could not find an alternative proxy for institu-tions, we dropped the institutions variable from our quantitave models. Furthermore, our field observations recognized that institutions tended to be correlated with an MFI‘s size, age, opera-tional area, loan proportion, and saving propor-tion. Specifically, the relatively large, old, urban–based MFIs in our sample tended to have better formal institutions and enforcement, while the smaller, younger, and rural–based MFIs tended to have poorer formal institutions and enforcement. In addition the rural–based MFIs we sampled tended to have better informal rules and enforcement in comparison to the urban– based ones. This evidence means that a correla-tion does exist between the institucorrela-tions variable (which was omitted from the models used in this study) and some explanatory variables (MFI size, age, and operational area). Thus, it poten-tially leads to endogeinity problems as the explanatory variables correlated with the omitted variable.
The second limitation of this study was the exclusion of macroeconomic variables in the models used. It was because there was no clear operation areas of the sampled MFIs. In this case, some sampled MFIs operated in villages or
interaction between formal and informal rules, and also the enforcement of formal and informal rules influenced Village Credit Institutions in Bali. A study by Kusumajati (2012) confirmed that formal rules and informal rules significantly affected the performance of Credit Unions in Indonesia.
at the sub-district level where macroeconomic data was not available. Morever, some sampled MFIs operated in some dispersed sub-districts with different macroeconomic characteristics. In short, it would need an abundance of resources to provide convenient macroeconomic data for each MFI‘s operational area. The third limitation was the use of logistic probability models. This study utilized a binary logistic model. This model predicts less strongly the direct quantita-tive effect of independent variables in affecting performance as its dependent variables are binary choices.
DATA AND ANALYSIS
This research used quantitative and qualita-tive data for the analysis. The quantiqualita-tive data were cross section data sourced from the annual operational performance statistical reports of each sampled MFI (CU and BUKP), while the qualitative one was gathered from a direct inter-view with each CU respondent (CU Manager and Head of the Office of each BUKPs), and the Manager of the Coordinating Body of the CUs pling process as explained in Figure 2.
Later, table 2 explains the basic
descrip-tive statistics of the variables used in this
study.
Regarding the five models proposed for the analysis, the results of the Omnibus test, Hosmer–Lomeshow test, classification table & Cox-Snell R2 and Nagelkerke R2, there was sufficient statistical evidence to conclude that all five models were acceptable to explain the relationship between the product diversity and performance of the sampled MFIs (see table 3). From the statistical results, we found that the five models tended to pass all of the tolerance
Note: The total number of 36 CUs in the sampling process was the number of CU recommended by the Credit Union Coordinating Body of Yogyakarta. According to the monitoring staff of the body, among the 44 CUs in its database, there are 6 CUs which are in dispute (for 2 or 3 periods they have not reported their performance or are operationally inactive) and 2 CUs located outside Yogyakarta province. Thus, these 8 CUs were not recommended for this research. After consideration, this study excluded these 8 CUs from the CU sample basis.
Sources: Figured by the authors
Figure 2. Sampling process
Table 2. Descriptive statistics of variables used in this study
Indicator N Minimum
value
Maximum
value Average
Standard deviation
KLIEN (people) 50 156.00 2205.00 601.80 369.27
RAPINJ (million Rp.) 50 1.03 17.68 5.44 2.76
PROD (million Rp./staff) 50 114.94 1553.60 566.17 315.98
RBO (%) 50 2.97 18.62 9.79 3.08
OSS (%) 50 94.19 222.90 136.20 23.32
SIMPIN (product type) 50 3.00 13.00 5.28 2.38
NONSIMPIN (product type) 50 0.00 5.00 1.66 1.47
ASET (billion Rp.) 50 1.54 11.71 3.25 1.90
USIA (years) 50 2.00 31.00 17.26 6.53
SHRPINJ (%) 50 43.95 92.88 71.97 12.20
SHRSIMP (%) 50 12.27 95.52 63.43 16.18
DWIL (urban-1 / rural-0) 50 0.00 1.00 0.56 0.50
Sources: Primary data from sample units of CU and BUKP, processed by the authors
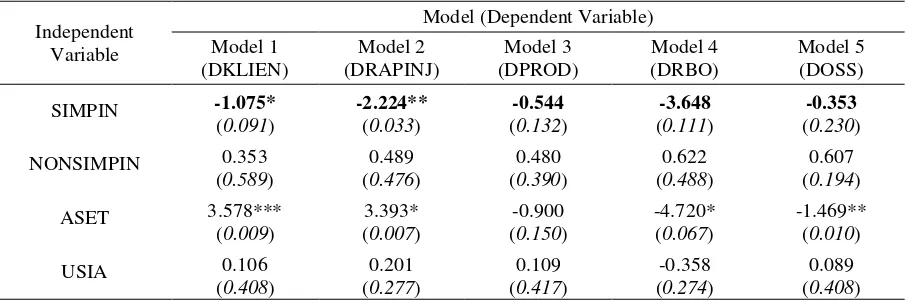
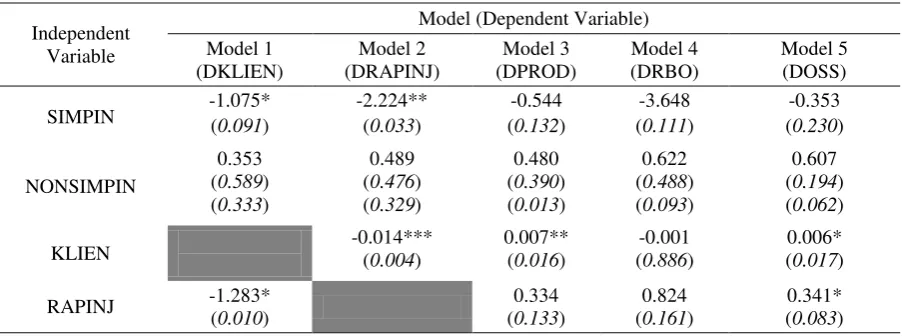
Table 3. The result of logistic regression
Independent Variable
Model (Dependent Variable) Model 1
(DKLIEN)
Model 2 (DRAPINJ)
Model 3 (DPROD)
Model 4 (DRBO)
Model 5 (DOSS)
SIMPIN -1.075* -2.224** -0.544 -3.648 -0.353
(0.091) (0.033) (0.132) (0.111) (0.230)
NONSIMPIN 0.353 0.489 0.480 0.622 0.607
(0.589) (0.476) (0.390) (0.488) (0.194)
ASET 3.578*** 3.393* -0.900 -4.720* -1.469**
(0.009) (0.007) (0.150) (0.067) (0.010)
USIA 0.106 0.201 0.109 -0.358 0.089
(0.408) (0.277) (0.417) (0.274) (0.408)
STEP 1: Data Inventory
STEP 2: Defining Sampled MFIs
Quota
STEP 3: Defining sampled
CUs & BUKPs
Identifying total CUs & BUKPs operating in Yogyakarta Special Province (based on the database of the Coordinating Body of CU and BUKP)
Defining the total number of MFIs used in analysis based on Bartlet et al. (2001), minimum of 5 times the independent
variables, & proportionality rule
Defining the sampled CUs and BUKP based on their scale
(scale of its main product, savings & loan)
36 units of CU 75 units of BUKP
Minimum N = 5 X 9 = 45 (We used 50 unit sample) CU=(36/111)*50=16 units BUKP=(75/111)*50=34 units
16 CUs and 34 BUKPs with the highest sum value of
Table 3. The result of logistic regression (continued)
1) *, **, *** means that the null hypothesis is rejected at the significance error (α) of 10%, 5%, and 1%. This study allows a significance error up to 10% to minimize the risk of rejecting the true alternative hypothesis because this study is a social research involving peoples‘ behavior and institution effects that potentially limit the sensitivity of proxies used in the quantitative analysis.
2) Omnibus value, H-L value, and classification table value indicate the fitness of the model, while Cox & Snell R2 and
Nagalgerke R2 indicate the relationship intensity between overall independent variables and the dependent variable. This study set the tolerance value at 5% for the first two test, 70% for the third test, and 30% (moderate) for the fourth fitness model test.
3) Number in brackets is the p-value.
Sources: Primary data from sample units of CU and BUKP, processed by the authors
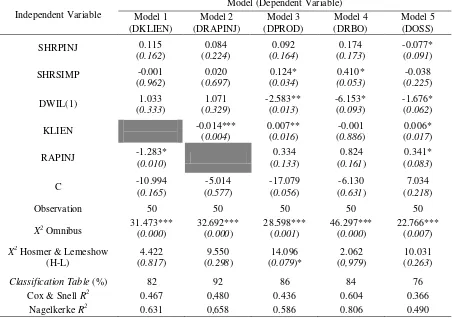
The following part of this section analyzes the relationship between the product diversity and the performance of the sampled MFIs. This study classified the analysis into two parts, one related to product diversity in terms of loans-savings (in which loans and loans-savings are the main products of the sampled CUs and BUKPs) and the other related to the product diversity in terms of non loans-savings products. Figure 3 below summarizes the relationship between the variables used in the analysis in this study.
Regarding the relationship between saving– loan product diversity and performance, the
re-sult of the regression indicated a significant direct relationship between the level of saving– loan product diversity and outreach performance indicators, both of scale and depth of outreach. Statistical analysis indicated that additional types of saving–loan products provided by the sam-pled MFIs decreased the probability of the MFIs achieving a higher-level number of loan clients
(higher−level scale of outreach) and increased
However, the relationship between saving–loan product diversity and other performance aspects such as staff productivity, operational efficiency and operating self-sufficiency was not statisti-cally significant, as indicated by the p-value of SIMPIN which was higher than 10 % in models 3, 4 and 5 (see table 4). Furthermore, the regres-sion results do not find any statistically signifi-cant relationship between the level of non saving–loan product diversity and all five performance indicators used in this study (see table 4).
The direct negative relationship between the level of saving–loan product diversity and scale
of outreach (the number of loan clients) predicts that the MFIs with more varied saving–loan product types tend to have a smaller probability of reaching a higher number of loan clients. Probably, this happened because the MFIs with more diversed saving–loan products were chal-lenged by having more complex operations (e.g. product administration, infrastructure provision, promotion and reporting). This reduced the resources, especially time and effort, that could
be allocated by the MFI‘s staff to find and
process potential clients. Thus, the more diversi-fied the product was, the MFIs tended to have a lower number of clients.
Sources: Figured by the authors
Figure 3. The relationship between variables in the models based on the results of logistic regression analysis
Table 4. The result of logistic regression (product diversification variables)
Independent Variable
Model (Dependent Variable) Model 1
(DKLIEN)
Model 2 (DRAPINJ)
Model 3 (DPROD)
Model 4 (DRBO)
Model 5 (DOSS) SIMPIN -1.075* (0.091) -2.224** (0.033) (-0.544 0.132) (-3.648 0.111) (-0.353 0.230)
NONSIMPIN 0.353 0.489 0.480 0.622 0.607
(0.589) (0.476) (0.390) (0.488) (0.194)
Note: *, **, *** means that the null hypothesis is rejected at the significance error (α) of 10%, 5%, and 1%. Sources: Primary data from sample units of CU and BUKP, processed by the authors
Depth of Outreach
Scale of Outreach
Staff Productivity Operational
Efficiency
Self-Sufficiency
Assets Proportion Savings Proportion Loans
Area CharacteristicM
FI Location
Product Diversity
(-) (+)
(+)
(-)
(+) (-) (-) (+) (+) (-)
Meanwhile, the direct negative relationship wealthy clients) and/or attract more clients looking for small size loans who would deal with the MFIs.5
The result of the regression also suggested the existence of an indirect negative relationship between the level of saving–loan product diver-sity and two financial performance indicators, especially staff productivity and operational self-sufficiency. Regarding the indirect negative relationship between the level of saving–loan product diversity and staff productivity (the value of loans disbursed per staff), the relation-ship was mediated by the scale of outreach (the number of loan clients). Related to the result, in
5 Average loan size or average outstanding loan per client can be used as the proxy of depth of outreach (see Ledgerwood, 1999:225; Martowijoyo, 2001:128,159; Weiss & Montgomerry, 2005:43; UNCDF, 2006:2). The wealthier clients are not interested in smaller loans (UNCDF, 2006). In addition, the wealthier clients tend to have a greater probability of accessing larger loans as they have greater assets and the capacity to provide conventional collateral in comparison with less wealthy clients.
the previous discussion, the analysis predicted the existence of a negative relationship between the level of saving–loan product diversity and the number of clients. In addition, the regression results also indicated a positive relationship between the number of clients and staff produc-tivity. According to the statistical result, there is a positive coefficient of KLIEN and a p-value lower than 5% in model 3 (see table 5). It means that the decrease of the number of clients tended to decrease the probability of the sampled MFIs achieving a higher level of staff productivity in generating loans. The result meant that a higher level of saving–loan product diversity tended to be followed by a decrease in the probability of achieving a higher number of clients and, in the longer term, the probability of achieving a higher-level of staff productivity to generate loans.
Regarding the indirect negative relationship between the level of saving–loan product diver-sity and self-sufficiency (operational self-suffi-ciency), this relationship was mediated by the scale of outreach (the number of loan clients) and the depth of outreach (indicated by the value of loans disbursed per client). The previous dis-cussion explained the existence of a negative relationship between the level of saving–loan product diversity and the number of loan clients and also the value of loans disbursed per client. In addition, the regression analysis also indicated a statistically significant and positive relation-Table 5. The result of logistic regression (product diversity and outreach variables)
Independent
Note: *, **, *** means that the null hypothesis is rejected at the significance error (α) of 10%, 5%, and 1%.
ship between the number of clients as well as the average loans disbursed and operational self-sufficiency, indicated by a positive coefficient of KLIEN and a p-value lower than 5% in Model 5 (see table 5). It means that the negative relation-ship between the level of saving–loan product diversity and the number of loan clients and the value of loans disbursed per client, in the longer term, tends to lead to a lower probability of the MFIs achieving self-sufficiency.
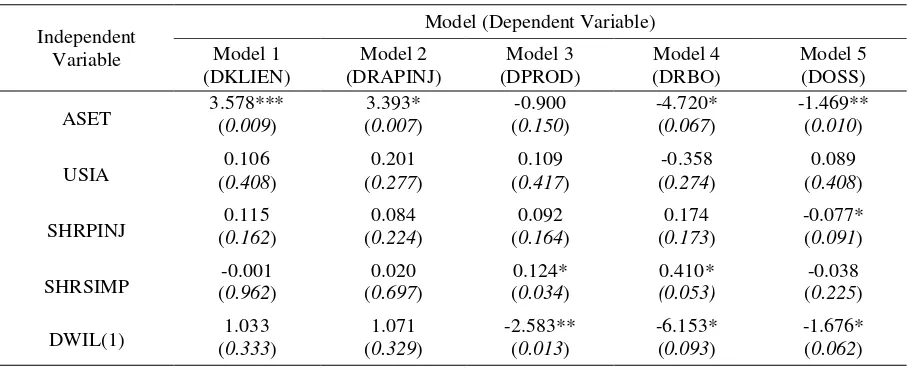
The result of the logistic regression also in-dicated a direct relationship between some con-trol variables (especially assets, proportion of loans outstanding, proportion of savings, the operational area of MFI unit) and some indica-tors of performance.
Assets, as the proxy of MFI size, tend to have a direct relationship with almost all of the performance indicators, especially a positive relationship with the scale of outreach and oper-ational efficiency and a negative relationship with the depth of outreach and operational self-sufficiency. It indicates that, although the bigger sized MFIs tend to have a higher probabilty of being efficient and reach more clients than the smaller sized MFIs, they have a higher probabil-ity of focusing on wealthier clients (lower depth of outreach) and achieve lower-levels of self-sufficiency because of their inability to minimize production costs. This was indicated by each ASET coefficient value sign and their p-value
being lower than 10 5 (see Table 6, especially ASET in model 1, 2, 4,and 5).
Loans proportion, as the proxy of the re-sources allocation to the most important produc-tive investment of the MFIs, tended to have a direct negative relationship with operational self-sufficiency (as indicated by a negative coeffi-cient and a 9.1% p-value of SHRPINJ in model 5). It means that the increase of loans proportion tends to increase the probability of the sampled MFIs achieving a lower self-sufficiency. This evidence indicates that, practically, too much investment in loan assets is not always good for the sampled MFIs because it is probably posi-tively correlated with the problem of over ca-pacity, potential default, and higher operational costs. Thus, it seems a necessity for the sampled MFIs to consider a moderate loan investment in their operations.
Savings proportion had a positive relation-ship with the probability of the sampled MFIs achieving staff productivity and a negative rela-tionship with the probability of the sampled MFIs achieving higher-levels of operational effi-ciency. The statistical analysis showed that an increased saving proportion tended to increase the probability of the sampled MFIs achieving a higher staff productivity to generate loans (indi-cated by a positive coefficient of SHRSIMP in model 3 and a p-value lower than 5%). The rea-sons behind this evidence are probably: 1)
Table 6. The result of logistic regression (other independent variables)
Independent Variable
Model (Dependent Variable) Model 1
(DKLIEN)
Model 2 (DRAPINJ)
Model 3 (DPROD)
Model 4 (DRBO)
Model 5 (DOSS) ASET 3.578*** (0.009) (3.393* 0.007) (-0.900 0.150) -4.720* (0.067) -1.469** (0.010)
USIA (0.106 0.408) (0.2770.201 ) (0.109 0.417) (-0.358 0.274) (0.089 0.408)
SHRPINJ (0.115 0.162) (0.2240.084 ) (0.092 0.164) (0.174 0.173) -0.077* (0.091)
SHRSIMP (-0.001 0.962) (0.020 0.697) (0.124* 0.034) (0.053) 0.410* (-0.038 0.225)
DWIL(1) (1.033 0.333) (0.3291.071 ) -2.583** (0.013) -6.153* (0.093) -1.676* (0.062)
savings products may facilitate the MFIs to access the information about loan applicants (including their character), 2) savings products may provide collateral substitution for loan applicants who do not have enough conventional collateral (land certificates or vehicle ownership documents), and 3) savings products tend to increase the source of money to be lent by the MFIs. However, in the case of the sampled MFIs, the results of the regression showed a positive coefficient of SHRSIMP in model 4 and a p-value lower than 10%. It meant that an increase in the savings proportion tended to decrease the probability of the sampled MFIs achieving lower operational costs (higher efficiency). There is a tendency that a higher proportion of savings tends to increase the cost of operating which is translated into a decrease in efficiency (see table 6 above).
The result of the regression also confirmed that the MFIs located in urban areas had a higher probability of accessing lower operational costs and of being more efficient than the ones located in rural areas. This was reflected by the negative coefficient (-6.153) and significant p-value (9,3%) of variable DWIL in model 4 (see Table 6). Even so, the MFIs located in urban areas tend to have a lower probability of achieving a higher-level of staff productivity in generating loans and a higher-level of sufficiency than the ones located in rural areas. This was reflected by the negative coefficient (-2.583 and -1.676) and significant p-value (1,3% and 6,2%) of variable DWIL in model 3 and model 5 (see Table 6). It seems that MFIs in urban areas tend to meet higher levels of competition which reduces their productivity and ability to generate higher prof-its in comparison with MFIs located in rural areas. It translates into the lower self-sufficiency achieved by urban MFIs.
CONCLUSION AND RECOMMENDATION The purpose of the research was to identify whether the relationship between productivity and performance existed in the operation of the CUs and BUKPs in Yogyakarta Special Prov-ince. The analysis confirmed a significant direct relationship between the levels of saving–loan
product diversity and outreach performance indicators, both for scale and depth of outreach. However, that was not the case for the other performance aspects such as staff productivity, operational efficiency and operating self-suffi-ciency. In addition, the analysis also indicated indirect negative relationships between the levels of saving–loan product diversity and staff prod-uctivity to generate loans and self-sufficiency. However, the analysis does not confirm a sig-nificant relationship between the level of non saving–loan product diversity and all five per-formance indicators.
Based on the analysis, we recommend a di-versification strategy which can be applied in the operations of the sampled MFIs. For the MFIs their performance. Meanwhile, for the MFIs that focus on serving the low income and low-scale transaction clients,and have some degree of to-lerance in achieving a superior financial perfor-mance, providing more varied saving–loan areas, 2) the absence of dynamic analysis, 3) the use of imperfect indicators as this study only used a single indicator for each variable used in the model, 4) the absence of performance indi-cators based on clients and 5) the measurement of the level of product diversity that did not con-sider the transaction volume of each product. In addition, it would benefit further related research if it would accomodate a quantitative endogein-ity analysis and include the institutions variable in the model(s) used.
REFERENCES
institutions of Gianyar, Bali, Indonesia. Unpublished PhD Thesis, Flinders Univer-sity, Adelaide.
Barry, T. & R. Tacneng, 2009. Governance, performance and diversification: Evidence from African microfinance institutions. Paper presented at Southwestern Finance Association 2010 Annual Meeting: Corpo-rate Governance. Retrieved from http:// southwesternfinance.org/conf-2010/F3-3.pdf on July 19, 2012.
Bartlett, James E., Joe W. Kotrlik, & Chadwick C. Higgins, 2001. ―Organizational research: Determining appropriate sample size in sur-vey research‖. Information Technology, Learning, and Performance Journal, 19(1):43–50.
Burky, S.J. & G.E. Perry, 1998. Beyond the Washington Consensus: Institution Matter. Washington, D.C., USA: The World Bank.
Esho, Neil, Paul Kofman, & Ian G. Sharpe, 2005. ―Diversification, Fee Income and Credit Union Risk‖. Journal of Financial Services Research, 27(3): 259–281.
Frankiewicz, Cheryl & Craig Churchill, 2011. Making Microfinance Work: Managing Product Diversification. Turin, Italy: Inter-national Training Centre of The ILO.
Goddard, John, Donal McKillop, & John O.S. Wilson, 2008. ―The diversification and financial performance of US credit unions‖. Journal of Banking and Finance, 32: 1836– 1849 (doi:10.1016/j.jbankfin.2007.12.015).
Kusumajati, Titus Odong, 2012. Faktor ekonomi dan kelembagaan dalam keberlanjutan cre-dit union di Indonesia. Unpublished PhD Thesis, Gadjah Mada University, Yogya-karta.
Ledgerwood, Joanna, 1999. Microfinance Hand-book: An Institutional and Financial Pers-pective. Washington, D.C., USA: The World Bank.
Lensink, Robert, Roy Mersland, & Vu Thi Hong Nhung, 2011. Should microfinance institu-tions specialize in financial services? Paper presented at 4th International Research Workshop on Microfinance, November 24-25, 2011. Retrieved from http://www.rug.
nl/research/globalisation-studies-groningen/research/conferencesandseminars /conferences/eumicrofinconf2011/papers/10
b.lensink-mersland-vu.doc on August 18, 2012.
Maddala, G. S., 1983. Limited-dependent and Qualitative Variables in Econometrics. Cambridge: Cambridge University Press.
Martowijoyo, Sumantoro, 2001. Dampak pem-berlakuan sistem bank perkreditan rakyat terhadap kinerja lembaga keuangan pede-saan. Unpublished PhD Thesis, Gadjah Mada University, Yogyakarta.
Nyamsogoro, Ganka Daniel, 2010. Financial sustainability of rural microfinance institu-tions (MFIs) in Tanzania. Unpublished PhD Thesis, University of Greenwich, Green-wich. Retrieved from http://core.ac.uk/ download/pdf/316086.pdf on July 19, 2012.
Okumu, Luka Jovita, 2007. The microfinance industry in Uganda: Sustainability, out-reach and regulation. Unpublished PhD Thesis, University of Stellenbosch, Stellen-bosch. Retrieved from http://scholar. sun.ac.za/bitstream/handle/10019.1/1091/O Champion to Support Financial Inclusion (SEADI Discussion Paper No. 5). Retrieved from Support for Economic Analysis Development in Indonesia Project website http://www.seadiproject.com/0_repository/S
EADI-13-R113%20Optimal%20Bank%20Network%2 0for%20Inclusiveness(1).pdf on November 8, 2014.
Rossel-Cambier, Koen, 2008. Combined micro-finance: Selected research questions from a stakeholder point of view (CEB Working Paper No 08/004). Retrieved from http:// www.microfinancegateway.org/sites/default /files/mfg-en-paper-combined-micro- finance-selected-research-questions-from-a-stakeholder-point-of-view-2008.pdf on March 28, 2013.
Rossel-Cambier, Koen, 2010a. Can combining credit with insurance or savings enhance the sustainability of microfinance institutions? (CEB Working Paper No. 10/057). Retrieved from https://dipot.ulb.ac.be/ dspace/bitstream/2013/70367/1/wp10057.pd f\ on March 28, 2013.
Rossel-Cambier, Koen, 2010b. Do multiple fi-nancial services enhance the poverty out-reach of microfinance institutions? (CEB Working Paper No. 10/058). Retrieved from www.rug.nl/research/events/workshopmicro
finance2010/pdfmicro/rossel-cambier.pdf on March 28, 2013.
Rossel-Cambier, Koen, 2011. Understanding the dynamics of product diversification on mi-crofinance performance outcomes: A case study in Barbados (CEB Working Paper No. 11/008). Retrieved from https://dipot.ulb. ac.be:8443/dspace/bitstream/2013/78912/1/ wp11008.pdf on March 28, 2013.
The United Nations Capital Development
Fund−UNCDF, 2006. Core performance indicators for microfinance. Retrieved from http://www.uncdf.org/en/node/2169 on July 19, 2012.
APPENDIX
The General Description of Sampled MFIs Products
The CUs and BUKPs observed in this study provide savings, loans and non saving-loan products. From our observations, generally we found that most of the CUs had a greater variety of products in comparison with the BUKPs. The process of product development between the CUs and BUKPs also differs. The products offered by each CU were determined by the management and board of directors (Pengurus) based on the approval of the annual members‘ meeting (Rapat Anggota Tahunan). Meanwhile, the products offered by each BUKP were determined by the Provincial Government through a Governor‘s decree. However, some BUKPs developed additional products which were not covered by the decree. Another difference between the CUs and BUKPs was the clients who could access the products. A CU only serves its members, while BUKPs serve anybody who wants to do business with them. In the next part, we will give a general description of their products.
The savings products provided by CUs can be grouped into five categories, which are: 1) demand deposits (Simpanan Bunga Harian), in which clients can save or withdraw their money anytime, 2) time deposits (Simpanan Sukarela Berjangka), in which clients can withdraw their money according to a maturity period, generally 1−12 months, 3) education savings (Simpanan Pendidikan) in which clients can withdraw their money according to their schooling period (for example: after the savers reach higher levels of education, or a certain educational level) and the maturity period ranges from
1−5 years, 4) pension savings (Simpanan hari Tua/Masa Depan), in which the savers can withdraw their money after reaching a certain age (generally about 50 years old)6, 5) capitalization savings (Simpanan kapitalisasi) which are provided to clients who want to build their assets, even if they do not have money to save (in this case the CU lends money to the member, at ‗x‘ % loan interest rate, then the member must save all the loaned money in capitalization savings with a more than ‗x‘ % interest rate) and 6) savings schemes that are not included in the five schemes above, such as land and building investment savings, special religion day savings and community savings. The saving interest rates offered by each sampled CU varied. They ranged between 2−10% for the demand deposits, 4−15% for the time deposits, 4−11.6% for educational savings and 8−14% percent for pension savings. Meanwhile, savings products provided by BUKP were limited to demand deposits (Simassa) which gave 4−6% interest rate and time deposits (deposito) which had a 8−12% interest rate. But, some BUKPs provided other saving schemes, such as rotating association savings (tabungan arisan), educational savings and childrens‘ savings schemes.
Regarding the loan products, the sampled CUs provided a wide array of loans. These can be classified into 5 main categories: 1) business loans, a loan to finance productive purposes, 2) consumption loans, a loan to finance consumption products purchases, such as vehicles, electronic equipment, houses and buildings (and their material or equipment), education and daily consumption product purchases, 3) capitalization loans, a loan to build the member‘s own assets, in which the borrower receives a loan from the CU and all of it is saved in a CU savings product, especially capitalization savings, 4) emergency loans, a loan to finance an urgent need (such as land / house / vehicle brokerage capital, marriage funding or medical treatment) and which will be paid back in a relatively short-term period and 5) other loans that are not included in the 4 loan classifications above (such as a partnership loan, a loan given to another financial institution to finance their business, or community loans, a loan given to a grassroots community to finance their business. The loan interest
6
rate provided by the sampled CU varied, ranging from 10.8 to 48% annually. Business and consumption loans were offered by most of the sampled CUs with the rate being between 15 to 24% annually. Meanwhile, emergency loans tended to be the most expensive loans from a CU (excepting emergency loans for medical treatment) with interest rates being above 24% annually. Education loans and capitalization loans tended to be the cheaper loans with interest rates below 15%. Regarding the loan products of the BUKPs, most of the sampled BUKPs offered the same products. They were common loans, a loan given for both productive or consumption purposes, and incidental loans, a loan to fund any emergency needs. BUKPs charged interest rates of 18−30% anually for common loans and
30−36% anually for incidental loans.