See important disclosures at the end of this report Powered by Enhanced Datasystems’ EFATM Platform
Lippo Cikarang Tbk PT
(LPCK IJ)
Buy
Property - Real Estate
Target Price:
IDR13,400
Market Cap: USD711m
Price:
IDR10,000
LPCK, which owns a compact township with a robust industrial sector, is set to see an earnings CAGR of 31% for FY12F-FY15F. Strong industrial growth – with light industry companies serving as a proxy to Indonesia’s robust investment growth – coupled with its better public facilities and upcoming toll road access, should ensure the company’s sustainability and boost its future growth. We initiate coverage on the stock with a BUY at a IDR13,400 TP, which is a 30% discount to the
company’s NAV, implying 15.7-13.0x P/Es for FY13F-FY14F.
Robust investment climate. Lippo Cikarang (LPCK)’s industrial land sales expanded by 70% CAGR from FY08-FY12, as Indonesia’s huge market potential continued to attract foreign investors. More than 700 prominent companies have already occupied the estate, and the number is likely to rise further after the company indicated more than 1,000 ha of industrial land are up for grabs. To date, it has received around 10 inquiries in the pipeline of around 20ha-30ha each.
Preferred township over peers. The robust industrial growth has fuelled demand for residential and commercial properties. Residential value has surged by four-fold since FY10, from IDR1.1m/sq m to IDR4.5m/sq m currently. LPCK’s completed facilities – comprising15 schools including an international school, several hotels, a mall, a hospital and a waterpark, all surrounding light industry factories – coupled with its upcoming toll road access, should make this township more preferable over its peers.
Solid balance sheet with zero debt. The fact that the company willfocus on selling more residential and commercial properties once the KM34+7 new toll gate is awarded will keep its gross margin high above 60% over the next three years. Our margin conviction is based on: i) another 20%-30% increase in residential and commercial average selling prices (ASPs) post-opening of the new toll access, and ii) higher gross margin of around 75% for residential and commercial land compared with industrial land’s 63%. Hence, we expect the company to maintain its
Price Close Relative to Jakarta Composite Index (RHS)
5
52-wk Price low/high (IDR) 2,775 - 10,000
Free float (%) 58
Forecasts and Valuations Dec-10 Dec-11 Dec-12 Dec-13F Dec-14F
Total turnover (IDRbn) 405 902 1,013 1,212 1,350
Recurring net profit (IDRbn) 65 258 407 595 719
Net profit growth (%) 154.3 294.6 58.0 46.1 20.8
EPS (IDR) 94 370 585 855 1,033
Return on average assets (%) 4.1 13.9 16.7 19.3 19.0
Return on average equity (%) 12.3 37.2 39.7 39.0 32.9
P/E (x) 107 27 17 12 10
P/B (x) 12.3 8.5 5.7 3.8 2.7
Net debt to equity (%) (10.8) 12.5 (25.3) (38.9) (53.0)
See important disclosures at the end of this report 2
A Complete And Sustainable Township
The beneficiary of rising FDI
Indonesia has been on a roll since the 1998 financial crisis. It joined the group of 20 large economies in 2009 and won the first investment-grade credit rating in more than a decade in late 2011 and early 2012. Its gross domestic product expanded at a steady rate of more than 6% over the last three years.
The Indonesian Government has attempted to adopt more pro-investment policies, such as: (i) strengthening its Investment Coordinating Board to reduce red tape and create a one-stop shop for investors, (ii) offering numerous tax and other incentives, (iii) passing a new land bill to ease land acquisitions for infrastructure development, and (iv) relaxing some restrictions on foreign investment in certain sectors. As of given their good infrastructure and closeness to densely-populated Jakarta. Despite a continued rise in land prices, some buyers are willing to buy raw land at ready-to-use prices to take positions in anticipation of further price hikes.
Figure 1: Indonesia’s GDP has expanded steadily at more than 6% over the last three years (%)
Figure 2: Foreign investment grew at 27% CAGR in 2006-2012 due to growing opportunities in the region
2006 2007 2008 2009 2010 2011 2012 1Q13
in USD m
Source: Indonesia statistical bereau Source: CEIC
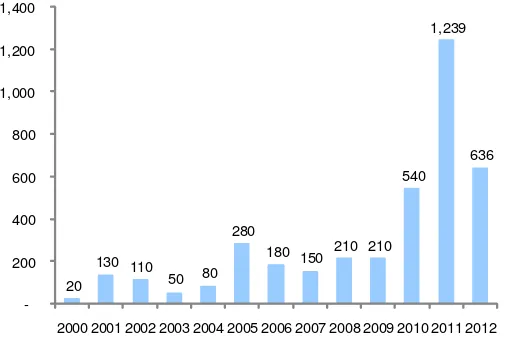
Figure 3: Indonesia’s robust industrial land sales over the last three years
Figure 4: Increases in industrial land prices by region
20
2000 2001 2002 2003 2004 2005 2006 2007 2008 2009 2010 2011 2012
Source: Colliers International Indonesia-Research Source: Colliers International Indonesia-Research
“Indonesia is the least-unattractive country inthe world. Even though they have to deal with the problems of bureaucracy and
See important disclosures at the end of this report 3 A preferred township
LPCK is 54%-owned by Lippo Karawaci (LPKR, BUY, TP 1,300), the largest-listed property company by market capitalization. Riding on Indonesia’s robust macro- environment, LPKR’s total pre-sales in FY12 surged 47% y-o-y to IDR4.6trn, of which 66%, or approximately IDR3.1trn, came from its township and micro-suburb development projects. The latter posted a 63% CAGR from FY10-FY12, with almost 70% of the sales coming from LPCK projects.
Figure 5: Lippo Karawaci's marketing sales mainly comprise township development projects
Figure 6: Almost 70% of the township's pre-sales come from LPCK
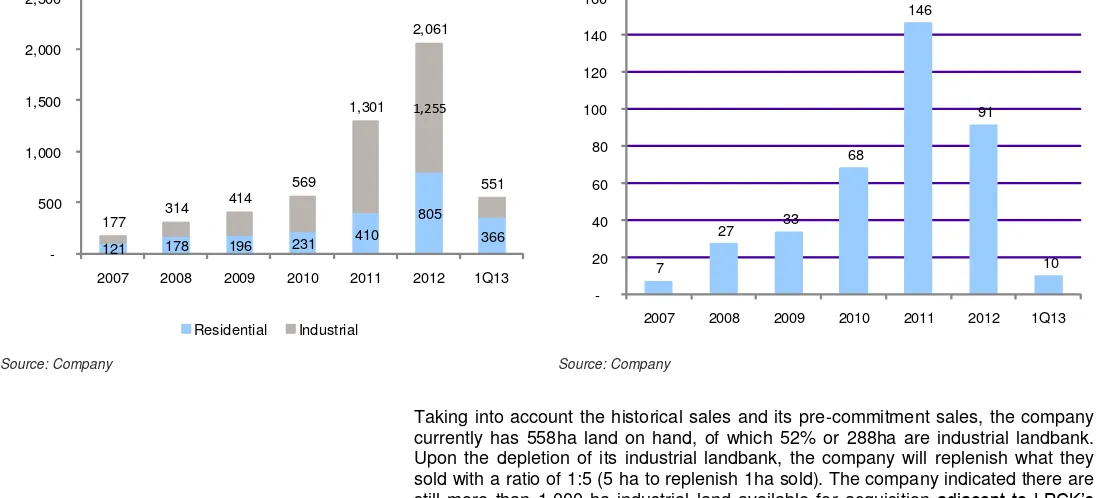
599 680 921 1,159 62% CAGR from FY10-FY12, driven by strong sales in its industrial division. During the period, the company managed to sell approximately 305.6ha of industrial land, as land prices tripled to IDR1.75m/sq m from IDR500K/sq m in 2010. This prompted the company to post a 70% CAGR in industrial pre-sales from FY10-FY12.
Figure 7: LPCK's marketing sales from 2007 to 1Q13 Figure 8: LPCK's industrial land sales (ha)
121 178 196 231 410
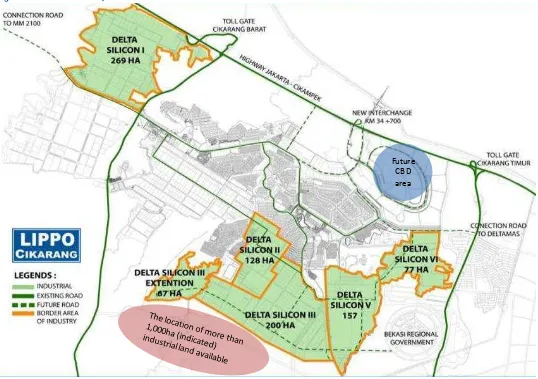
Taking into account the historical sales and its pre-commitment sales, the company currently has 558ha land on hand, of which 52% or 288ha are industrial landbank. Upon the depletion of its industrial landbank, the company will replenish what they sold with a ratio of 1:5 (5 ha to replenish 1ha sold). The company indicated there are still more than 1,000 ha industrial land available for acquisition adjacent to LPCK’s current industrial site. While the acquisition cost is no longer cheap at around IDR200k-IDR300k/sq m and may reach IDR500k/sq m, the company is able to sell the land at IDR1.75m/sq m. With the upcoming new toll access, we believe prices should rise further.
More than 60% of LPKR township’s pre-salesfrom FY10-FY12 came from LPCK.
See important disclosures at the end of this report 4 We support the company’s strategy to replenish its landbank, based on what they are selling, given: (i) its expectation of additional industrial landbank supply from the Karawang area, (ii) its efforts to keep cash flow unrestrained. We expect the company to record industrial pre-sales of IDR876bn in FY13f, assuming 50ha land is sold at an ASP of IDR1.75/sq m. As industrial land takes about one year at the most to be handed over and LPCK has backlogged revenue from industrial properties of IDR1trn, our blended revenue forecast of IDR1.2trn for FY13 should be achievable.
Figure 9: LPCK's industrial park
Future CBD area
Source: Company, RHB estimates
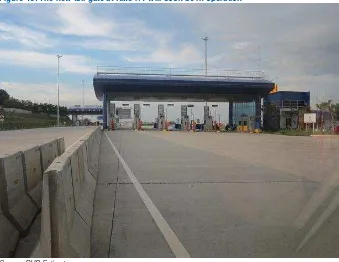
Residential and commercial: the saga continues. Growth in the industrial sector has spurred job creation as well increased the demand for residential and commercial properties. As new challenges arise in the industrial sector, the company will focus more on developing its residential and commercial properties. In our view, it has better infrastructure and complete public facilities compared to its peers, given that: (i) the type of factories operating in the estate are mostly in light industries, (ii) it offers better public facilities, with total of 15 schools including an international school, a mall, a hotel and a waterpark, and (iii) the soon-to-be-given toll road access at KM34+7 (see Figure 9) will allow residents a way to avoid traffic congestion at the current toll gate (at KM30), which is also the same gate to Kawasan Industri Jababeka (KIJA IJ, NR).
See important disclosures at the end of this report 5
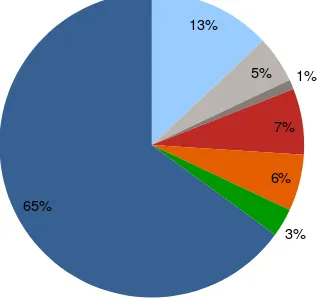
Figure 10: LPCK’s tenants are mostly light industry companies
13%
5% 1%
7%
6%
3% 65%
Automotive Electronic F&B Warehouse Plastics Pharmaceutical Others
Source: Company
Figure 11: Complete public facilities to accommodate industrial and residential needs
See important disclosures at the end of this report 6
Figure 12: Current toll exit conditions at Cikarang Barat (at KM30)
Source: RHB Estimates
Figure 13: The new toll gate at KM34+7 will soon be in operation
Source: RHB Estimates
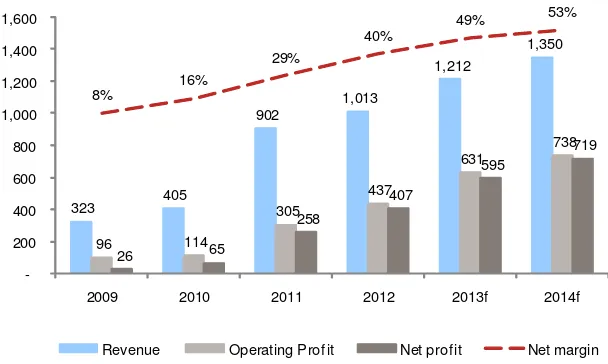
Focusing on residential land could garner LPCK higher margins moving forward, as the residential price is currently at IDR4.5m/sq m vs industrial land’s IDR1.7m/sq m, while both types of land were acquired at more or less the same cost of IDR200k-IDR300k/sq m. This implies a c.75% gross margin for residential and commercial land and a 63% margin for industrial land. Its management also expects the prices of land to increase by another 20%-30% this year after the KM34+7 toll opens sometime around August. As such, we expect the company’s net margin to expand further to 49% and 53% for FY13F and FY14F respectively.
See important disclosures at the end of this report 7
Revenue Operating Prof it Net prof it Net margin
Source: Company, RHB estimates
Figure 15: The residential land price is 2.5x higher than the industrial land price
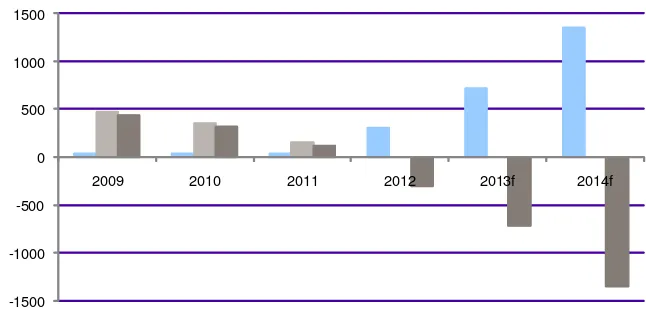
0.4 0.4 0.4 0.5 debt-free since 2012. With its strong operating performance and strategy to keep its inventory of land, we expect LPCK to generate a FCF of IDR709bn in FY13F, which equals a 10% yield to its current share price.
See important disclosures at the end of this report 8
Figure 16: LPCK has a solid balance sheet with zero debt
-1500 -1000 -500 0 500 1000 1500
2009 2010 2011 2012 2013f 2014f
in IDR bn
Cash Gross Debt Net cash
Source: Company, RHB Estimates
Figure 17: A photograph of the Japanese SMEs Center
See important disclosures at the end of this report 9
Figure 18 Overview on LPCK’s partnerships
Japanese SMEs Centre is a project to accomodate Japanese small and medium enterprise (SME) owners wishing to expand in Indonesia. The project is built on a 5.3ha plot inside LPCK’s industrial estate, Delta Silicon 6, at an investment of IDR60bn. It is designed to provide investors with business support, at a rental rate of USD10/sq m/month. The leases are effective for up to five years. To enhance the business hub's capabilities, LPCK has formed a partnership with Forval Indonesia, a business consultancy and the Indonesian arm of Tokyo-based Forval Corporation (8275:JP, NR), an IT corporation and an international consultancy firm.
So far there are seven companies (vs a target of 25) that have signed up to be part of the business hub. These include PT Summit Electrical Steel Processing Indonesia, PT Katsuyamaseiki KKB Indonesia which deals in cutting tools, PT Kobayu Trading Indonesia which deals in industrial components, die producer PT Tsujikawa Indonesia and diamond-cutting tool producer PT Nihon Haken.
PT TTL Residences is a joint venture between LPCK (25%) with Toyota Tsusho Group (51%)-(8015:JP, NR), Toyota Housing (12%) and Tokyu Land Indonesia (12%). The project has a total area is around 7,000 sq m, for which plans have been made to develop and operate a hotel-style residential building at an investment of USD30m. The hotel residences will be geared towards business travelers on medium- to long-term stays and expatriates desiring full-fledged Japanese-style facilities. It is expected to have approximately 170 rooms spread over 18 floors, and offering rental rates of around USD20,000/year/unit. This project should solve the problem of the shortage of lodging or residential facilities in the Cikarang district, which is expected to grow along with the number of Japanese companies expanding into Indonesia.
Source: Various
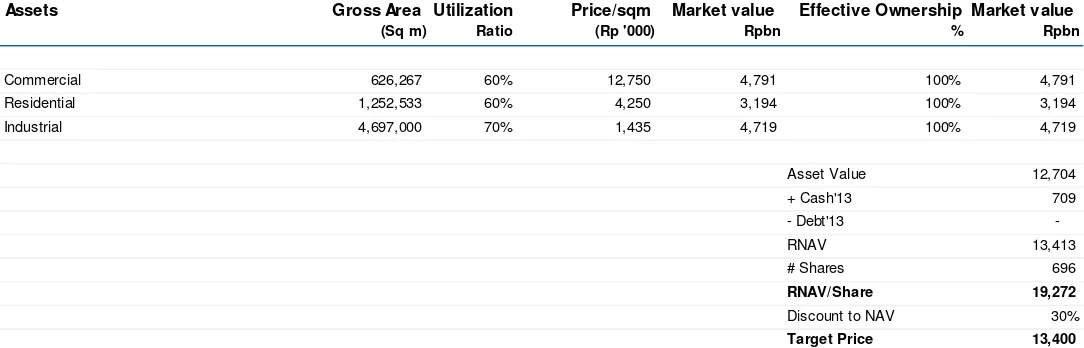
TP of IDR13,400 is a 30% discount to its RNAV of IDR19.2trn
We like the company for several reasons: i) its estates are in good locations and come with ready infrastructure, ii) it has residential and commercial properties to accomodate the growing demand from its industrial tenants, iii) it has a better infrastructure and complete public facilities for residential tenants, and iv) the future new toll road access will ensure robust profitability as the ASP of land will continue to rise. This is on top of its experienced management team, which has over 20 years of experience in property development.
Our TP of IDR 13,400 represents a 30% discount to RNAV or 15.7-13.0x P/E FY13F-FY14F. We value the company based on its NAV, assuming it has 441ha of sellable landbank for FY13F at net market prices of IDR4.25m/sq m for residential land, IDR12.7m/sq m for commercial land and IDR1.4m/sq m for industrial land.
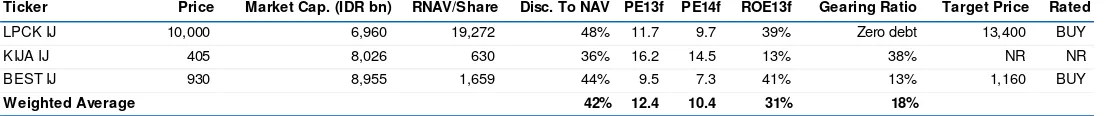
We think the company still relatively cheap even though its share price has surged 210% YTD to IDR10,000, as: i) it is at 48% discount to NAV, ii) its current price implies 11.7-9.7x P/E FY13F-FY14F. This is comparable to the industry’s 2013-2014 P/E of 12.4-10.4x, iii) it has zero debt, and iv) its ROE for FY13F is at 39% in light of the mix of its industrial and residential properties for sale. BUY.
Figure 19: Landbank comparison (in ha)
Company Total landbank in Cikarang Residential area Industrial Area
KIJA IJ 1,168 600 568 LPCK IJ 740 301 439 BEST IJ 858 - 858
Source: Companies
Figure 20: LPCK’s stock details vs industry peers’
Ticker Price Market Cap. (IDR bn) RNAV/Share Disc. To NAV PE13f PE14f ROE13f Gearing Ratio Target Price Rated LPCK IJ 10,000 6,960 19,272 48% 11.7 9.7 39% Zero debt 13,400 BUY
KIJA IJ 405 8,026 630 36% 16.2 14.5 13% 38% NR NR
BEST IJ 930 8,955 1,659 44% 9.5 7.3 41% 13% 1,160 BUY
Weighted Average 42% 12.4 10.4 31% 18%
See important disclosures at the end of this report 10
Figure 21: Nav Calculation
Assets Gross Area Utilization Price/sqm Market value Effective Ownership Market value
(Sq m) Ratio (Rp '000) Rpbn % Rpbn
Commercial 626,267 60% 12,750 4,791 100% 4,791 Residential 1,252,533 60% 4,250 3,194 100% 3,194 Industrial 4,697,000 70% 1,435 4,719 100% 4,719
Asset Value 12,704 + Cash'13 709 - Debt'13
-RNAV 13,413
# Shares 696 RNAV/Share 19,272
Discount to NAV 30%
Target Price 13,400
See important disclosures at the end of this report 11
Financial Exhibits
Profit & Loss (IDRbn) Dec-10 Dec-11 Dec-12 Dec-13F Dec-14F
Total turnover 405 902 1,013 1,212 1,350
Cost of sales (226) (514) (493) (482) (500)
Gross profit 179 388 520 731 850
Other operating costs (66) (84) (83) (100) (111)
Operating profit 114 305 437 631 738
Operating EBITDA 114 311 441 639 747
Depreciation of fixed assets - (7) (4) (8) (9)
Operating EBIT 114 305 437 631 738
Net income from investments 6 3 6 7 8
Other recurring income 6 8 9 -
-Interest income 1 3 8 21 40
Interest expense (41) (16) (4) (4) (1)
Exchange gains (1) (0) 2 -
-Pre-tax profit 85 302 458 655 786
Taxation (20) (44) (51) (61) (67)
Profit after tax & minorities 65 258 407 595 719
Reported net profit 65 258 407 595 719
Recurring net profit 65 258 407 595 719
Source: Company data, RHB Estimates Cash flow (IDRbn) Dec-10 Dec-11 Dec-12 Dec-13F Dec-14F Operating profit 114 305 437 631 738
Depreciation & amortisation - 7 4 8 9
Change in working capital 387 (398) (104) (57) 76
Other operating cash flow (48) (47) (30) (36) (20)
Operating cash flow 452 (133) 308 546 803
Cash flow from operations 452 (133) 308 546 803
Capex (446) (6) 112 (147) (165)
Other new investments (1) 26 - -
-Other investing cash flow 0 (24) (7) -
-Cash flow from investing activities (446) (5) 105 (147) (165)
Proceeds from issue of shares 0 - - -
-Increase in debt - 140 (140) -
-Cash flow from financing activities 0 140 (140) -
-Cash at beginning of period 30 35 37 310 709
Total cash generated 6 2 273 399 638 Implied cash at end of period 35 37 310 709 1,348
See important disclosures at the end of this report 12
Financial Exhibits
Balance Sheet (IDRbn) Dec-10 Dec-11 Dec-12 Dec-13F Dec-14F
Total cash and equivalents 61 37 310 709 1,348 Inventories 1,045 1,359 1,940 1,896 1,969 Accounts receivable 62 74 54 64 72 Other current assets 34 80 147 147 147 Total current assets 1,202 1,551 2,451 2,816 3,536 Total investments - 24 31 31 31 Tangible fixed assets 468 467 351 489 645 Total non-current assets 468 491 381 520 676 Total assets 1,670 2,042 2,832 3,336 4,212 Short-term debt - 140 - - -Accounts payable 20 204 0 - -Other current liabilities 1,086 877 1,604 1,513 1,670 Total current liabilities 1,106 1,221 1,604 1,513 1,670 Total liabilities 1,106 1,221 1,604 1,513 1,670 Share capital 387 387 387 387 387 Retained earnings reserve 176 434 841 1,436 2,155 Shareholders' equity 564 821 1,228 1,823 2,542 Total equity 564 821 1,228 1,823 2,542 Total liabilities & equity 1,670 2,042 2,832 3,336 4,212
Source: Company data, RHB Estimates
Key Ratios (IDR) Dec-10 Dec-11 Dec-12 Dec-13F Dec-14F
Revenue growth (%) 25.2 123.0 12.3 19.7 11.4
Operating profit growth (%) 17.9 168.3 43.5 44.4 17.1
Net profit growth (%) 154.3 294.6 58.0 46.1 20.8
EPS growth (%) 154.3 294.6 58.0 46.1 20.8
Bv per share growth (%) 13.1 45.7 49.5 48.4 39.4
Operating margin (%) 28.0 33.7 43.1 52.0 54.7
Net profit margin (%) 16.1 28.6 40.2 49.1 53.2
Return on average assets (%) 4.1 13.9 16.7 19.3 19.0
Return on average equity (%) 12.3 37.2 39.7 39.0 32.9
Net debt to equity (%) (10.8) 12.5 (25.3) (38.9) (53.0)
Recurrent cash flow per share 650 (192) 442 784 1,154
See important disclosures at the end of this report 13
SWOT Analysis
Strategically located at KM30, east of Jakarta Better environment, infrastructure and complete
public facilities for industrial and residential tenants
Strong management with more than 20 years of experience in property development.
Solid cash flow with zero debt
Depleting
Low landbank inventory could restrain cash flow and increase acquisition costs, which will crimp its profit margin
P/B (x) (lhs) Return on average equity (rhs)
Source: Company data, RHB Estimates Source: Company data, RHB Estimates
Company Profile
See important disclosures at the end of this report 14
Recommendation Chart
0 1,000 2,000 3,000 4,000 5,000 6,000 7,000 8,000 9,000 10,000
May-08 Sep-09 Dec-10 Mar-12
Price Close
NR
8
,7
5
0
1
0
,6
0
0
Recommendations & Target Price
Buy Neutral Sell Trading Buy
Take Prof it Not Rated
15 RHB Guide to Investment Ratings
Buy: Share price may exceed 10% over the next 12 months
Trading Buy: Share price may exceed 15% over the next 3 months, however longer-term outlook remains uncertain
Neutral: Share price may fall within the range of +/- 10% over the next 12 months
Take Profit: Target price has been attained. Look to accumulate at lower levels
Sell: Share price may fall by more than 10% over the next 12 months
Not Rated: Stock is not within regular research coverage
Disclosure & Disclaimer
All research is based on material compiled from data considered to be reliable at the time of writing, but RHB does not make any representation or warranty, express or implied, as to its accuracy, completeness or correctness. No part of this report is to be construed as an offer or solicitation of an offer to transact any securities or financial instruments whether referred to herein or otherwise. This report is general in nature and has been prepared for information purposes only. It is intended for circulation to the clients of RHB and its related companies. Any recommendation contained in this report does not have regard to the specific investment objectives, financial situation and the particular needs of any specific addressee. This report is for the
information of addressees only and is not to be taken in substitution for the exercise of judgment by addressees, who should obtain separate legal or financial advice to independently evaluate the particular investments and strategies.
RHB, its affiliates and related companies, their respective directors, associates, connected parties and/or employees may own or have positions in securities of the company(ies) covered in this research report or any securities related thereto, and may from time to time add to, or dispose off, or may be materially interested in any such securities. Further, RHB, its affiliates and related companies do and seek to do business with the company(ies) covered in this research report and may from time to time act as market maker or have assumed an underwriting commitment in securities of such company(ies), may sell them or buy them from customers on a principal basis and may also perform or seek to perform significant investment banking, advisory or underwriting services for or relating to such company(ies), as well as solicit such investment, advisory or other services from any entity mentioned in this research report.
RHB and its employees and/or agents do not accept any liability, be it directly, indirectly or consequential losses, loss of profits or damages that may arise from any reliance based on this report or further communication given in relation to this report, including where such losses, loss of profits or damages are alleged to have arisen due to the contents of such report or communication being perceived as defamatory in nature.
The term “RHB” shall denote where applicable, the relevant entity distributing the report in the particular jurisdiction mentioned specifically herein below and shall refer to RHB Research Institute Sdn Bhd, its holding company, affiliates, subsidiaries and related companies.
All Rights Reserved. This report is for the use of intended recipients only and may not be reproduced, distributed or published for any purpose without prior consent of RHB and RHB accepts no liability whatsoever for the actions of third parties in this respect.
Malaysia
This report is published and distributed in Malaysia by RHB Research Institute Sdn Bhd (233327-M), Level 11, Tower One, RHB Centre, Jalan Tun Razak, 50400 Kuala Lumpur, a wholly-owned subsidiary of RHB Investment Bank Berhad (RHBIB), which in turn is a wholly-owned subsidiary of RHB Capital Berhad.
Singapore
This report is published and distributed in Singapore by DMG & Partners Research Pte Ltd (Reg. No. 200808705N), a wholly-owned subsidiary of DMG & Partners Securities Pte Ltd, a joint venture between Deutsche Asia Pacific Holdings Pte Ltd (a subsidiary of Deutsche Bank Group) and OSK Investment
Bank Berhad, Malaysia which have since merged into RHB Investment Bank Berhad (the merged entity is referred to as “RHBIB”, which in turn is a wholly
-owned subsidiary of RHB Capital Berhad). DMG & Partners Securities Pte Ltd is a Member of the Singapore Exchange Securities Trading Limited. DMG & Partners Securities Pte Ltd may have received compensation from the company covered in this report for its corporate finance or its dealing activities; this report is therefore classified as a non-independent report.
As of 27 May 2013, DMG & Partners Securities Pte Ltd and its subsidiaries, including DMG & Partners Research Pte Ltd do not have proprietary positions in the securities covered in this report, except for:
a) -
As of 27 May 2013, none of the analysts who covered the securities in this report has an interest in such securities, except for:
a) Lippo Cikarang Tbk PT
Special Distribution by RHB
Where the research report is produced by an RHB entity (excluding DMG & Partners Research Pte Ltd) and distributed in Singapore, it is only distributed to "Institutional Investors", "Expert Investors" or "Accredited Investors" as defined in the Securities and Futures Act, CAP. 289 of Singapore. If you are not an "Institutional Investor", "Expert Investor" or "Accredited Investor", this research report is not intended for you and you should disregard this research report in its entirety. In respect of any matters arising from, or in connection with this research report, you are to contact our Singapore Office, DMG & Partners Securities Pte Ltd.
Hong Kong
This report is published and distributed in Hong Kong by RHB OSK Securities Hong Kong Limited (“RHBSHK”) (formerly known as OSK Securities Hong
Kong Limited), a subsidiary of OSK Investment Bank Berhad, Malaysia which have since merged into RHB Investment Bank Berhad (the merged entity is referred to as “RHBIB”), which in turn is a wholly-owned subsidiary of RHB Capital Berhad.
16 Risk Disclosure Statements
The prices of securities fluctuate, sometimes dramatically. The price of a security may move up or down, and may become valueless. It is as likely that losses will be incurred rather than profit made as a result of buying and selling securities. Past performance is not a guide to future performance. RHBSHK does not maintain a predetermined schedule for publication of research and will not necessarily update this report
Indonesia
This report is published and distributed in Indonesia by PT RHB OSK Securities Indonesia (formerly known as PT OSK Nusadana Securities Indonesia), a subsidiary of OSK Investment Bank Berhad, Malaysia, which have since merged into RHB Investment Bank Berhad, which in turn is a wholly-owned subsidiary of RHB Capital Berhad.
Thailand
This report is published and distributed in Thailand by RHB OSK Securities (Thailand) PCL (formerly known as OSK Securities (Thailand) PCL), a subsidiary of OSK Investment Bank Berhad, Malaysia, which have since merged into RHB Investment Bank Berhad, which in turn is a wholly-owned subsidiary of RHB Capital Berhad.
Other Jurisdictions
In any other jurisdictions, this report is intended to be distributed to qualified, accredited and professional investors, in compliance with the law and regulations of the jurisdictions.
DMG & Partners Research Guide to Investment Ratings
Berhad, Malaysia which have since merged into RHB Investment Bank Berhad (the merged entity is referred to as “RHBIB” which i
Kuala Lumpur Hong Kong Singapore
Malaysia Research Office (formerly known as OSK Securities Hong Kong Ltd.)
12th Floor (formerly known as PT OSK Nusadana Securities
Indonesia)
RHB OSK (China) Investment Advisory Co. Ltd. (formerly known as OSK (China) Investment (formerly known as OSK Indochina Securities Limited)
No. 1-3, Street 271 (formerly known as OSK Securities (Thailand) PCL)