EXTRACTING SPATIOTEMPORAL OBJECTS FROM RASTER DATA TO REPRESENT
PHYSICAL FEATURES AND ANALYZE RELATED PROCESSES
J. A. Zollweg a, *
a Dept. of the Earth Sciences, The College at Brockport, 350 New Campus Drive, Brockport, NY 14420 USA – [email protected]
KEY WORDS: feature extraction, remote sensing, object-oriented modelling, storm elements
ABSTRACT:
Numerous ground-based, airborne, and orbiting platforms provide remotely-sensed data of remarkable spatial resolution at short time intervals. However, this spatiotemporal data is most valuable if it can be processed into information, thereby creating meaning. We live in a world of objects: cars, buildings, farms, etc. On a stormy day, we don’t see millions of cubes of atmosphere; we see a thunderstorm ‘object’. Temporally, we don’t see the properties of those individual cubes changing, we see the thunderstorm as a whole evolving and moving. There is a need to represent the bulky, raw spatiotemporal data from remote sensors as a small number of relevant spatiotemporal objects, thereby matching the human brain’s perception of the world. This presentation reveals an efficient algorithm and system to extract the objects/features from raster-formatted remotely-sensed data. The system makes use of the Python object-oriented programming language, SciPy/NumPy for matrix manipulation and scientific computation, and export/import to the GeoJSON standard geographic object data format. The example presented will show how thunderstorms can be identified and characterized in a spatiotemporal continuum using a Python program to process raster data from NOAA’s High-Resolution Rapid Refresh v2 (HRRRv2) data stream.
1. INTRODUCTION
We are lucky to have access to remotely-sensed data in ever-increasing variety, quality, and frequency. Numerous ground-based, airborne, and orbiting platforms provide data of remarkable spatial resolution at short time intervals. However, this spatiotemporal feast of data is most valuable if it can be processed into information. This processing greatly reduces the sheer volume to be dealt with, and more importantly, creates meaning from the raw data collected from the sensors.
The concept of an object is key. We live in a world of objects: cars, buildings, farms, watersheds, thunderstorms, etc. On a achieved by representing temporal changes in a vast numbers of land patches or atmospheric cubes (as remote sensors see the world) as a small number of relevant spatiotemporal objects (to match the way the human brain perceives the world).
Fortunately, the computational sciences provide a highly effective way to identify and represent objects (physical features as well as data structures) by using a tool called object-oriented programming. Python (a free and open-source, object-oriented computing language) can be used to extract the objects/features from raster-formatted remotely-sensed data. Among the resources available in many Python implementations are SciPy/NumPy for matrix manipulation and scientific computation, the Python Imaging Library (PIL), and interfaces to allow data export/import to the Geographic JavaScript Object Notation (GeoJSON) standard object data format.
The tools/procedures documented in this project are intended to enable analysis of a particularly difficult variety of spatiotemporal data. Specifically, it handles data that is obtained
using remote sensing and is in raster format. Most importantly, the target data is continuously variable over space, and does plant disease epidemics, and species home ranges
- areal extent of excessive noise environments - boundaries of human geographies such as
high crime areas, retail business catchments, areas with inadequate access to services
The specific examples in this paper will show how thunderstorms can be identified and characterized in a spatiotemporal continuum using a Python program to process raster data from Refresh Data (HRRR). From the NOAA website: “The HRRR is a NOAA real-time 3-km resolution, hourly updated, cloud-resolving, convection-allowing atmospheric model, initialized by 3km grids with 3km radar assimilation. Radar data is assimilated in the HRRR every 15 min over a 1-h period adding further detail to that provided by the hourly data assimilation from the 13km radar-enhanced Rapid Refresh. (NOAA-ESRL).” While NOAA characterizes this data as model output, it could be more accurately be described as model-enhanced remotely sensed data due to the frequent, major contributions of various forms of
time radar and sounding data to model runs. Also, the data is [x,y,z] formatted (geographic location plus a single value) and is therefore identical in form to remotely sensed data. HRRR data is massive in scope. It has 3 km spatial resolution over the whole continental United States, it is refreshed as often as every 15 minutes, and contains over 70 atmospheric parameters.
For this study, the composite reflectivity parameter was used. This represents the radar reflectance signal, and is an indicator of the amount of falling precipitation that exists in the lower atmosphere. Note that the units of composite reflectivity are dBZ (decibels relative to Z). This is a logarithmic dimensionless measure of the “bounce back” of a weather radar signal from raindrops. As such, it is an excellent single parameter indicator of the presence of storms producing intense precipitation. Note that it is also familiar to television viewers as the generic ‘weather radar’.
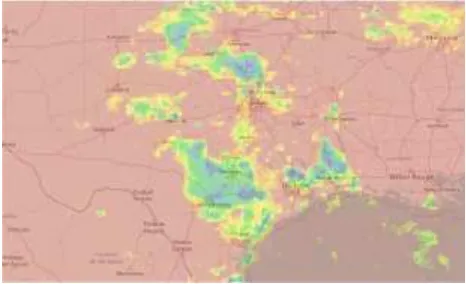
Shown below is an illustration (using ArcMap to enable symbology and basemap) of a sample of HRRR data. It show the target parameter (composite reflectivity) for June 12, 2016 at 12:00 GMT , clipped to a region around Texas that shows substantial activity, not surprising for that area in the early evening in June.
Figure 1. Data set from HRRR: composite reflectivity from June 2, 2016, 1200 GMT
2.2 Weather and Climate Toolkit
The HRRR data is created and distributed in a format called GRIB2. This is a highly efficient data format which allows condensed storage a massive data sets consisting of numerous parameters. From the NOAA website: “NOAA's Weather and Climate Toolkit (WCT) is free, platform independent software distributed from NOAA's National Centers for Environmental Information (NCEI). The WCT allows the visualization and data export of weather and climate data, including Radar, Satellite and Model data. The WCT also provides access to weather/climate web services provided from NCEI and other organizations. The data export feature supports conversion of data to a variety of common formats including GeoJSON, KMZ, Shapefile, Well-Known Text, GeoTIFF, ESRI Grid and Gridded NetCDF. These data export features promote the interoperability of weather and climate information with various scientific communities and common software packages such as ArcGIS, Google Earth, MatLAB, QGIS, R and many more. (NOAA-NCEI)”. Hence, the WCT allows convenient extraction of specific data layers
from the efficient but opaque GRIB2 format. For greatest clarity the Storm Object Extraction Model (next section) uses data in a simple ESRI format (shown below). Use of this simple, common data format allows the possibility of the extraction procedure to be applied to other clustering or object-creation applications outside of meteorological studies.
Figure 2. ESRI GRID format (from Wikipedia,
https://en.wikipedia.org/wiki/Esri_grid)
2.3 Storm Object Extraction Model (SOEM)
The Storm Object Extraction Model (SOEM) is a Python program (using the Enthought Canopy Python distribution) which identifies individual storm elements from the mass of raw HRRR data. A general outline of the algorithm used is:
1. Identify cells that will serve as storm element centers
a. Use the minimum reflectivity (rainfall intensity) that allows a particular cell to constitute a storm element center. This is a user-defined parameter
b. Use the minimum separation between storm elements. This is a user-defined parameter
c. Use the NumPy maximum_filter routine to make a list of storm centers to use as starting points. NumPy is a Python array computation package.
2. Create an additional list of all cells that may be part of a storm element
a. Use minimum reflectivity to decide if a cell can be part of a storm element. This is a user-defined parameter.
3. Assign each member of the list in (2) above to one of the storm element centers
a. If needed, carve a dividing line between storm centers to ensure proper separation of storm elements
b. At the end of this process there will a set of lists with each list containing the cells belonging to a single storm element.
4. Characterize each storm element by examining the list of cells that constitutes it. This will create an object with the following properties:
a. Geographic characteristics such as areal extent, location of centroid, size, etc.
b. Average value of the composite reflectivity
c. Other meteorological characteristics of interest, such as rainfall amount/intensity, winds, vertical motion
5. Optionally, examine each storm element to determine if there are embedded sub-storm elements within it using the same process as described above.
6. Store the storm objects in convenient format. It is possible to use the GeoJSON import/export utility in Enthought Canopy Python to capture/store each of the storm elements identified in a compact database, including its geographic coordinates and any desired attributes. The result is creation of a small number of “intelligent” objects
representing the storm elements at a particular time, instead of a mass of raster data.
The user-defined parameters are essential as they provide great flexibility. The SOEM can be applied to widely varying scales (i.e. nationwide versus regional scale), detection levels, and storm complexity. The overall algorithm and the user-defined parameters accommodate various ambiguous situations, such as those illustrated below:
Figure 3. Two common situations that introduce ambiguity in storm definition: (a) two distinct storms incorrectly joined together as one (b) storm sub-elements embedded within storm
elements (from Han, L., et. al., 2009).
3. RESULTS
3.1 Simple test case for illustration
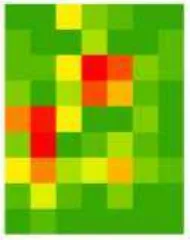
For clarity and brevity, the model functionality is initially illustrated by a simple 7 by 9 cell ‘study area’, shown below. This case was designed to show two clearly defined areas of activity (middle of column 2 and middle of row 3), as well as one marginal area (middle-right of row 7).
Figure 4. Simple test case – visualized. Color range from green (low values) to red (high values)
Figure 5. Simple test case – represented as raster input data
3.2 Results for simple test case
Below are shown several visualized results. In Figure 6, the user assigned parameter was set to indicate a low threshold for inclusion in a storm element. The total area assigned is large, and the whole active area accumulated to one storm element.
Figure 6. Simple test case – low threshold for inclusion in storm element
In Figure 7, the user assigned parameter was set to indicate a moderately high threshold for inclusion in a storm element. The total area assigned is fairly large, and the area is well segmented among the three (expected) storm elements.
Figure 7. Simple test case – moderately high threshold for inclusion in storm element
In Figure 8, another user-assigned parameter was set to indicate a high threshold for a cell to serve as the center/origin of a storm element. In this case, the marginal area (middle-right of row 7) does not identify as a separate storm element, and the cells are absorbed into another storm element.
Figure 8. Simple test case –high threshold for being a storm element center
3.3 Results for real data
The Storm Object Extraction Model was run for the actual High Resolution Rapid Refresh Data set of June 2, 2016 that is shown in Figure 1. The data set has 1362 rows by 2264 columns, for a total of 3,083,568 cells. It represents about 1/8 of the total area of the continental United States at a 3km x 3km resolution. The seven storm elements identified are shown in Figure 9 (compare with the raw data of Figure 1).
Figure 9. June 2, 2016 actual HRRR data
The model run was completed in approximately 2.4 seconds on a Dell Optiplex 3020 with a Core i5 processor. As the algorithm execute time increases at O(n ln n) it is possible to extract storm elements on a continental scale much faster than the refresh rate of the HRRR data (every fifteen minutes), even on a very mediocre computer.
3.4 Case study: Central New York flash floods of July 1, 2017
In Central New York on July 1, 2017 there was a wave of severe storms resulting in flash flooding serious enough to warrant
national news coverage,
https://www.washingtonpost.com/video/national/heavy-rain-
causes-flash-flooding-in-central-new- york/2017/07/03/58388e7c-600c-11e7-80a2-8c226031ac3f_video.html
In order to study this event it is useful to identify, characterize, and track the storm elements that passed through Central New York causing very heavy precipitation. The SOEM model was applied to the composite reflectivity data from HRRR from 10Z and 11Z (Z refers to Zulu or UTC – Universal Time Coordinated or GMT – Greenwich Mean Time). The raw HRRR data is shown in Figures 10 and 11.
Figure 10. Composite reflectivity. 10Z July 1, 2017 showing severe weather approaching Central New York.
Figure 11. Composite reflectivity. 11Z July 1, 2017 showing severe weather affecting Central New York.
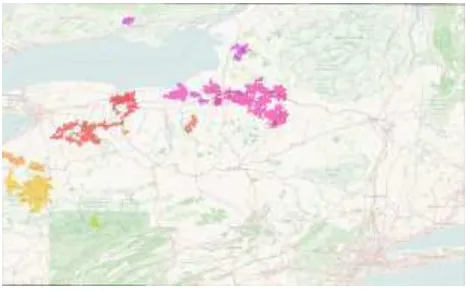
The SOEM model was run on the HRRR data employing the user-defined parameters of 33 dBZ for the minimum value for membership in a storm element and 50 dBZ for the minimum value to establish a storm center. Figures 12 and 13 show the individual storm elements identified by the SOEM model.
Figure 12. Storm elements for 10Z July 1, 2017 (compare with Figure 10).
Figure 13. Storm elements for 11Z July 1, 2017 (compare with Figure 11).
At 10Z there are a total of 18 storm elements, and at 11Z there are a total of 12 storm elements. Although the overall storm system overall greatly increased in severity, some individual storm elements died out or were absorbed between 10Z and 11Z. The conversion of the masses of HRRR composite reflectivity data to a handful of clearly defined and characterized storm elements enables meteorological scientists and forecasters to more easily study the evolution of these systems.
4. CONCLUSIONS AND SIGNIFICANCE
4.1 Efficient and effective application program
The algorithm that drives the Storm Object Extraction Model (SOEM) is efficient and clear. It can also be easily modified to suit the needs of other scientists and applications such as those described at the end of the introduction (i.e. spatial ecology, human geography, topography).
4.2 Need to capture HRRR data in a form amenable to convenient analysis
The National Oceanic and Atmospheric Administration of the U.S. Department of Commerce reports that 20 Terabytes of weather-related data are created EVERY DAY. In fact, much of this information is not even archived, due to storage and processing constraints. The Storm Object Extraction Model will allow interested scientists to capture the essence of this data (in the form of objects representing the important storm elements
that occur. These weather objects can then very conveniently be used for study and analysis of ‘exciting’ weather without the need to search and abstract from multiple petabytes of data.
4.3 Enhances downstream analysis and processing of spatiotemporal data environmental scientists with respect to their masses of digital data about the world. The SOEM also helps identify very important, small, short-lived phenomena such as intense convective cells in the atmosphere (thunderstorms). These can develop very rapidly into high winds, tornados, flash flood precipitation, hail, and other very dangerous weather. By identifying the fairly small areas occupied by these storms (10-30 miles in diameter) one can proceed immediately to very short time step analyses in an effort to forecast their development on a minute-by-minute and mile-by-mile basis using such tools as cellular automata modelling. Waiting for model refresh of the overarching continental models is likely to miss completely the growth and dissipation of highly local events, or at least greatly reduce the potential warning time for people in the area.
4.4 Many other spatiotemporal / environmental data sets can be treated in the same way
There are other spatiotemporal data sets that could benefit from similar object extraction models, which can be based on the successful SOEM algorithm. In fact, any massive raster data set with continuously varying values that also change (relatively) rapidly over time can be subject to object extraction. It is especially useful/important for data that contain objects with fuzzy boundaries. Some examples include remotely sensed data of:
drought areas
extent of insect or plant disease outbreaks progress of urbanization
flood extent wildfire spread
changes in volcano topography indicating impending eruption
The SOEM application is very clear and generic. The user-defined parameters are not specifically tied to meteorological analysis, but are used only to set the spatial and value parameters needed for the extraction. The same parameters (how big does the cell value have to be for inclusion in an object, how far apart object centers have to be, etc) will be the same for any application.
REFERENCES
Benjamin, S.G., et. al., 2016. A North American Hourly Assimilation and Model Forecast Cycle: The Rapid Refresh, Monthly Weather Review, 144:4, p. 1669-1694.
DeCaria, A.J., 2016. Python Programming and Visualization for Scientists, Sundog Publishing, Madison, Wisconsin
Dixon, M., G. Wiener, 1993. TITAN: Thunderstorm Identification, Tracking, Analysis, and Nowcasting – a
based Methodology, Journal of Atmospheric and Oceanic Technology, 10:6, p. 785-797.
Wang, Y. and Panton, D. and Fitt, A.D. (2002) The application of cellular automata to weather radar. Workshop on Industrial Applications 2002 (Hong Kong, Jul 8-12, 2002) [Study Group Report]
Han, L., et. al., 2009. 3D Convective Storm Identification, Tracking, and Forecasting—An Enhanced TITAN Algorithm, Journal of Atmospheric and Oceanic Technology, 26, p. 719-732.
Heistermann, M., et. al., 2015. The Emergence of Open Source Software for the Weather and Radar Community, Bull. Am. Meteorol. Soc. 96:1.
Lakshmanan, V., T. Smith, 2010. An Objective Method of Evaluating and Devising Storm Tracking Algorithms, Weather and Forecasting, 25:2, p. 721-729.
NOAA-ESRL, 2017. National Atmospheric and Oceanic Administration-Earth System Research Laboratory website. https://rapidrefresh.noaa.gov/hrrr/
NOAA-NCEI, 2017. National Atmospheric and Oceanic Administration-National Centers for Environmental Information website, https://www.ncdc.noaa.gov/wct/
Savenije, H., M. Hrachowitz, 2017. HESS Opinions “Catchments as meta-organisms – a new blueprint for hydrological modelling, Hydrol. Earth Syst. Sci., 21, p. 1107– 1116.
Shah, S., R. Notarpietro, M. Branca, 2015. Storm Identification, Tracking and Forecasting Using High-Resolution Images of Short-Range X-Band Radar, Atmosphere. 6, p. 579-606.
Taylor, D, 1990. Object-Oriented Technology: A Manager’s Guide, Addison-Wesley Publishing Company.