HIGH-RESOLUTION URBAN GREENERY MAPPING FOR MICRO-CLIMATE
MODELLING BASED ON 3D CITY MODELS
J. Hofierka a,*, M. Gallay a, J. Kaňuk a, J. Šupinskýa, J. Šašak a
a
Institute of Geography, Faculty of Science, Pavol Jozef Šafárik University in Košice, Jesenná 5, 040 01 Košice, Slovakia - (jaroslav.hofierka, michal.gallay, jan.kanuk, jozef.supinsky, jan.sasak)@upjs.sk
Commission VI, WG VI/4
KEY WORDS: urban greenery, 3D city model, LiDAR, urban microclimate
ABSTRACT:
Urban greenery has various positive micro-climate effects including mitigation of heat islands. The primary root of heat islands in cities is in absorption of solar radiation by the mass of building structures, roads and other solid materials. The absorbed heat is subsequently re-radiated into the surroundings and increases ambient temperatures. The vegetation can stop and absorb most of incoming solar radiation mostly via the photosynthesis and evapotranspiration process. However, vegetation in mild climate of Europe manifests considerable annual seasonality which can also contribute to the seasonal change in the cooling effect of the vegetation on the urban climate. Modern methods of high-resolution mapping and new generations of sensors have brought opportunity to record the dynamics of urban greenery in a high resolution in spatial, spectral, and temporal domains. In this paper, we use the case study of the city of Košice in Eastern Slovakia to demonstrate the methodology of 3D mapping and modelling the urban greenery during one vegetation season in 2016. The purpose of this monitoring is to capture 3D effects of urban greenery on spatial distribution of solar radiation in urban environment. Terrestrial laser scanning was conducted on four selected sites within Košice in ultra-high spatial resolution. The entire study area, which included these four smaller sites, comprised 4 km2 of the central part of the city was flown within a single airborne lidar and photogrammetric mission to capture the upper parts of buildings and vegetation. The acquired airborne data were used to generate a 3D city model and the time series of terrestrial lidar data were integrated with the 3D city model. The results show that the terrestrial and airborne laser scanning techniques can be effectively used to monitor seasonal changes in foliage of trees in order to assess the transmissivity of the canopy for microclimate modelling.
1. INTRODUCTION
The positive micro-climate effects of urban greenery are well-known. During hot summers, they reduce high temperatures caused by urban heat islands but also provide numerous other positive environmental effects, such as higher humidity and reduction of dust. The key reason of heat islands in cities is in to the absorption of solar radiation by mass building structures, roads and other hard surfaces. The absorbed heat is subsequently re-radiated into the surroundings and increases ambient temperatures. The vegetation can stop and absorb most of incoming solar radiation mostly by photosynthesis and evapotranspiration process. Moreover, the cooling effect of urban greenery goes beyond its boundary, in many cases in several hundreds of meters. The phenomenon of urban heat island is elucidated by Oke (1973).
Given the associations between vegetated land cover and the biophysical and social processes of urban systems there exists an ongoing demand for effective urban vegetation mapping and classification techniques (Tooke et al., 2009). The results of the study by Tooke et al. (2011) indicated that trees on average reduce 38% of the total solar radiation received by residential building rooftops. Fogl and Moudrý (2016) found lower effect in the range of 3 - 11% and note that over 50% of the solar radiation loss occurs during the summer time.
Radiation received at the urban surface is highly variable in space and time resulting from the complex form and land cover of urban
environments. Understanding this variation in intercepted solar radiation is fundamental to determining various components of the urban energy landscape (Maimaitiyiming et al., 2014). Surface climates (Voogt and Oke, 1997), electrical and thermal energy demand of buildings (Ratti et al., 2005), and human thermal comforts (Lindberg and Grimmond, 2011) are all examples that require detailed estimates of incoming solar radiation (Eliasson, 2000). Hofierka and Zlocha (2012) have developed a new solar radiation model for application to the 3D city models.
However, modelling the effects of canopy to spatial distribution of solar radiation is still rather problematic. For example, Tooke et al. (2012) found that representation of trees as opaque objects substantially underestimates solar irradiance across urban landscape, leading up to an 18% underestimate of direct irradiance in residential areas with trees. The key components of the simulation representing the solar radiation processes are: 3D city model representing the morphology and building materials absorbing the solar radiation, solar radiation model capable of assessing the spatial distribution of solar radiation in a complex urban environment and urban vegetation model representing the varying properties of plants throughout the year (Hofierka and Zlocha, 2012).
Hopkinson and Chasmer, 2009). Canopy cover and gap fraction are commonly used metrics in forest ecology (Korhonen and Morsdorf, 2013). Airborne laser scanning is capable of measuring both very accurately, but slightly different estimation methods should be used as these metrics are defined differently. In canopy cover estimation the proportion of vertical gaps between the crowns is needed for a specific area. Canopy gap fraction includes all gaps observed from a single point with some angular view range. Canopy cover can be estimated with high accuracy as the fraction of first echoes above a specified height threshold, because only the large gaps are considered. In gap fraction estimation also last echoes should be used so that the effect of the smaller gaps within the crowns is considered. Leaf area index (LAI) can be estimated from the gap fraction using a logarithmic model with a single coefficient representing leaf orientation. However, sensor effects have a strong influence on the estimates, and therefore validation with high-quality field data is recommended. Kodar et al. (2011) found that lidar data based LAI estimate on up-scaled map became saturated at high values (LAI > 4.5) compared to the LAI estimates based on SPOT-4 HRV-IR red channel. However, the seasonality of vegetation geometry and transmittance has not been the main focused in the listed studies which mapped vegetation in a high spatial resolution.
The aim of the presented study is to assess the capability of lidar mapping to capture varying properties of urban canopy cover induced by seasonality in order to assess the mitigation of solar radiation for microclimate modelling.
2. STUDY AREA
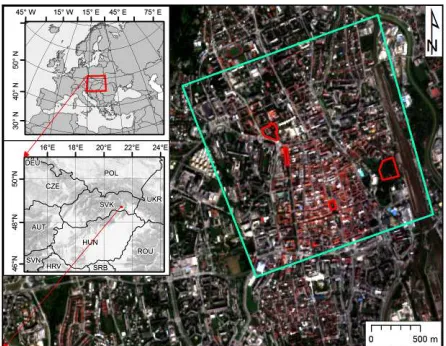
We have selected central part of the Košice city, which is the second largest city in Slovakia, Europe, with about 240,000 inhabitants. Košice is typical example of urban landscape in mild climate conditions of Central Europe. In the central part of the city we have selected rectangular area (4 km2) which consists of various types of urban greenery and built-up areas, such as parks, alleys, greenery in residential zones (Fig. 1). For detailed mapping using terrestrial laser scanning (TLS) we have selected four smaller test sites covering several hectares each with typical urban greenery consisting of various trees.
Figure 1. Location of the Košice city and the TLS survey sites (red outline) within the study area (cyan outline). Background natural composite image acquired 7 September 2016 by Sentinel 2A © ESA.
3. METHODS AND DATA
The urban greenery of the Košice city was mapped by terrestrial and airborne laser scanning in 2016 coupled with photogrammetric mapping. Airborne laser scanning data and photogrammetric imagery were captured in a single mission and used for creation of 3D city model consisting of buildings and terrain. The data were acquired in WGS 84.
3.1 Terrestrial laser scanning
The terrestrial laser scanning (TLS) of urban greenery was done in four study sites during the period April – November 2016 using the Riegl VZ-1000 scanner equipped with the Nikon D700 camera. The aim of the scanning was to capture vegetation in several phenological phases synchronously with the Sentinel 2A overflight times (+/- 1-2 days) taking into account meteorological conditions. TLS resulted in 44 datasets (point clouds) with total size of 93.8 GB representing the study sites in 11 time horizons during one vegetation period. TLS required selection of appropriate positions of the scanner during the survey in order to minimize data shadows and total number of required positions. At the same time, it was important to ensure a sufficient overlap with the adjacent position (Gallay et al., 2015; Smith, 2016). Final mutual registration of individual point clouds was performed using the Multi-Station Adjustment implemented in the RiSCAN Pro software. Hofierka et al. (2017) describe the approach in more details. The point cloud was also colourized using the digital RGB imagery acquired immediately after scanning with the integrated camera (Fig. 2 and 5A).
Figure 2. Vertical section of the TLS point cloud in Hvozdíkov park, Košice.
3.2 Airborne laser scanning and photogrammetry
Parameter Value
Flight height above ground 1,050 - 1,087 m Flight altitude above mean sea
level
1,333 m
Total number of points 365 million
Total area 4 km2
Average density of returns (all/ground)
91 / 15 points per m2
Absolute overall accuracy in open areas
0.1 m @ 1σ
Table 1. Parameters of the ALS mission flown with a Leica ALS70-CM lidar system.
Photogrammetric imagery was collected by Vexcel UltracamXp digital camera resulting in two natural and NIR false colour orthoimagery with spatial resolution of 10 cm (Fig. 3). The photogrammetric stereo imagery was used to derive a 3D city model representing the buildings in the study area with LoD2 (Fig. 4).
To supplement the TLS time series with upper parts of vegetation, the ALS and TLS point clouds within the four smaller sites (Fig. 1, red outline) were integrated in RiSCAN Pro based on identical points present in both types of datasets. Using the Multi-Station Adjustment the standard deviation of mutual registration reach only 2 cm. Achieving higher accuracy was limited by various factors such as differing accuracy of ALS and TLS or movement of tree branches induce by wind during TLS.
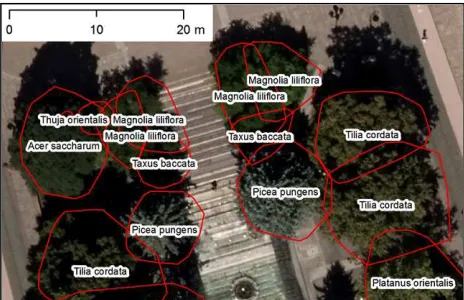
The field survey also included geobotanical mapping when WGS84 position, plant species, basic morphological parameters and health conditions were recorded for each tree within the four smaller sites. These data help to improve interpretation of the lidar point clouds and orthoimagery.
Figure 3. Footprint polygons of trees identified from airborne lidar point cloud (red outline) with assigned attributes according to the field survey overlaid on top of the aerial orthoimage.
Figure 4. 3D city model (LoD2) representing a part of the study area (Hvozdíkov park) with ALS points representing trees (green).
4. RESULTS AND DISCUSSION
The point clouds resulting from the laser scanning represent the surfaces of various urban objects, however, without any typology. Thus the user has to filter out the point clouds representing, for example, trees, manually. Moreover, selection of a single tree from the point cloud representing several trees poses another problem. For example, Fig. 5A shows a point cloud representing trees in the park with few open spaces between the trees.
4.1 Time series of meshed 3D tree models based on TLS
While point clouds accurately represent urban canopy, it is difficult to use them directly in solar radiation or microclimate models for which physical objects as virtual 3D models are required. Therefore, we explored the following software tools to derive 3D tree model from point clouds: RiSCAN Pro®, 3D forest, Geomagic Wrap® and ArcScene®.
Figure 5. RGB colourized TLS point cloud with selected trees further processed as a time series of 3D meshed models. The partial figures are explained in the text.
Figure 6. Side view of the 3D model of a tree in the GeoMagic Wrap software.
Figure 7. 3D city model including 3D meshed trees in the ArcScene software colourized according to the plant species.
4.2 Time series of urban greenery
Vegetation in the mild climate of Central Europe (especially broad leaved deciduous vegetation) undergoes various changes manifested mostly in tree foliage. This has also impact on solar transmissivity of the canopy and subsequently on microclimate conditions.
To capture these changes throughout the vegetation period we generated time-series of point clouds acquired by TLS in four study sites. The accuracy of TLS data registration for these sites and survey days reached a standard deviation of 1-4 cm. The time-series of the scans can be found at the project web site http://esa-surge.science.upjs.sk/index.php/study-sites.
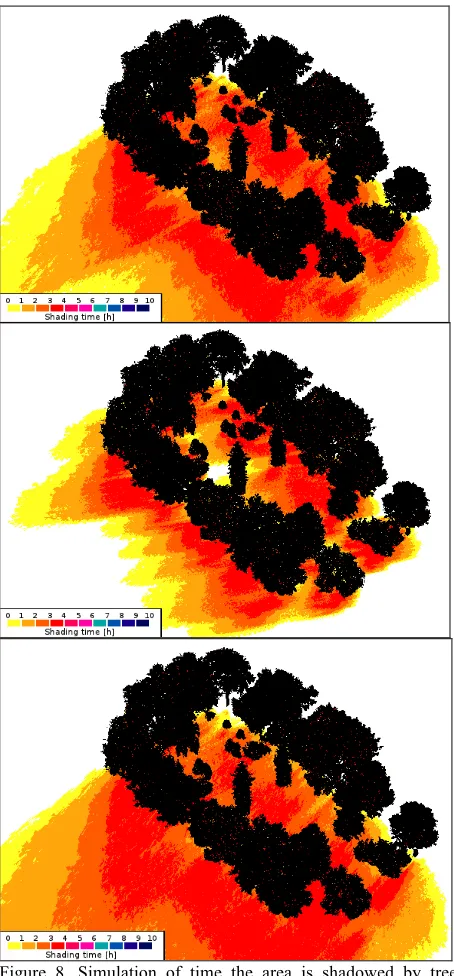
To assess the foliage of the trees in these sites we used the acquired point clouds later decimated, as described in Section 4.1, to assess volumetric parameters of individual trees. The seasonal differences in tree morphology is demonstrated in Table 2 which reports statistics of TLS point clouds time series for a single tree growing on the Moyzesova street. We consider the mean point density and voxelized tree volume as the most significant parameters as they provide normalized values indicating that the mass of the tree decreases from the summer date through the autumn and it is the lowest in spring when there were no leaves on the tree. Implications of these results are manifested in the analysis of shaded area shown in Fig. 8. It is clear that for the selected site and time interval the effect of ground shadowing can be calculated using the generated time series of the meshed 3D tree models. The time duration of area being shaded depends not only on the sun declination but also on the effect of the tree phenology can is involved.
Statistics 26 July
2016
27 October 2016
22 March 2017
Point count 387,500 389,916 206,631
Mean density (points/m3)
4,297 3,146 2,464
Total height (m) 7.71 7.71 7.54
Crown max. width (m)
6.52 6.33 6.27
Voxelized (25 cm) tree volume (m3)
99.59 94.25 81.54
Footprint area (m2) 36.89 36.38 35.38
Figure 8. Simulation of time the area is shadowed by trees between 1 p.m. to 4 p.m. using the 3D meshed tree models in the Shadow Analysis plugin of the SketchUp software for March, June and November.
5. CONCLUSION
Vegetation plays a vital role in terms of preserving good life quality standards in urban environment. Spatial location of greenery, its geometrical structure and spectral reflectance influence the effect of greenery in urban space. Contemporary mapping technologies such as terrestrial and airborne laser scanning enable capturing the state of vegetation in high resolution repeatedly. The methods provide data which can be used to analyse the impact of urban greenery on the urban climate. The presented study demonstrated a methodical framework of monitoring vegetation in the city of Košice, Slovakia, using TLS and ALS during the vegetation period. The results showed that the generated time series of vegetation point clouds and meshed 3D models of trees can be integrated within
resolution modelling of shaded areas. The future use of the 3D urban greenery time series will be in modelling solar irradiation underneath the vegetation canopy within the GIS environment. Existing solar irradiation models in GIS based on 3D vector spatial data, such as v.sun (Hofierka and Zlocha, 2012), require modification for considering the effect of trees. By this means, the amount of solar energy hitting various kinds of surfaces can be quantified more accurately and realistically. Furthermore, we expect the high resolution geometric and spectral properties of the 3D time series of greenery will be correlated with multispectral data provided by the Sentinel 2 mission of ESA. The 5-day revisit period of the Sentinel 2 satellites provides high temporal resolution coupled with higher spatial resolution and number of spectral bands than for example that of Landsat 8. These properties make the Sentinel 2 data interesting to assess potential of the data for a more accurate estimation of solar transmittance of vegetation in urban space.
ACKNOWLEDGEMENTS
This work was supported by the University Science Park TECHNICOM for Innovation Applications project, ITMS: 26220220182, supported by the Research & Development Operational Programme funded by the ERDF and the
European Space Agency project No.
4000117034/16/NL/NDe within the ESA/PECS
programme.
REFERENCES
Eliasson, I., 2000. The use of climate knowledge in urban planning. Landscape and Urban Planning, 48 (1-2), pp. 31-44.
Fogl, M., Moudrý, V., 2016. Influence of vegetation canopies on solar potential in urban environments. Applied Geography, 66, pp. 73-80.
Gallay, M., Kaňuk, J., Hochmuth, Z., Meneely, J., Hofierka, J., Sedlák, V., 2015. Large-scale and high-resolution 3-D cave mapping by terrestrial laser scanning: a case study of the Domica Cave, Slovakia. International Journal of Speleology, 44(3), pp. 277-291.
Hofierka, J., Gallay, M., Kaňuk, J., Šašak, J., 2017. Modelling Karst Landscape with Massive Airborne and Terrestrial Laser Scanning Data. In: Ivan, I., Singleton, A., Horák, J., Inspektor, T. (eds.) The Rise of Big Spatial Data, Lecture Notes in Geoinformation and Cartography, Springer International Publishing, 141-154.
Hofierka, J., Zlocha, M., 2012. A New Solar Radiation Model for 3-D City Models. Transactions in GIS, 16, pp. 681-690.
Hopkinson, C., and Chasmer, L., 2009. Testing lidar models of fractional cover across multiple forest ecozones. Remote Sensing of Environment, 113, pp. 275–288.
Isenburg, M., 2014. LAStools - efficient LiDAR processing software (version 141017, unlicensed), obtained from http://rapidlasso.com/LAStools, November 2015.
Korhonen, L., Morsdorf, F., 2013. Estimation of Canopy Cover, Gap Fraction and Leaf Area Index with Airborne Laser Scanning. In: Forestry Applications of Airborne Laser Scanning, Managing Forest Ecosystems, 27, pp. 397-417.
Lindberg, F., Grimmond, C.S.B., 2011. The influence of vegetation and building morphology on shadow patterns and mean radiant temperatures in urban areas: model development and evaluation. Theoretical and Applied Climatology, 105, pp. 1-13.
Maimaitiyiming, M., Ghulam, A., Tiyip, T., Pla, F., Latorre-Carmona, P., Halik, T., Sawut, M., Caetano, M., 2014. Effects of green space spatial pattern on land surface temperature: Implications for sustainable urban planning and climate change adaptation. ISPRS Journal of Photogrammetry and Remote Sensing, 89, pp. 59-66.
Morsdorf, F., Kötz, B., Meier, E., Itten, K.I., Allgöwer, B., 2006. Estimation of LAI and fractional cover from small footprint airborne laser scanning data based on gap fraction. Remote Sensing of Environment, 104 (1), pp. 50-61.
Oke, T. R., 1973. City size and the urban heat island. Atmospheric Environment, 7 (8), pp. 769-779.
Ratti, C., Baker, N., Steemers, K., 2005. Energy consumption and urban texture. Energy and Buildings, 37(7), pp. 762-776.
Smith, M.W., 2016. 2.1.5. Direct acquisition of elevation data: Terrestrial Laser Scanning. In: Clarke, L. (Ed.) Geomorphological Techniques (Online Edition). London:
British Society for Geomorphology.
http://www.geomorphology.org.uk/sites/default/files/chapters/2. 1.5_TLS.pdf
Smith, A.M.S., Falkowski, M.J., Hudak, A.T., Evans, J.S., Robinson, A.P., Steele, C.M., 2009. A cross-comparison of field, spectral, and lidar estimates of forest canopy cover. Canadian Journal of Remote Sensing, 35 (5), pp. 447-459.
Tooke, T.R., Coops, N.C., Christen, A., Gurtuna, O., Prévot, A., 2012. Integrated irradiance modelling in the urban environment based on remotely sensed data. Solar Energy, 86(10), pp. 2923-2934.
Tooke, T.R., Coops, N.C., Goodwin, N.R., Voogt, J.A., 2009. Extracting urban vegetation characteristics using spectral mixture analysis and decision tree classifications. Remote Sensing of Environment, 113(2), pp. 398-407.
Tooke, T.R., Coops, N.C., Voogt, J.A., Meitner, M.J., 2011. Tree structure influences on rooftop-received solar radiation. Landscape and Urban Planning, 102 (2), pp. 73-81.
Trochta, J., Krůček, M., Vrška, T., Král, K., 2017. 3D Forest: An application for descriptions of three-dimensional forest structures using terrestrial LiDAR. PLoS ONE, 12 (5), e0176871.