Refining smartphone usage analysis by combining
crowdsensing and survey
Vassili Rivron
INRIA, France. [email protected]Mohammad Irfan Khan
INRIA, France. [email protected]Simon Charneau
INRIA, France. [email protected]Isabelle Chrisment
LORIA-TELECOM Nancy, Université de Lorraine, France.Abstract—Crowdsensing has been used quite regularly in re-cent years to study smartphone usage. However context informa-tion associated with smartphone usage is mostly of the type geo-localisation, user mobility, temporal behavior etc. Furthermore most studies are not sufficiently user-centric i.e. don’t consider the perception or cognitive aspects of the user. In this paper we collect data about social context and user perception via in-app and on-line questionnaires and show that when these are combined with crowdsensed data can help improve both sensing and survey and can be applied to interesting cases.
I. INTRODUCTION
Since its inception about a decade ago, the number of smart-phones, their capability and computing power have grown enormously. In recent years this growth has led to the devel-opment of a plethora of innovative applications and services and has allowed the use of smartphones for a lot of interesting purposes one of which is Mobile crowdsensing.
Crowdsensing implies the involvement of the crowd i.e. gen-eral population possessing some kind of a sensor to sense data in the wild for example to sense the pollution level in a city, health aspects of the population etc. Crowdsensing can be either participatory sensing [1] i.e. requiring deliberate in-volvement of participants for instance task execution, tagging, data validation, quality feedback etc, or opportunistic sensing [2], which is more autonomous and requiring minimum user intervention. Similarly, when the sensor is the smartphone of participants, for example GPS, accelerometer, camera, audio etc, the task can be further specified as mobile crowdsensing [3].
In our study we implemented opportunistic mobile crownsens-ing to study about people’s smartphone usage. We passively collected smartphones usage logs in the wild by inviting the crowd to participate in a contest and install our crowdsensing application to contribute anonymous smartphone usage logs, voluntarily and in the most natural settings (their own phone, own tariff plan). Complementary to sensing we also collected contextual information (social, demographic, professional) and information about users’ perception via survey questionnaires built in the application or on the web. This experiment was carried out in the context of building a country-wide Internet observation platform in France, called Metroscope1
Our main contributions in this paper are:
1) In this paper we present our crowdsensing methodology with some challenges faced and lessons learned.
2)We then show with actual examples how context information
1www.metroscope.org
(respecting privacy) about users can simplify the interpretation of crowdsensed data.
3)Furthermore, we analyze how comparing survey information with crowdsensed data reveals information about user’s percep-tions and we discuss how sensing and survey can complement each other to improve both the methodologies.
The rest of the paper is organized as follows: In Section II we discuss the related work followed by crowdsensing method and dataset in Section III. Section IV presents how context information helps interpretation of crowdsensed data and Section V shows how the combination of sensing with survey contributes to both of them. Section VI contains the discussion and concludes the paper.
II. RELATED WORK
In recent years mobile crowdsensing has been exploited quite nicely to study people’s smartphone usage pattern [4], [5], [6]. Similarly some studies have been carried by collecting logs from the ISP’s end [7], not involving crowdsensing. Our approach is different from similar previous studies about smartphone usage [4], [5] in which identical phones were given to participants with unlimited tariff plan, whereas our experiment is deployed in the wild among the crowd on their own smartphones.
Although these papers demonstrate interesting results on smartphone usage patterns, but don’t approach this issue from a crowdsensing methodology viewpoint, which we do in this paper. Some studies use only manual forms of logging to obtain context information such as diaries [8] while others use geo-localization, user mobility patterns for context infor-mation related to smartphone usage [5], [7]. We in our study obtained usage data via crowd-sensing and context information (social, professional, geographic) and users’ perception via a questionnaire on the sensing application or on the web.
Some studies study also analyze user perception about smart-phone usage [9], [10] and report over/under estimation of declared usage as compared to actual usage. In this paper we also compare user perception with actual usage but we also extend our results to show how survey and sensing can contribute to each other.
III. CROWDSENSING METHOD AND DATASET
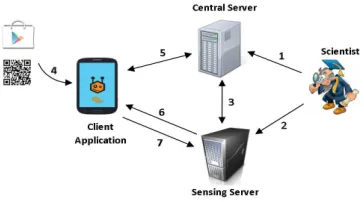
use is called Apisense [11] and consists of 3 components:
a Central Server, Sensing Server and Client Application
as shown in Figure 1. The central server contains sensitive information such as participant’s Email address so is preferably hosted in a secured environment, which for us is High Security Laboratory2. Whereas there can be more than one sensing
server spread geographically for scalability. A scientist regis-ters on the central server (1) and deploys experiment’s scripts on the sensing server (2) and the experiment appears on the list of the central server (3). A participant installs the sensing application (4) and after registration to the exact experiment (5) the sensing application downloads the scripts from sensing server (6). The experiment script instructs the sensing client to passively collect the specific system logs and sensor values.
The logs we collected for this experiment were: screen ac-tivation, foreground application usage, network connectivity, traffic volume, incoming/outgoing calls and sms. We respect privacy according to recommendations of French National Commission on Informatics and Liberty3so the logs collected don’t contain any private data in clear (but hashed with randomness) and can’t be used to identify the participant. Similarly the logs contain usage statistics rather than content. As the sensing application is distributed in the wild it doesn’t require root permission. Finally at daily regular intervals the collected logs are uploaded to the sensing server (7).
The questionnaire available on the app or on-line consists of some Open Questions and mainly Multiple Choice Questions (MCQs) about socio-demography, profession, estimated usage of Smartphone (such as usage duration, frequency, volume), questions such as perceived importance/utility of smartphone, technological profile i.e. degree of exposure to technology, cultural profile i.e. on-line/off-line cultural and amusement habits etc.
Attracting the crowd to a crowdsensing experiment like this is rather difficult, mainly due to privacy and performance concerns (although our platform handles these issues). There-fore we organized a public contest called PRACTIC4 which invited individuals to participate and win prizes based on their level of contribution (volume of logs and quality of questionnaire) and recruitment of other participants. Another reward for the participant was to get statistics on his/her usage and comparisons between perceived usage over a certain period and the actual usage as recorded by sensing, as shown in Figure 6.
The campaign was organized between 10 March and 20 April 2014, for six weeks and attracted 260 participants from several cities in France. All 260 participants filled the questionnaire partly/fully while 97 also installed the client application. Out of this 97 users only 35 produced logs continuously for at least two weeks with complete questionnaire, which makes our dataset for this paper. This minimum duration and logs continuity are important because we study usage patterns over a period which is hindered if logs are not regular on a daily basis. Figure 2 shows the participation duration and logs continuity of the 35 selected users (in red) and the 62 rejected users (in blue). The participation duration of these 35
2www.lhs.loria.fr 3www.cnil.fr/english 4beta.apisense.fr/practic
Fig. 1: Crowdsensing platform
Gender 66% male, 34% female
Profession 60% students, 40% professionals
Field 68% science/engineering, 7% commerce/
economics, 25% others
Age 59% 17-25 years, 29% 26-35 years,
12% over 36
Android 3% 2.3.X, 6% 4.0.X
60% 4.1-4.3.X, 31% 4.4.X
Brand 37% Samsung , 23% LG, 14% Sony
9% Wiko, 6% Motorola, 11% Others
TABLE I: DataSet Distribution
users varied from 17 to 139 days (some users continued even beyond the contest), average: 53 days and median: 58 days and provided 3621 hours of smartphone usage logs, using a total of around 1400 different applications.
Table I shows the dataset distribution rounded to the nearest percentage. As our crowdsensing experiment is deployed in the wild, there is a plethora of Android OS versions and phone models. Some phone models such as Sony Xperia S implement rules which hinder our sensing application such as applying battery saving mechanism which turns off passive applications on the background i.e. our sensing application. Similarly, mea-suring network traffic works almost on all Android versions except for version 4.3. Afterall the main purpose of Android is to be an Operating system for smartphones and deploying
0 10 20 30 40 50 60 70 80 90 100
March 08 March 22 April 05 April 19
May 03 May 17 May 31 June 14 June 28 July 12 July 26
August 09
User
Date (Month Day)
valid user (questionnaire and 14 days min.) invalid user (no questionnaire or/and 14 days min.)
crowsensing applications is just an opportunistic exploitation of Android. Therefore some measures on some particular phones/OS crash the application and some system policies stop the sensing application thus creating logs discontinuity. So we learned some lesson about technical problems with Android and we implemented these remedial methods to increase data continuity:
Decoupling task from sensing application: The sensing
intelligence in our implementation lies in the script and the sensing application is kept as generic as possible. Therefore if collecting a particular data seems problematic for a partic-ular model/OS, only a customized script can be deployed to continue collecting other possible data except that problematic field.
Error logging: In our sensing application we also
imple-mented a library called Sentry5 for real-time error logging.
We are deploying a mechanism for real-time error diagnostics i.e. upon analyzing error logs/anomalies in data, the sensing server pushes a task such as reboot/script update to the phone. The goal is to prevent the sensing application from crashing and ensuring continuous sensing.
Data irregularity is also due to human factors, for ex-ample users intentionally/unintentionally turning off the phone/sensing application, battery running out and the user not carrying the charger etc. Such discontinuities due to human factors can be difficult to interpret by itself and often require detailed analysis and combination of context information, examples of which are presented in detail in the next section.
IV. HOW CONTEXT INFORMATION ENHANCES ANALYSIS OF CROWDSENSED DATA
In this section we describe the process of adding context information to better interpret crowdsensed data. We illustrate this using examples of two participants from our dataset i.e.
User 30 whose usage follows a regular pattern and User 1,
whose usage on the other hand is usually irregular.
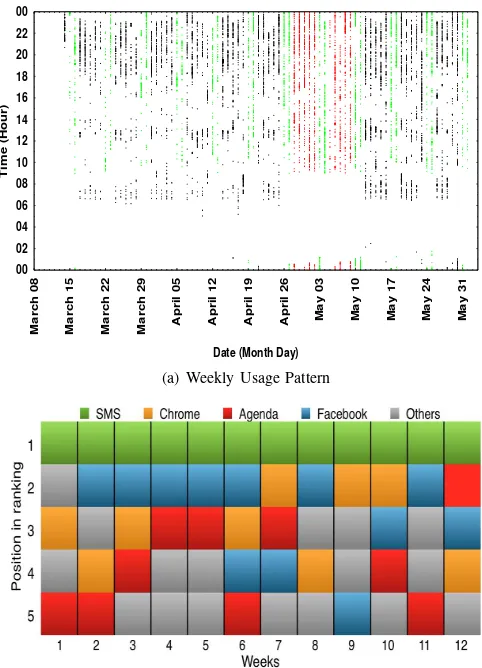
Figure 3a shows the weekly smartphone usage pattern of User 30. The x-axis represents the week and the y-axis denotes the hour of the day, while the dots/lines indicate usage sessions and absence of dots implies no usage. The green dots/lines corre-spond to usage during weekends and the rest are usage during weekdays. Among the weekdays we can identify two sets of patterns which are marked in black and red. During a typical week in black, the periods of usage are usually between 6-8h, 12-14h and 18-22h and this pattern is roughly similar over the weeks colored black. This suggests that this user perhaps has a regular activity i.e. could be a student/professional (which we can’t validate without further information) and probably has regular hours of work and leisure. However the usage pattern in black suddenly changes to another pattern during two weeks (indicated in red between 28 Apr-9 May), during which the usage starts a bit later than usual i.e. around 9 o’clock instead of 6 o’clock and there aren’t the breaks in usage between 8h-12h and 14h-18h. This indicates a probable change of work/professional routine during those two weeks which likely causes a change in smartphone usage pattern. However there could be a lot of possible interpretations which cannot be pinpointed without additional information.
5http://sentry.readthedocs.org/
00 02 04 06 08 10 12 14 16 18 20 22 00
March 08 March 15 March 22 March 29 April 05 April 12 April 19 April 26
May 03 May 10 May 17 May 24 May 31
Time (Hour)
Date (Month Day)
(a) Weekly Usage Pattern
(b) Top 5 Applications used per week in terms of usage frequency
Fig. 3: User 30 Weekly Usage
Similarly if more information such as application usage pattern is combined with temporal usage pattern, it draws nearer towards a valid conclusion. Figure 3b shows the weekly Top 5 application in terms of usage frequency for user 30. The high-lighted applications i.e. SMS, Chrome, Agenda(Calendar)
and Facebook ranks regularly on the top 5 list, except that
Agenda is absent during week 8 and 9 which are also the two weeks with different usage pattern, as marked in red on the graph. This affirms that during these two weeks the person wasn’t involved in his/her regular schedule so probably could’ve been sick or on vacation or for some reason was absent from professional schedule which we can’t know by combining all the smartphone usage data we collected by crowdsensing.
Therefore to correctly infer about the change of usage pattern during those two weeks, we can add some context information obtained via questionnaire (as discussed in part 3). Unlike many crowdsensing studies, we don’t use geo-localisation in order to respect privacy. However other anonymous contextual information such as geographic, demographic, professional
some background information about the academic calendar of engineering schools of that region, it readily confirms that week 8 and 9 were indeed periods of academic vacation for user 30 which caused a change in his lifestyle i.e. a more relaxed schedule compared to school weeks and consequently his smartphone usage pattern changed.
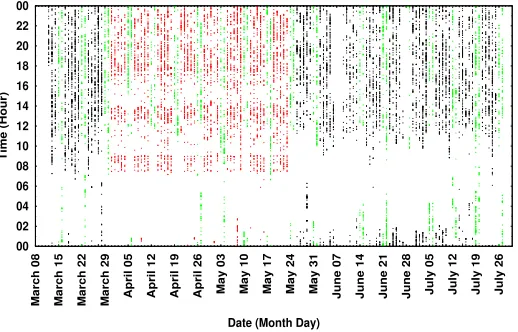
Similarly Figure 4 shows the usage pattern for User 1. Contrary to user 30, only a minority of the weeks of user 1 follow a regular daily usage pattern, which are marked in red. As this is a more unstructured user, the Top5 applications don’t have a particular pattern like user 30 so we don’t show it. Therefore the possible reasons for this sudden appearance of regularity is even harder to determine for user 1. Fortunately when we add contextual information similar to user 30, we come to know that this user is a female, student of Communication and Media studies and aged 19 years, so probably in her second year of bachelor studies. These information lead us towards finding the corresponding background information about the academic calendar, which reveals that the 8 weeks marked in red coincide with the period of internship, which is obligatory for 2nd year students in that field of study. Thus during usual academic period, this user uses her smartphone a bit irregularly all throughout the day and even during class hours. Whereas during periods of internship her lifestyle possibly becomes more organized which causes a more regular smartphone usage pattern.
Thus we can see that data obtained via questionnaire adds a lot of context information and can enormously simplify the task of correctly interpreting crowdsensing data.
V. USER PERCEPTION ANALYSIS BY COMBINING SENSING AND SURVEY
A. User perception about smartphone Usage
In the last section we presented how factual context infor-mation (demographic, geographic, professional) collected via questionnaire facilitates interpretation of crowdsensed data. In this section we analyze answers from the questionnaire which provide subjective information regarding user perception, cog-nition and social representations about smartphone usage.
00 02 04 06 08 10 12 14 16 18 20 22 00
March 08 March 15 March 22 March 29 April 05 April 12 April 19 April 26
May 03 May 10 May 17 May 24 May 31 June 07 June 14 June 21 June 28 July 05 July 12 July 19 July 26
Time (Hour)
Date (Month Day)
Fig. 4: Weekly Smartphone Usage Pattern of User 1
Furthermore we combine this subjective data with comparable data collected via crowdsensing, which reveals interesting dis-crepancy between user perception and their actual smartphone usage obtained from crowdsensing logs.
For our analysis we consider the 3 following questions on the Mutiple Choice Questionnaire concerning the basic use of the smartphone and compare the actual smartphone usage (calcu-lated from the logs obtained via crowdsensing) with the range chosen on the questionnaire. Therefore if the actual usage falls within the same range as declared on the questionnaire, the estimation is considered as a correct estimation or otherwise an under or overestimation respectively.
Q1) How much time daily do you spend on your smartphone ?
Answer Choices: <15 min; 15-30 min; 30-45 min; 45 min-1h; 1-3h; > 3h
Q2) How many different applications on average do you use daily ?
Answer Choices: 1-2; 3-5; > 5
Q3) How many applications are there on your phone ? Answer Choices: 1-20; 20-40; 40-80; > 80
Over Correct Under %Error %Error due
to underest.
Q1 1 17 17 51.43 94.44
Q2 0 15 20 57.14 100
Q3a 0 6 29 82.86 100
Q3b 3 17 15 51.43 83.33
TABLE II: Comparison of Declared vs Actual Usage of the 35 users
B. Analysis of discrepancy between Questionnaire and Sens-ing values
Usage underestimation and Self-Image:Table II presents the
number of users out of the total 35 users making overestima-tion, correct estimation and underestimation for each question. For question 1 almost half of the participants estimated their daily smartphone usage correctly while the other half underes-timated. A similar pattern follows for Question 2 i.e. roughly 43% estimated correctly about the number of applications used daily and similarly all of the wrong estimations were due to underestimation. We discuss Question 3 in detail further, but again for this question, most of the wrong answers are underestimation. This trend of underestimation is coherent with consolidated studies in sociology [12] and [13], which found that users tend to underestimate watching television, as television has a negative cultural connotation in France and on the contrary tend to overestimate reading books, which is culturally more appreciated. Following the same logic of watching television, overuse of smartphone is associated with negative image as suggested by scientific studies (sociology, psychology and medicine) and propagated in the media [14]. Therefore users usually don’t want to express a self-image of themselves as overdependent or addicted to smartphones which is a plausible interpretation of this general underestimation.
Multiple Choice Questions:Our dataset shows another
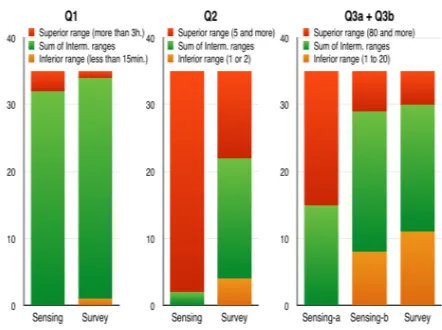
Questions (MCQs) that contributes to underestimation. We chose MCQs on smartphone instead of open-ended questions for ergonomic and efficiency reasons (i.e. difficulty to type in answers on a small device). In Figure 3 the red part of each histogram denotes the number of users selecting the highest answer choice of each Multiple Choice Question while the yellow part shows users choosing the lowest answer choice and the green part represents the number of users opting for all other choices between the highest and the lowest.
For all the 3 questions, most of the extreme choices (highest and lowest) are quite lower for survey compared to sensing, which relates to an interesting phenomena regarding selecting answers on a survey questionnaire. For example for question 2 the ranges given are quite low as being the number of applications used everyday i.e. 1-2, 3-5 or over 5, so we expected the majority of users to choose the last answer i.e. over 5. However, as shown by opinion studies, users generally avoid extreme values (for example: excellent or totally unsatisfactory) in a questionnaire, so even if something as obvious as the number of different applications used daily is generally more than 5 for a typical individual (as confirmed by crowdsensed data, red portion of Q2 left bar), a significant number of users selected the middle choice i.e. 3-5 apps per day.
Lastly for all the 3 questions the number of users choosing the maximum option on the questionnaire (red area) is less compared to sensing, which again confirms the previous point regarding self-image and usage underestimation. However our findings using MCQs differ from studies that use open self re-ports [9], where users generally overestimate their smartphone usage duration and it would be interesting to further investigate this aspect.
Question Comprehension:User perception about the
magni-tude/degree of any entity is also related to the comprehension and interpretation of the question. In question 3 we asked about the number of applications installed on his/her smart-phone which surprisingly gave a much higher error percentage (82% ref Q3a Table II) than for the first two questions. A possible reason for this increase is that the question does not give a definition of "application", so while answering users seem not to consider applications such as system and pre-installed applications for example: keyboard, launcher and
native applications. Most users tend to understand the term
application as something they themselves downloaded and installed from App Store. Therefore when we discounted all the applications tagged "App System" or pre-installed apps from the crowdsensed data of each user, we got a much lower error rate around 50 %, which is shown on Table II Q3b.
Estimation and enumeration strategies: On the other hand
while answering Question 3, we believe most users used enumeration strategy [15] rather than estimation strategy [16]. If enumeration strategy is used, the responder could simply minimize the questionnaire application and look at the number of icons on each window of his phone and count the number of windows to easily choose the correct range. Instead, as can be understood from the amount of uncorrect answers, users seem to use their memory/general perception about what is an application and make a guess about the total number of applications based on the number of applications used regularly.
Fig. 5: Number of users selecting the lowest, highest or in-between choices
In the next section we discuss that combining survey with sensing and analyzing the difference between perceived and measured values can be used to improve both survey and crowdsensing methods and applied to interesting use cases such as studying and improving the control over technology use.
VI. DISCUSSION
A. Methodological Implications of combining sensing with questionnaire
Questionnaire Construction:In the last section we discussed
that although MCQs are ergonomically feasible on smart-phones, but they have some inherent bias. Our comparison results showed that such biases can be associated with ranges i.e. users don’t usually select extreme choices on a survey questionnaire even if it is obvious. The effect of this bias can be reduced if the values which are least likely to occur are put at the extremes among the answer choices.
Data Analysis:In the last section we also showed that question
wording and comprehension can make a significant difference to the correctness of user response. We could identify the prob-lem of not clarifying the term "application" by comparison and some permutation/combination of obtained logs. This finding shows how user perception obtained through the questionnaire helps in analyzing and processing crowdsensing logs. Without the knowledge of user perception, we perhaps wouldn’t have been able to make the important distinction between installed and native applications and process the crowdsensing logs accordingly. This can also be extended to formulate questions by keeping a logical relation between one question and another so that the answers to one question or corresponding logs can logically validate or weaken the response to another question and vice versa.
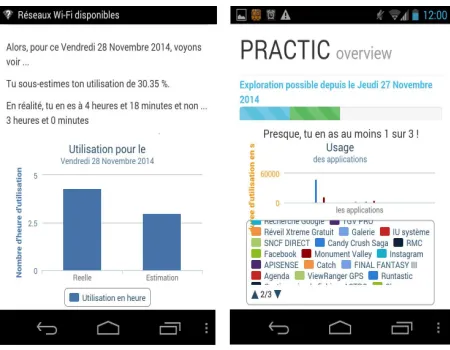
Fig. 6: Application Evaluating Perceived vs Actual Usage
upon detecting a drastic change in usage pattern, the user can be sent a questionnaire to again provide some context information which will help better interpret the change. In the next subsection we discuss an interesting use case of repetitively combining sensing with survey.
B. Example Application of combining sensing with question-naire
Dependence on technology is a growing problem in recent times and to develop a better control of their usage, users need to be conscious of their level of usage/dependence. Figure 6 shows our crowdsensing application which shows the difference between the value declared by the user at the start of the day and the actual usage at the end of the day. The message on the left screen which is in French, translates to English as:For Friday 28 Nov, 2014, you underestimated your usage by 30.35 %. You actually used 4h 18 min instead of the predicted value 3h. The right screen shows the statistics of usage of different applications. As we discussed in the last section, users don’t want to perceive themselves as dependent on technology. Therefore it would be interesting to study the change in usage behavior when the user is presented with facts proving the difference estimated and real usage and overall studying the gradual trend of difference between declared and actual usage over different cycles of analysis. Moreover users wishing to participate in such a crowdsensing study and can be rewarded with not only their own usage statistics but also their usage compared to other users in the same social context to develop a better judgment about his/her usage volume.
VII. CONCLUSION
Therefore in this paper we presented some results from our study based on a combination of crowdsending and survey. We discussed some technical problems we faced and some lessons learned during our crowdsensing experiment. Furthermore we showed how information regarding social context can be used for better interpretation of crowdsensed data. Next we selected some questions from the multiple choice survey questionnaire and combined the responses with crowdsensed data to analyze user perception about his/her smartphone usage and discussed
cognitive factors associated with reporting information on questionnaires. Moreover we showed that combining sensing with survey can improve both the techniques and the combi-nation has important use cases such as helping users to have a better understanding and control of their technology usage. Thus combining sensing with survey has significant benefits and can solve interesting problems so we intend to investigate further in this field.
REFERENCES
[1] J. A. Burke, D. Estrin, M. Hansen, A. Parker, N. Ramanathan, S. Reddy, and M. B. Srivastava, “Participatory sensing,” Center for Embedded Network Sensing, 2006.
[2] A. T. Campbell, S. B. Eisenman, N. D. Lane, E. Miluzzo, and R. A. Peterson, “People-centric urban sensing,” in Proceedings of the 2nd annual international workshop on Wireless internet. ACM, 2006, p. 18. [3] R. K. Ganti, F. Ye, and H. Lei, “Mobile crowdsensing: current state and future challenges,”Communications Magazine, IEEE, vol. 49, no. 11, pp. 32–39, 2011.
[4] H. Falaki, R. Mahajan, S. Kandula, D. Lymberopoulos, R. Govindan, and D. Estrin, “Diversity in smartphone usage,” inProceedings of the 8th International Conference on Mobile Systems, Applications, and Services, ser. MobiSys ’10. New York, NY, USA: ACM, 2010, pp. 179–194.
[5] T. M. T. Do, J. Blom, and D. Gatica-Perez, “Smartphone usage in the wild: A large-scale analysis of applications and context,” inProceedings of the 13th International Conference on Multimodal Interfaces, ser. ICMI ’11. New York, NY, USA: ACM, 2011, pp. 353–360. [6] C. Shepard, A. Rahmati, C. Tossell, L. Zhong, and P. Kortum,
“Live-lab: Measuring wireless networks and smartphone users in the field,”
SIGMETRICS Perform. Eval. Rev., vol. 38, no. 3, pp. 15–20, Jan. 2011. [7] Q. Xu, J. Erman, A. Gerber, Z. Mao, J. Pang, and S. Venkataraman, “Identifying diverse usage behaviors of smartphone apps,” in Proceed-ings of the 2011 ACM SIGCOMM Conference on Internet Measurement Conference, ser. IMC ’11. New York, NY, USA: ACM, 2011, pp. 329– 344.
[8] S. Nylander, T. Lundquist, A. Brännström, and B. Karlson, ““it’s just easier with the phone” – a diary study of internet access from cell phones,” in Pervasive Computing, ser. Lecture Notes in Computer Science, H. Tokuda, M. Beigl, A. Friday, A. Brush, and Y. Tobe, Eds. Springer Berlin Heidelberg, 2009, vol. 5538, pp. 354–371.
[9] T. Kobayashi and J. Boase, “No such effect? the implications of measurement error in self-report measures of mobile communication use,” Communication Methods and Measures, vol. 6, no. 2, pp. 126– 143, 2012.
[10] M. V. Abeele, K. Beullens, and K. Roe, “Measuring mobile phone use: Gender, age and real usage level in relation to the accuracy and validity of self-reported mobile phone use,”Mobile Media & Communication, vol. 1, no. 2, pp. 213–236, 2013.
[11] N. Haderer, R. Rouvoy, and L. Seinturier, “Dynamic deployment of sensing experiments in the wild using smartphones,” in Distributed Applications and Interoperable Systems. Springer, 2013, pp. 43–56. [12] P. Bourdieu,Distinction: A Social Critique of the Judgement of Taste,
ser. Routledge Classics. Taylor & Francis, 2013.
[13] M. Grenfell and F. e. Lebaron,Bourdieu and Data Analysis: Method-ological Principles and Practice, ser. Routledge Classics. Peter Lang, 2014.
[14] E. Harmon and M. Mazmanian, “Stories of the smartphone in everyday discourse: Conflict, tension & instability,” inProceedings of the SIGCHI Conference on Human Factors in Computing Systems. ACM, 2013, pp. 1051–1060.
[15] N. R. Brown, “Context memory and the selection of frequency es-timation strategies.” Journal of Experimental Psychology: Learning, Memory, and Cognition, vol. 23, no. 4, p. 898, 1997.
[16] N. Schwarz, “Self-reports: how the questions shape the answers.”