Experimental drought reduces the transfer of recently fixed plant
carbon to soil microbes and alters the bacterial community
composition in a mountain meadow
Lucia Fuchslueger
1, Michael Bahn
2, Karina Fritz
2, Roland Hasibeder
2and Andreas Richter
1 1Department of Microbiology and Ecosystem Science, University of Vienna, Althanstr. 14, A-1090 Vienna, Austria;2Institute of Ecology, University of Innsbruck, Innsbruck, Austria
Authors for correspondence:
Lucia Fuchslueger Tel: +43 1 4277 76666
Email: [email protected]
Andreas Richter Tel: +43 1 4277 76660
Email: [email protected]
Received:18 July 2013
Accepted:24 September 2013
New Phytologist(2013) doi: 10.1111/nph.12569
Key words: 13C pulse-labelling, carbon allocation, drought, microbial community composition, mountain grassland, mowing, phospholipid fatty acids.
Summary
Drought affects plants and soil microorganisms, but it is still not clear how it alters the car-bon (C) transfer at the plant–microbial interface. Here, we tested direct and indirect effects of drought on soil microbes and microbial turnover of recent plant-derived C in a mountain meadow.
Microbial community composition was assessed using phospholipid fatty acids (PLFAs); the allocation of recent plant-derived C to microbial groups was analysed by pulse-labelling of canopy sections with13CO2and the subsequent tracing of the label into microbial PLFAs. Microbial biomass was significantly higher in plots exposed to a severe experimental drought. In addition, drought induced a shift of the microbial community composition, mainly driven by an increase of Gram-positive bacteria. Drought reduced belowground C allocation, but not the transfer of recently plant-assimilated C to fungi, and in particular reduced tracer uptake by bacteria. This was accompanied by an increase of13C in the extractable organic C pool during drought, which was even more pronounced after plots were mown.
We conclude that drought weakened the link between plant and bacterial, but not fungal, C turnover, and facilitated the growth of potentially slow-growing, drought-adapted soil microbes, such as Gram-positive bacteria.
Introduction
Drought has the potential to lead to severe imbalances in the ter-restrial carbon (C) cycle, by affecting the production of organic matter by plants and decomposition by microorganisms (Ciais
et al., 2005; Schwalm et al., 2010; Reichstein et al., 2013). Drought directly alters the physical environment for soil micro-organisms and plants: it decreases soil water content and concom-itantly increases the proportion of oxygen-filled soil pores (Schimel et al., 2007; Manzoni et al., 2012a; Moyano et al., 2013); it reduces the mobility of nutrients in the soil, thereby dis-connecting organisms from substrates, while nutrient concentra-tions in the remaining soil water increase (Schjønning et al., 2003; Schimel et al., 2007). Thus, drought has a strong but equivocal effect on nutrient availability.
The response of a microbial community to drought depends on the physiological tolerance and metabolic flexibility of the constituent microbes (Allison & Martiny, 2008). Generally, fungi are thought to be more tolerant to dry periods than bacte-ria (Schimel et al., 2007; Strickland & Rousk, 2010; Manzoni
et al., 2012a). They are able to create large hyphal networks that facilitate nutrient and water transfer over long distances, and to explore water-filled soil pores not accessible for plant roots (Allen, 2007; Joergensen & Wichern, 2008), and they have
lower nutrient requirements than bacteria (Strickland & Rousk, 2010). Mycorrhizal fungi are directly connected to plant roots from which they obtain recently assimilated C (10–30% of the net primary production; Allen, 2007; Jones et al., 2009; de Deynet al., 2011). Mycorrhizas can even enhance water supply for plants during drought by taking up water from smaller soil pores (Wardleet al., 2004; Allen, 2007). Soil ecosystems domi-nated by fungi may therefore be considered to be less sensitive to drought than bacteria-dominated soils (Yuste et al., 2011; de Vrieset al., 2012).
Bacteria, however, are expected to inhabit smaller soil pores, and may be protected for longer from desiccation (Moyanoet al., 2013); nonetheless, they have to balance the increasing osmotic potential of the soil solution (Schimelet al., 2007). Alternatively, they can endure unfavourable conditions by shifting to dormancy or producing cysts (Schimelet al., 2007; Lennon & Jones, 2011). Gram-positive bacteria appear to be more resistant to drought than Gram-negative bacteria, because of their thicker peptidogly-can cell wall layer (Schimelet al., 2007; Manzoniet al., 2012a). Genera of Gram-positive bacteria (e.g. Firmicutes) have been termed ‘drought-adapted generalists’ (Lennonet al., 2012). Over-all, drought may select for more resistant microbial groups, which can result in the shift of an existing microbial community (Castro
et al., 2010), and affect microbial-driven ecosystem functions by
Ó2013 The Authors
New PhytologistÓ2013 New Phytologist Trust
changing their activities (Schimelet al., 2007; Allison & Martiny, 2008; Lennon & Jones, 2011; Wallenstein & Hall, 2012).
In addition to direct physical effects, drought can affect soil microbes by altering the input of plant C into the rhizosphere (Bardgettet al., 2008). On the one hand, drought may alter fine-root turnover (Chaves et al., 2003), and on the other hand drought may affect the input of root exudates (including secre-tions, lysates from border cells and mucilage; see Jones et al., 2009). Root exudates represent an important source of organic C for soil microorganisms in the rhizosphere and enhance soil organic matter decomposition (i.e. the ‘priming effect’; e.g. Fon-taine et al., 2003; Kuzyakov, 2010), which in turn makes nutri-ents accessible for microbial as well as for plant uptake. During drought periods, plants may alter belowground C allocation (Chaves et al., 2003; Ruehr et al., 2009; Albert et al., 2011; McDowell, 2011; Manzoni et al., 2012b). This may severely affect the quantity and quality of C available for soil microbes in the rhizosphere, such as fungi and Gram-negative bacteria, which seem to be tightly connected to recently assimilated plant C (Denef et al., 2009; de Deyn et al., 2011; Bahn et al., 2013). Nevertheless, it is not clear how drought affects processes at the root–soil interface (Bardgettet al., 2008; Compantet al., 2010; Sanaullah et al., 2011). Moreover, it is poorly understood how drought affects belowground C allocation in usually well-watered ecosystems, such as grasslands in the European Alps (Wieser
et al., 2008), which are predicted to experience more frequent drought periods in the near future (Sch€ar et al., 2004; IPCC, 2007; Seneviratneet al., 2010).
In many European grasslands, mowing, that is, clipping and subsequent harvesting of aboveground plant biomass, is a mon management practice and shapes plant and microbial com-munities, as well as nutrient composition in the soil (Bardgett
et al., 2001; Klumpp et al., 2011; de Vries et al., 2012; Meyer
et al., 2012; Shahzad et al., 2012). In contrast to drought, mowing is an immediate disturbance, abruptly changing the soil microclimate (Bahn et al., 2006) and C input, as plant roots release a pulse of low-molecular-weight compounds (Paterson & Sim, 1999; Hamiltonet al., 2008; Henryet al., 2008). This has been shown to induce a transient increase in microbial nitrogen (N) mineralization, allowing the higher N demand of plants to be met to rebuild biomass (Paterson & Sim, 1999; Hamilton
et al., 2008; Henry et al., 2008; Cheng et al., 2011; Shahzad
et al., 2012). It is, however, still unexplored whether drought alters such effects of mowing, but it may be speculated that plants under drought conditions may have lower nonstructural C reserves, potentially decreasing the intensity of the C pulse.
In this study, we therefore aimed to assess the direct and indi-rect plant-mediated effects of a severe summer drought on micro-bial processes and community composition in a mountain meadow. We asked the questions of how drought under field conditions affects the biomass of plants and the abundance of microbial groups, how it affects the transfer of C from plants to microbes, and how it alters short-term C turnover in grasslands after mowing. Specifically, we hypothesized that drought decreases plant C pools, thereby reducing the availability of recently fixed plant C for microbes in the rhizosphere; and that,
overall, drought decreases microbial biomass, reducing the abun-dance of bacteria more strongly than that of fungi. Finally, we hypothesized that drought reduces the pulse of recently assimi-lated C to the soil after mowing compared with controls. We experimentally simulated an extended drought period in a moun-tain meadow in the Austrian Central Alps. Soil microbial biomass and community composition were determined using phospho-lipid fatty acids (PLFAs). To investigate the allocation of recently assimilated C to microbial biomass, we pulse-labelled plants with
13CO
2 and traced labelled C from plants via the extractable
organic C (EOC) pool to microbial PLFAs. Both controls and drought plots were mown towards the end of experimental drought and after labelling.
Materials and Methods
Study site
The study area was located in the Austrian Central Alps near Neustift, Stubai Valley (47°07′45″N, 11°18′20″E); the sampling site, a mountain meadow, was situated at 1850 m above sea level. Mean annual temperature wasc.3.0°C; mean annual precipita-tion was c. 1097 mm. Soils were classified as dystric cambisols (Food and Agriculture Organization of the United Nations, soil classification system) with a pH (in CaCl2) of 4.9 (Meyeret al.,
2012). The study site is characterized by high plant productivity, with peak above- and belowground biomasses ranging between 240 and 440 g m 2and between 420 and 980 g m 2, respec-tively (Bahnet al., 2006; Schmittet al., 2010), as well as compar-atively high soil respiration rates (Bahn et al., 2010). The experimental site was part of a meadow that is briefly grazed by cattle in spring and autumn, and cut for haying once a year at the end of July. The vegetation is dominated by perennial grasses and herbs including Anthoxanthum odoratum L., Festuca rubra L.,
Alchemilla vulgarisL.,Leontodon hispidusL. andTrifolium repens
L. (Bahnet al., 2009; Schmittet al., 2010).
Experimental set-up
We simulated an extended summer drought event by installing rain-out shelters (3.093.5 m;n=3) with light- and
UV-B-per-meable plastic foil (UV B Window; Folitec GmbH, Westerburg, Germany; light permeabilityc.95%; UV-B permeability>70%) to exclude any precipitation. In the centre of each shelter as well as in nearby established controls, plastic frames (191 m) were
temperature (Tsoil) (S-TMB-M006 with HOBO Micro Station
Data Logger H21-002; Onset Computer Corp., Bourne, MA, USA) and soil water content (SWC; ECH2O EC-5 with data Logger EM50; Decagon Devices Inc., Pullman, WA, USA) at 5 and 10 cm soil depth were continuously monitored throughout the experiment. A similar drought simulation was conducted at the same plots in the previous year.
Labelling procedure
Pulse labelling with13CO2was conducted after at least 6 wk of
drought simulation on three individual days with high radiation to ensure high uptake of labelled CO2into plants (Supporting
Information Table S1). Per labelling day, a set of drought and control plots were equipped with plexiglass chambers (19190.7 m; 95% light permeability), which were placed on
previously installed plastic frames (see Bahnet al., 2009, 2013). After 10 min of equilibration, 13CO2 (>99.9% CO2 with 99
atom-% 13C; Cambridge Isotope Laboratories, Andover, MA, USA) was added over a period of 90 min, which has been shown to ensure sufficient 13C uptake for detecting 13C in microbial PLFAs (Bahnet al., 2013).
Sample collection
Samples of plant biomass (aboveground biomass and fine roots) and soil were taken 1, 6, 7 and 8 wk (which was after mowing) after installation of rain-out shelters, as well as 1 wk after rewett-ing. For the pulse-labelling experiment, we took plant and soil samples 1 h before labelling to determine the natural background
d13C of plant biomass and soil (Table S2). We started sampling directly after the labelling procedure (at 0, 2 and 6 h), and con-tinued on the following days (at 24, 48, 96 and 192 h). Then the study site was mown and aboveground biomass harvested. We
took soil samples after mowing, and subsequently all plots were rewetted and sampling was continued (24, 72 and 192 h after rewetting). For each plant and soil sample, we pooled material from two soil collars with an area of 597 cm and a depth of
10 cm. The aboveground biomass was cut, and immediately treated by microwave for 3 min to interrupt any metabolic activi-ties in plants (Popp et al., 1996). Soil was carefully sieved to 2 mm, manually freed from roots, which were collected (fine-root biomass), washed and also treated by microwave. Aliquots of soil samples for extraction of PLFAs were immediately frozen at 80°C, and remaining soil was stored at 4°C until further processing. Plant material and soil aliquots were dried (for 72 h at 60°C) and finely ground for subsequent analyses of bulk13C content by EA-IRMS (elemental analysis-isotope ratio mass spectrometry; EA 1110 (CE Instruments, Milan, Italy), coupled to a Finnigan MAT Delta Plus IRMS (Thermo Fisher Scientific, Waltham, MA, USA)).
Determination of C and N pools in the soil
Extractable organic carbon (EOC) and total extractable nitrogen (TEN) were measured in K2SO4extracts (2 g of fresh soil was
extracted with 20 ml of 0.5M K2SO4) using a Total Organic
Carbon/Total Nitrogen (TOC/TN) analyser (TOC-V CPH E200V/TNM-122V; Shimadzu, Vienna, Austria). Aliquots of K2SO4 extracts were used to determine the d13C of EOC,
measured by direct injection (without column, direct mode) on high-performance liquid chromatography-isotope ratio mass spectrometry (HPLC-IRMS) (Dionex Corporation, Sunnyvale, CA, USA) linked to a Finnigan Delta V Advantage Mass Spec-trometer connected by a Finnigan LC-IsoLink Interface (both Thermo Fisher Scientific, Waltham, MA, USA) at a flow of 0.5 ml water min 1. NH4+was determined photometrically by a
modified indophenol reaction method (Kandeler & Gerber,
(a)
(b)
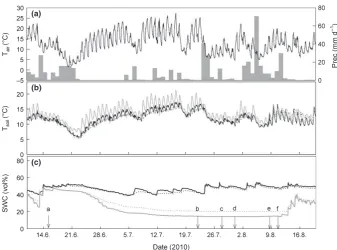
(c) Fig. 1Microclimate during the drought
experiment: (a) air temperature (Tair; in°C 0.5 h 1) and precipitation (prec; in mm d 1); (b) soil temperature (Tsoil; in°C 0.5 h 1) and (c) volumetric soil water content (SWC; in %) at 5 (solid lines) and 10 cm soil depth (dotted lines) in control (black) and drought (grey) plots. Arrows with lowercase letters in (c) indicate dates of action: ‘a’ marks the beginning of the drought treatment; ‘b’, ‘c’ and ‘d’ indicate dates of pulse-labelling; ‘e’ indicates mowing and ‘f’ indicates rewetting and thus the end of the drought treatment.
1988) in K2SO4extracts. NO3 was determined in water extracts
(2 g of fresh soil was extracted with 20 ml of water) by chemically suppressed ion chromatography (DX500; Dionex, Vienna, Aus-tria) on a Dionex AS11 column.
Soil microbial biomass
Soil microbial biomass was estimated using PLFAs, which were extracted from frozen soil samples as described in Kaiser et al.
(2010). Briefly, total lipids were extracted from soil with chloro-form/methanol/citric acid buffer and cleaned from neutral lipids using silica columns (LC-Si SPE; Supleco, Bellefonte, PA, USA) and chloroform, acetone and methanol. After addition of an internal standard (19:0), PLFAs were converted to fatty acid methyl esters (FAMEs) by alkaline methanloysis. Samples were analysed by gas chromatography using Trace GC Ultra connected with a GC-IsoLink to a Delta V Advantage Mass Spectrometer (both Thermo Fisher Scientific). Samples were injected in splitless mode (injector temperature: 230°C) and separated using a DB23 column (60 m90.25 mm90.25lm;
Agilent, Vienna, Austria) with 1.5 ml min 1He as the carrier gas (GC programme: 1.5 min at 70°C, 30°C min 1to 150°C, 1 min at 150°C, 4°C min 1to 230°C, 15 min at 230°C). To identify single FAMEs, bacterial and fungal FAME mixtures (bacterial acid methyl ester mix and 37 Comp. FAME Mix; Supelco) were used; FAMEs were quantified against the internal standard (19:0). The concentrations and d13C values of the identified FAMEs were corrected for the methyl group that was added dur-ing methylation. The sum of all subsequently described PLFAs was used as a proxy for total microbial biomass. We used the sum of i15:0, a15:0, i16:0, a16:0 and a17:0 for Gram-positive bacteria, 16:1x7, 18:1x7, cy17:0(9/10) and cy19:0(9/10) for Gram-negative bacteria and 15:0, 17:1x6, 17:0, 18:1xs5 and 10Me18:0 as general bacterial markers. positive, Gram-negative and general bacterial markers were summed to give total bacteria (Bacteriatot). We separated total fungal PLFAs (Fungitot)
into a general fungal marker (Fungigen; 18:2x6,9, 18:1x9 and
18:3x3,6,9) and 16:1x5. The latter is often used as a marker for arbuscular mycorrhizal fungi, but also a marker for Gram-nega-tive bacteria, especially in ecosystems with high bacterial abun-dance (Zelles, 1997; Olsson, 2006).
Calculation of13C excess
The excess13C (in mg13C m 2), which was the total amount of
13C in the individual C pools (per 1 m 2), was calculated as:
excess13C¼ðatom%sample atom%nat abÞ Cpool
100
with atom%samplebeing the atom% of the labelled sample, atom
%nat abbeing the atom% of samples taken before labelling,
there-fore reflecting the natural 13C abundance of the samples (Table S2), and Cpool being the respective C pool (aboveground plant
biomass and fine roots, bulk soil, EOC and soil microbial biomass, in mg C m 2). Note that C pools for soil, EOC and PLFAs, as
well as for belowground biomass, were calculated only for the uppermost 10 cm of soil and were corrected for the respective soil bulk density (0.7580.03 and 0.7220.05 g cm 3for drought and control plots, respectively; meanSE;n=5).
Statistical analysis
For single sampling points, differences between drought plots and controls for plant biomass C pools, soil and microbial groups were evaluated using one-way ANOVA. Effects of drought treat-ment and time (weeks of drought for C and N pools) or time after labelling (hours after labelling/rewetting for13C excess data) were assessed using two-way repeated-measures ANOVA (level of significance: P<0.05). All data were tested for normality using the Shapiro–Wilk test, and for homoscedasticity using Levene’s test. If data did not meet the assumptions of ANOVA, they were log-transformed.
We conducted a canonical correspondence analysis (CCA; Anderson & Willis, 2003) to investigate the effects of abiotic parameters, including SWC andTair, as well as soil nutrient pools
(EOC, TEN, NH4+and NO3 pools) and time (day of the year
(DOY) and days of drought treatment (DOD)), on microbial community composition (using the relative abundance of all PLFAs) during the drought experiment (weeks 1, 6, 7 and 8 of drought and 1 wk after rewetting). The contribution of con-strained variability to total community variability was used as a measure of the influence of environmental parameters on com-munity variation. All statistical analyses were performed in R 2.15.2, using theVEGANpackage for CCA (Oksanenet al., 2012).
Results
Microclimatic conditions and soil water content
During the experiment (10 June to 20 August), mean daily air temperature (Tair) was 12.9°C, with a range from 1.8°C to
27.4°C (Fig. 1a). Mean daily soil temperature (Tsoil) at 10 cm soil
depth was similar in drought plots (12.8°C) compared with con-trols (11.9°C) but showed greater daily amplitudes (day versus night temperatures) in drought plots (Fig. 1b). The total amount of precipitation excluded during 8 wk of drought simulation summed up to 363 mm, equalling to one-third of mean annual precipitation. SWC in drought plots was already slightly lower before the drought simulation (Fig. 1c), possibly resulting from exposure to drought in the previous year. However, the drought simulation caused a gradual decrease of SWC from 48.4 to 14.1% at 5 cm soil depth, the main rooting horizon, while in controls SWC varied between 53.3 and 38.8% during the treat-ment period. After rewetting, SWC steeply increased in the drought plots, but was still lower than in controls (Fig. 1c).
Effects of drought on C pools in plants and soil
affected by the drought treatment, where mean aboveground bio-mass was 168 (35) g m 2and mean root biomass was 381 (
64) g m 2. Similar to biomass, neither the C content of above-ground biomass nor that of fine roots was altered by drought (Fig. S1a,d, Table 1a). Among all studied soil parameters, only NO3 was significantly decreased during drought, by 55.4%, but
this effect was not detectable after mowing (Fig. S1, Table 1a,b).
Effects of drought on soil microbes
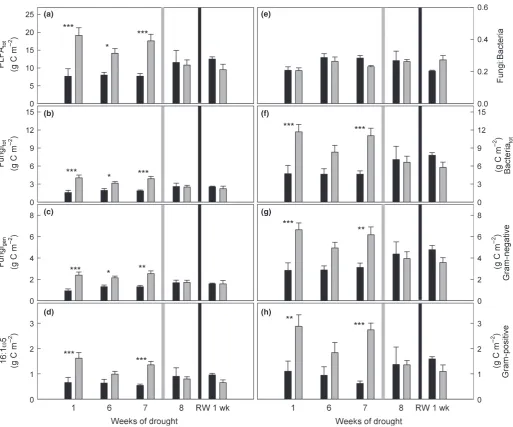
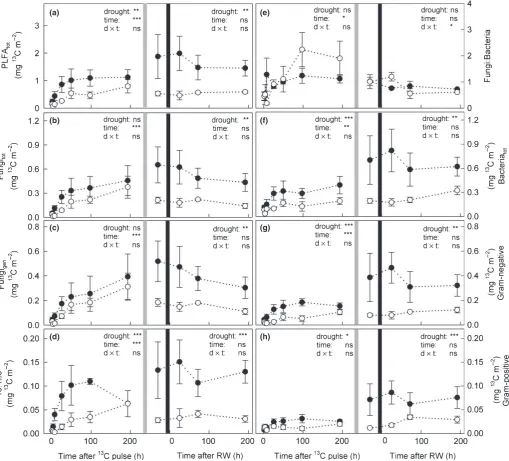
In drought-treated plots, total PLFAs were already significantly higher (+116.2%) compared with controls 1 wk after the begin-ning of the experiment and stayed at a constant higher level until mowing (Fig. 2a, Table 1a). This was similar for all microbial groups, but most pronounced for Gram-positive bacteria, which increased almost threefold compared with controls (+181.7%; Table 1a). The amounts of Gram-negative bacteria and total fungi were two-fold higher in drought plots than in controls (Fig. 2g, Table 1a); within fungal PLFAs, the marker 16:1x5 showed the highest increases (Fig. 2d, Table 1a). Nevertheless, the ratio of fungal:bacterial PLFAs was not affected by the drought treatment (Fig. 2e, Table 1a). Interestingly, we found a strong decrease of total PLFAs by 37% (t-test; P=0.045) after mowing in the drought plots, while PLFAs in control plots were not affected (Fig. 2). Rewetting affected PLFAs neither in drought nor in control plots (Fig. 2, Table 1b).
We conducted a CCA to assess the effects of drought on the microbial community composition (Fig. 3). We used the relative abundances of all sampled PLFAs as the community matrix and DOY, DOD, SWC, Tsoil, and EOC, TEN, NH4+and NO3
pools as the environmental matrix. The contribution of the envi-ronmental variables (constrained variability) to the total variabil-ity of the microbial communvariabil-ity matrix was 35%, of which CCA axis 1 (CCA1) accounted for 60% (P=0.005) and CCA axis 2 (CCA2) for 15% (P=0.13); thus, CCA1 accounted for 21% and CCA2 for 5% of total variability. We found that CCA1 showed a high correlation with DOY,Tsoiland NH4+(Fig. 3a);
therefore, CCA1 could describe a seasonal gradient during the experiment, reflected by a distribution of the samplings along CCA1 (weeks 1–8 of drought, RW, 1 wk after rewetting; Fig. 3b). CCA2 displayed a gradient of SWC and showed a high correlation with DOD (Fig. 3a,b), showing the effects of the drought treatment on the microbial community composition. The drought-induced shift (CCA2) of the soil microbial compo-sition was mainly driven by the distribution of Gram-positive and Gram-negative bacterial PLFA markers. Gram-positive bac-teria correlated with higher EOC and TEN, and lower SWC, while Gram-negative bacteria correlated with higher SWC and NO3 . Fungal markers, by contrast, were not separated by SWC,
but by NH4+andTsoil(Fig. 3a).
Effects of drought on C dynamics of plant, soil and microbial C pools
In both controls and drought-treated plots,13C in aboveground biomass peaked within 24 h after labelling (432.1151.0 and 263.7135.2 mg13C m ², respectively; meanSE,n= 3) and then decreased exponentially over time (Fig. 4a). There was a trend towards higher mean residence time of13C in aboveground biomass in drought plots, but differences compared with controls
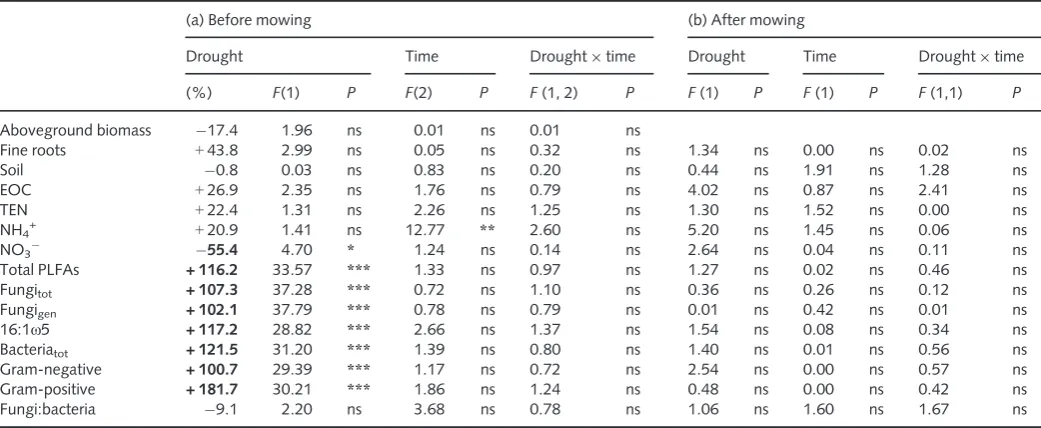
Table 1 Effects of drought, sampling time and the interaction term (drought9time) on carbon (C) and nitrogen (N) pools (a) before mowing, also given as percentage of controls, calculated from mean values for data obtained during drought treatment until mowing, and (b) after mowing, evaluated by two-way repeated-measures ANOVA
(a) Before mowing (b) After mowing
Drought Time Drought9time Drought Time Drought9time
(%) F(1) P F(2) P F(1, 2) P F(1) P F(1) P F(1,1) P
Aboveground biomass 17.4 1.96 ns 0.01 ns 0.01 ns
Fine roots +43.8 2.99 ns 0.05 ns 0.32 ns 1.34 ns 0.00 ns 0.02 ns
Soil 0.8 0.03 ns 0.83 ns 0.20 ns 0.44 ns 1.91 ns 1.28 ns
EOC +26.9 2.35 ns 1.76 ns 0.79 ns 4.02 ns 0.87 ns 2.41 ns
TEN +22.4 1.31 ns 2.26 ns 1.25 ns 1.30 ns 1.52 ns 0.00 ns
NH4+ +20.9 1.41 ns 12.77 ** 2.60 ns 5.20 ns 1.45 ns 0.06 ns
NO3 55.4 4.70 * 1.24 ns 0.14 ns 2.64 ns 0.04 ns 0.11 ns
Total PLFAs + 116.2 33.57 *** 1.33 ns 0.97 ns 1.27 ns 0.02 ns 0.46 ns
Fungitot + 107.3 37.28 *** 0.72 ns 1.10 ns 0.36 ns 0.26 ns 0.12 ns
Fungigen + 102.1 37.79 *** 0.78 ns 0.79 ns 0.01 ns 0.42 ns 0.01 ns
16:1x5 + 117.2 28.82 *** 2.66 ns 1.37 ns 1.54 ns 0.08 ns 0.34 ns
Bacteriatot + 121.5 31.20 *** 1.39 ns 0.80 ns 1.40 ns 0.01 ns 0.56 ns
Gram-negative + 100.7 29.39 *** 1.17 ns 0.72 ns 2.54 ns 0.00 ns 0.57 ns
Gram-positive + 181.7 30.21 *** 1.86 ns 1.24 ns 0.48 ns 0.00 ns 0.42 ns
Fungi:bacteria 9.1 2.20 ns 3.68 ns 0.78 ns 1.06 ns 1.60 ns 1.67 ns
Before mowing,n=9 (for fine roots,n=6); after mowing,n=6. After mowing, no data for aboveground biomass were available. Values in bold show significant effects of drought calculated by one-way ANOVA. Asterisks indicate levels of significance (ns, not significant;*,P<0.05;**,P<0.01; ***,P<0.001).
Bacteriatot, total bacterial PLFAs; EOC, extractable organic carbon; Fungigen, general fungal PLFAs; Fungitot, total fungal PLFAs; PLFA, phospholipid fatty acid; TEN, total extractable nitrogen.
were not significant (Fig. 4a, Table 2a). Because mowing has to be considered as a major disturbance of C dynamics,13C turn-over was analysed separately before and after mowing by two-way repeated-measures ANOVA (Fig. 4b–d). During drought, before mowing, fine roots received significantly less 13C, while after mowing there was no difference compared with controls (Fig. 4c, Table 2a). Before mowing, 13C increased to the same extent in bulk soil of control and drought plots. After mowing and rewetting, however, the amount of13C in the bulk soil increased further in the controls and became significantly higher than in drought plots (Fig. 4b). In contrast to the controls, where the amount of13C in EOC increased only slightly, there was a signif-icant accumulation of13C in EOC in drought plots. Moreover,
we detected a pulse of 13C in EOC directly after mowing in drought plots, which decreased after rewetting, while the amount of13C in the controls constantly stayed at a low level (Fig. 4d).
Although microbial biomass was higher in drought plots (Fig. 2), the absolute amount of 13C incorporated into total PLFAs was significantly lower in drought plots compared with controls (Fig. 5a). This reduction during drought was most pro-nounced for Gram-negative bacteria, followed by the fungal marker 16:1x5 and Gram-positive bacteria (Fig. 5d,g,h). For the general fungal marker, in contrast, similar amounts of13C were incorporated in drought plots as in the controls (Fig. 5c). In both control and drought plots, we found a remarkably high ratio of fungal:bacterial 13C uptake (Fig. 5e), in contrast to the lower
(a)
(b)
(c)
(d)
(e)
(f)
(g)
(h)
(a) (b)
Fig. 3The effects of soil parameters and time on soil microbial community composition, as determined by canonical correspondence analysis (CCA). Relative abundances of phospholipid fatty acids (PLFAs) were used as the soil microbial community matrix, and soil parameters (gravimetric soil water content (SWC); soil temperature at 5 cm (Tsoil); extractable organic carbon (EOC); total extractable nitrogen (TEN); ammonium-N (NH4+); nitrate-N (NO3 )) and time (day of the year (DOY); days of drought (DOD) (dashed arrows)) were used as the environmental data matrix. Single PLFAs are coloured according to their attribution to microbial groups. The CCA is based on data from samples collected during drought (1, 6, 7 and 8 (after mowing) weeks of drought), as well as 1 wk after rewetting (RW). The contribution of constrained variability to total variability was 35%, of which CCA1 accounted for 60% and CCA2 for 15%. The significances of CCA1 and CCA2 wereP=0.005 andP=0.15, respectively (permutation test). (a) Biplot of the distribution of single PLFAs and environmental parameters. (b) The distribution of samples collected during drought and after rewetting in control (closed circles) and drought (open circles) plots; characters next to symbols identify the time of sampling (error bars indicate SE).
(a)
(b)
(c)
(d)
Fig. 413C excess (in mg13C m 2) after pulse-labelling in (a) aboveground plant biomass, (c) fine-root bulk biomass, (b) bulk soil and (d) the extractable organic carbon (C) pool in control (closed circles) and drought (open circles) plots;13C excess in (a) followed an exponential decay function (y
=a9e( k*x); witha=initial pool size,k=decay constant andx=time; control, solid line; drought, dashed line; mean residence time of13C (MRT)
=1/k).13C excesses for (b) and (d) were calculated for the uppermost 10 cm of soil. Light grey lines indicate mowing, and black lines indicate rewetting. Effects of drought on 13C excess were analysed separately before and after cutting by two-way repeated-measures ANOVA with time and drought treatment as factors (ns, not significant;*,P<0.05;**,P<0.01;***,P<0.001; for further details see Table 2).
fungi:bacteria PLFA ratio (Fig. 2e), indicating that fungi received a higher portion of plant-derived C compared with bacteria.
After mowing,13C in PLFAs in drought-treated plots stayed at a significantly lower level than in controls (Fig. 5a). This pattern was similar for all microbial groups, and also for fungal markers, where13C incorporation had not been affected by drought before mowing (Fig. 5b,c). This indicated that mowing caused a pulse of plant C in the soil, which in control plots was incorporated into PLFAs, but in drought plots was not taken up by microbes and accumulated in the EOC pool. However, mowing caused a significant decrease in microbial biomass in drought-treated plots and therefore dead microbes may also have substantially contrib-uted to this label peak in the EOC (Figs 2a, 4d).
Discussion
The probability of extreme events and drought periods is pre-dicted to increase in European mountain regions (IPCC, 2012), with potentially severe consequences for ecosystem C dynamics (Reichsteinet al., 2013). However, the effects of drought on eco-systems that are usually well supplied with water are not well understood. In this study, we demonstrate that under field condi-tions a severe summer drought period has the potential to weaken the coupling of plant and microbial C turnover in a mountain meadow.
Effects of drought on plant belowground C allocation
Drought is well known to strongly affect plant biomass and C pools, by increasing the proportion of fine-root biomass to sus-tain water uptake and photosynthesis, at the expense of above-ground C stocks (Chaves et al., 2003; McDowell, 2011). However, in our experiment, drought neither affected plant biomass, nor their C pools, probably because most of the plant
biomass was already largely established at the onset of drought. Nonetheless, drought significantly reduced the absolute amount of recently assimilated C in fine roots, without decreasing C uptake at the time of pulse labelling (Fig. 4c). Thus, drought may have slowed down plant C turnover, which was also found by others (Ruehr et al., 2009; Barthel et al., 2011; Br€uggemann
et al., 2011). However, 13C significantly increased in the EOC pool during drought, which suggests that plant roots may have maintained, or even increased root exudation or the release of mucilaginous material to decrease the friction resistance in the soil and keep the contact between roots and soil (Walkeret al., 2003).
Effects of drought on soil microbes
In contrast to our expectations, both fungal and bacterial PLFAs were higher in drought-treated plots than in controls. In addi-tion, we detected a shift of the microbial community composi-tion that occurred mainly within soil bacteria. We also observed that drought showed a distinct effect on the incorporation of plant-derived C into microbial PLFAs, specifically a reduction of label in bacteria. Fungal PLFAs were increased during drought and incorporated similar amounts of recent plant-derived C in drought plots as in controls (Fig. 5b). This corresponds well with the finding of Bahn et al. (2013) at the same study site, where even extended reductions in photosynthesis did not decrease the amount of recent plant C in fungal PLFAs. Thus, the transfer of
13C label from plants to fungi seemed not to be interrupted by
experimental drought. Of the four PLFAs used as fungal markers, only 16:1x5, often used as a marker for arbuscular mycorrhizas, showed a significant reduction in 13C incorporation during drought. This was in contrast to our expectations, as mycorrhizal fungi are a strong sink for plant-derived C in meadows (Denef
et al., 2009; Balasooriya et al., 2012) and may even promote
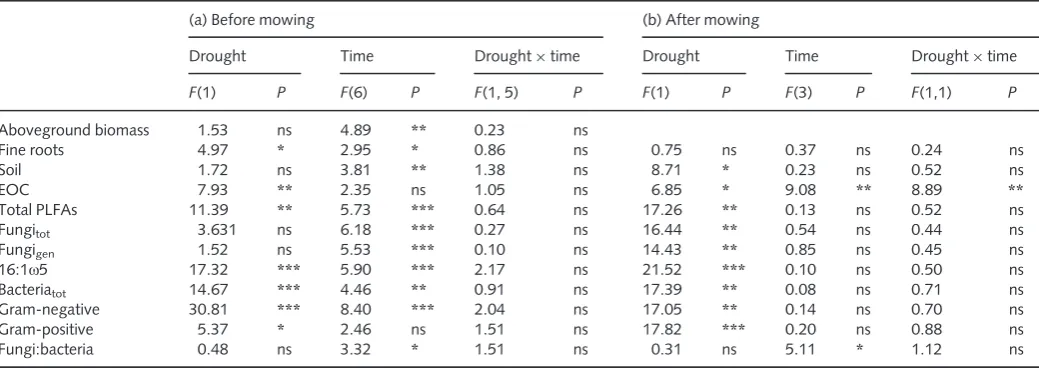
Table 2 Effects of drought on13C excess in all carbon (C) pools (a) before and (b) after mowing were analysed separately by two-way repeated-measures ANOVA
(a) Before mowing (b) After mowing
Drought Time Drought9time Drought Time Drought9time
F(1) P F(6) P F(1, 5) P F(1) P F(3) P F(1,1) P
Aboveground biomass 1.53 ns 4.89 ** 0.23 ns
Fine roots 4.97 * 2.95 * 0.86 ns 0.75 ns 0.37 ns 0.24 ns
Soil 1.72 ns 3.81 ** 1.38 ns 8.71 * 0.23 ns 0.52 ns
EOC 7.93 ** 2.35 ns 1.05 ns 6.85 * 9.08 ** 8.89 **
Total PLFAs 11.39 ** 5.73 *** 0.64 ns 17.26 ** 0.13 ns 0.52 ns
Fungitot 3.631 ns 6.18 *** 0.27 ns 16.44 ** 0.54 ns 0.44 ns
Fungigen 1.52 ns 5.53 *** 0.10 ns 14.43 ** 0.85 ns 0.45 ns
16:1x5 17.32 *** 5.90 *** 2.17 ns 21.52 *** 0.10 ns 0.50 ns
Bacteriatot 14.67 *** 4.46 ** 0.91 ns 17.39 ** 0.08 ns 0.71 ns
Gram-negative 30.81 *** 8.40 *** 2.04 ns 17.05 ** 0.14 ns 0.70 ns
Gram-positive 5.37 * 2.46 ns 1.51 ns 17.82 *** 0.20 ns 0.88 ns
Fungi:bacteria 0.48 ns 3.32 * 1.51 ns 0.31 ns 5.11 * 1.12 ns
Before mowing,n=42; after mowing,n=12. After mowing, no data for aboveground biomass were available. Asterisks indicate levels of significance (ns, not significant;*,P<0.05;**,P<0.01;***,P<0.001).
water uptake for plants during drought conditions (Wardleet al., 2004; Allen, 2007). However, this biomarker might not solely be representative of arbuscular mycorrhiza, as it was shown also to occur in bacterial taxa (Olsson, 2006).
All bacterial PLFAs were increased in experimental drought plots, but Gram-positive bacteria became relatively more abun-dant compared with Gram-negative bacteria. Gram-positive bac-teria are considered to be inherently more resistant to drought regarding their cell wall composition (Schimel et al., 2007; Manzoni et al., 2012a), and their abundance correlated with higher EOC and TEN (Fig. 3a). This is further evidence that, in
contrast to Gram-negative bacteria, Gram-positive bacteria may prefer more complex substrates and therefore could be classified as ‘dry-adapted generalists’ (Lennon et al., 2012). Many Gram-negative bacteria in turn seem to benefit from root or fungal exu-dates (Treonis et al., 2004; Olsson, 2006; Denef et al., 2009; Balasooriya et al., 2012; Bahn et al., 2013) and incorporated almost tenfold more recent plant C than Gram-positive bacteria, but both received significantly less13C during drought.
Thus, drought weakened the link between both Gram-positive and Gram-negative bacteria and plants, as indicated by a signifi-cantly lower absolute bacterial uptake of label and a concurrent
(a)
(b)
(c)
(d)
(e)
(f)
(g)
(h)
Fig. 513C excess (in mg13C m 2) after pulse-labelling in (a) total phospholipid fatty acids (PLFA
tot), and (b) total fungal (Fungitot) and (f) total bacterial (Bacteriatot) PLFAs, and (e) the ratio of fungal to bacterial13C uptake in control (closed circles) and drought (open circles) plots over time. Fungal PLFAs were grouped into (c) general fungal marker and (d) 16:1x5 PLFAs, and bacterial PLFAs into (g) Gram-negative and (h) Gram-positive PLFAs. Values were calculated for the uppermost 10 cm of soil. Mowing is indicated by light grey lines and rewetting is indicated by black lines. Effects of drought before and after cutting were analysed separately by two-way repeated-measures-ANOVA (ns, not significant;*,P<0.05;**,P<0.01;***,P<0.001; further details are given in Table 2).
increase of 13C in the EOC. This could have been caused by decreased bacterial activity and a higher proportion of dormant microbes (Schimelet al., 2007) and consequently lower uptake of plant-derived C during drought, which is, however, in contrast to the observed strong increase in bacterial PLFAs. It is more likely that drought may not have caused a decrease in microbial activ-ity, which was also reported by Steinweg et al. (2013), but restricted it to water-containing, but disconnected, soil pores (Schimel et al., 2007; Moyano et al., 2013). These small soil pores may represent ‘hot spots’ for bacterial decomposers, and may not be accessible to soil mesofauna grazing on microbes, or competing plant roots or fungal hyphae (Strickland & Rousk, 2010). Microbes in these disconnected microsites may be sepa-rated from root exudates, which would explain the reduced microbial uptake of plant-derived13C from EOC.
We rejected our hypothesis that drought decreases microbial biomass and showed that, in the studied grassland, beneficial effects on microbes may have exceeded detrimental ones, possibly also reflecting a carry-over effect from the drought experiment performed in the same plots in the previous year (but see results on recovery responses after rewetting). This is in contrast to other studies in Mediterranean or semi-arid grasslands, where drought induced a decrease in microbial biomass (Alster et al., 2013) or diversity, especially for bacteria (Yuste et al., 2011; Sheik et al., 2011). Microbial biomass also decreased when a drought treat-ment was applied to barren soil, but increased in soils with mixed plant vegetation (Sanaullah et al., 2011). This illustrates that effects of drought are strongly context-dependent, but also sug-gests that the presence of plants is crucial for microbial responses to drought.
Mowing and rewetting
Mowing has been shown to lead to a short-term pulse of plant-released C into the rhizosphere (Paterson & Sim, 1999; Hamil-tonet al., 2008; Henryet al., 2008). While we expected that this mowing-induced C pulse would be reduced by drought, we observed an increase of 13C in both drought plots and controls. In controls, this pulse of C after mowing was visible as a signifi-cant increase of 13C in microbial PLFAs, whereas in drought plots13C peaked in the EOC pool and not in the microbes. This further indicates that microbes may have been unable to take up the C released by plants during drought. Alternatively, the steep increase of13C in EOC in drought plots may have been fuelled by lysis of dead microbes or by an increase in fine-root turnover after mowing. However, such C pulses after mowing have been shown to induce a short-term increase in nutrient mineralization, which in turn increases the availability of nutrients for plants (Hamilton et al., 2008). Thus, smaller C pulses might lead to lower nutrient mineralization rates and may increase the compe-tition for nutrients between plants and microbes, and so hamper plant growth.
In contrast to mowing, rewetting did not affect microbial bio-mass either in controls or after drought treatment. The13C peak in the EOC in drought plots after mowing quickly disappeared, but was not used for new biomass production, as evidenced by a
lack of 13C incorporation into PLFAs. In turn, after rewetting, soil respiration rates steeply increased (Ladreiter et al., data not shown; ‘Birch-effect’ (Birch, 1958)), which suggests that the accumulated13C might have become available for microbes after plots were rewetted, or it may have leached out of the system. Nonetheless, we observed a shift of the microbial community composition in the drought-treated plots towards that of the con-trols already 1 wk after rewetting, indicating that the microbial community in this mountain grassland is highly resilient, even to strong drought.
Conclusions
Severe experimental drought, surprisingly, did not reduce micro-bial biomass, but altered the micromicro-bial community composition in a mountain meadow in favour of Gram-positive bacteria. Drought did not interrupt the C transfer from plants to fungi, but decreased the uptake of label into bacterial groups, especially when the meadow was mown. From our study, we therefore con-clude that (1) drought has the potential to weaken the link between plant and bacterial C turnover and (2) the microbial community in the studied grassland is highly adaptable to altered soil moisture conditions, responding to severe drought by shift-ing to slow-growshift-ing, drought-adapted soil microbes, such as Gram-positive bacteria, and quickly recovers after rewetting.
Acknowledgements
We thank T. Ladreiter-Knauss, M. Schmitt, E. Walter, S. Roth and K. Bianchi for assisting with the experimental set-up and for their help during pulse-labelling as well as M. Watzka and B. Wild for help during IRMS measurements. This project was financially supported by the Austrian Science Fund (FWF; P22214-B17) and by the European Community’s Seventh Framework Programme (FP/2007.2013) under grant agreement no. 226701 (CARBO-Extreme). We would like to thank the reviewers for their helpful comments on the manuscript.
References
Albert K, Ro-Poulsen H, Mikkelsen T, Michelsen A, van der Linden L, Beier C. 2011.Effects of elevated CO2, warming and drought episodes on plant carbon
uptake in a temperate heath ecosystem are controlled by soil water status.
Plant, Cell & Environment34: 1207–1222.
Allen MF. 2007.Mycorrhizal fungi: highways for water and nutrients in arid soils.Vadose Zone Journal6: 291.
Allison S, Martiny J. 2008.Colloquium paper: resistance, resilience, and redundancy in microbial communities.Proceedings of the National Academy of Sciences, USA105: 11512–11519.
Alster C, German D, Lu Y, Allison S. 2013.Microbial enzymatic responses to drought and to nitrogen addition in a southern California grassland.Soil Biology and Biochemistry64: 68–79.
Anderson M, Willis T. 2003.Canonical analysis of principal coordinates: a useful method of constrained ordination for ecology.Ecology84: 511–525.
Bahn M, Knapp M, Garajova Z, Pfahringer N, Cernusca A. 2006.Root respiration in temperate mountain grasslands differing in land use.Global Change Biology12: 995–1006.
carbon allocation dynamics to extended shading in mountain grassland.New Phytologist198: 116–126.
Bahn M, Reichstein M, Davidson EA, Gr€unzweig J, Jung M, Carbone MS, Epron D, Misson L, Nouvellon Y, Roupsard Oet al.2010.Soil respiration at
mean annual temperature predicts annual total across vegetation types and biomes.Biogeosciences7: 2147–2157.
Bahn M, Schmitt M, Siegwolf R, Richter A, Br€uggemann N. 2009.Does photosynthesis affect grassland soil-respired CO2and its carbon isotope
composition on a diurnal timescale?New Phytologist182: 451–460. Balasooriya WK, Denef K, Huygens D, Boeckx P. 2012.Translocation and
turnover of rhizodeposit carbon within soil microbial communities of an extensive grassland ecosystem.Plant and Soil. doi: 10.1007/
s11104-012-1343-z.
Bardgett R, Freeman C, Ostle N. 2008.Microbial contributions to climate change through carbon cycle feedbacks.The ISME Journal2: 805–814. Bardgett R, Jones A, Jones D, Kemmitt S, Cook R, Hobbs P. 2001.Soil
microbial community patterns related to the history and intensity of grazing in sub-montane ecosystems.Soil Biology and Biochemistry33: 1653–1664. Barthel M, Hammerle A, Sturm P, Baur T, Gentsch L, Knohl A. 2011.The diel
imprint of leaf metabolism on thed13C signal of soil respiration under control and drought conditions.New Phytologist192: 925–938.
Birch H. 1958.The effect of soil drying on humus decomposition and nitrogen availability.Plant and Soil1: 9–31.
Br€uggemann N, Gessler A, Kayler Z, Keel SG, Badeck F, Barthel M, Boeckx P, Buchmann N, Brugnoli E, Espersch€utz Jet al.2011.Carbon allocation and
carbon isotope fluxes in the plant-soil-atmosphere continuum: a review.
Biogeosciences8: 3457–3489.
Castro H, Classen A, Austin E, Norby R, Schadt C. 2010.Soil microbial community responses to multiple experimental climate change drivers.Applied and Environmental Microbiology76: 999–1007.
Chaves MM, Maroco JP, Pereira JS. 2003.Understanding plant responses to drought–from genes to the whole plant.Functional Plant Biology30: 239. Cheng X, Luo Y, Su B, Wan S, Hui D, Zhang Q, Cheng X, Luo Y, Su B, Wan S
et al.2011.Plant carbon substrate supply regulated soil nitrogen dynamics in a
tallgrass prairie in the Great Plains, USA: results of a clipping and shading experiment.Journal of Plant Ecology4: 228–235.
Ciais P, Reichstein M, Viovy N, Granier A, Ogee J, Allard V, Aubinet M, Buchmann N, Bernhofer C, Carrara Aet al.2005.Europe-wide reduction in
primary productivity caused by the heat and drought in 2003.Nature437: 529–533.
Compant S, van der Heijden MG, Sessitsch A. 2010.Climate change effects on beneficial plant-microorganism interactions.FEMS Microbiology Ecology73: 197–214.
Denef K, Roobroeck D, Wadu MCWM, Lootens P, Boeckx P. 2009.Microbial community composition and rhizodeposit-carbon assimilation in differently managed temperate grassland soils.Soil Biology and Biochemistry41: 144–153. de Deyn GB, Quirk H, Oakley S, Ostle N, Bardgett RD. 2011.Rapid transfer
of photosynthetic carbon through the plant-soil system in differently managed species-rich grasslands.Biogeosciences8: 1131–1139.
Fontaine S, Mariotti A, Abbadie L. 2003.The priming effect of organic matter: a question of microbial competition?Soil Biology and Biochemistry35: 837–843. Hamilton E, Frank D, Hinchey P, Murray T. 2008.Defoliation induces root
exudation and triggers positive rhizospheric feedbacks in a temperate grassland.
Soil Biology and Biochemistry40: 2865–2873.
Henry F, Vestergard M, Christensen S. 2008.Evidence for a transient increase of rhizodeposition within one and a half day after a severe defoliation ofPlantago arenariagrown in soil.Soil Biology and Biochemistry40: 1264–1267. IPCC. 2007. Parry M, Canziani O, Palutikof J, van derLinden P, Hanson C,
eds.Climate change 2007: impacts, adaptation and vulnerability. Contribution of Working Group II to the Fourth Assessment Report of the
Intergovernmental Panel on Climate Change. Cambridge, UK: Cambridge University Press.
IPCC. 2012. Field C, Barros V, Stocker T, Dahe Q, Dokken D, Ebi K, Mastrandrea M, Mach K, Plattner G, Allen Set al., eds.Managing the risks of extreme events and disasters to advance climate change adaptation. Special report of the Intergovernmental Panel on Climate Change. Cambridge, UK and New York, NY, USA: Cambridge University Press.
Joergensen R, Wichern F. 2008.Quantitative assessment of the fungal contribution to microbial tissue in soil.Soil Biology and Biochemistry40: 2977–2991. Jones DL, Nguyen C, Finlay RD. 2009.Carbon flow in the rhizosphere: carbon
trading at the soil–root interface.Plant and Soil321: 5–33.
Kaiser C, Koranda M, Kitzler B, Fuchslueger L, Schnecker J, Schweiger P, Rasche F, Zechmeister-Boltenstern S, Sessitsch A, Richter A. 2010. Belowground carbon allocation by trees drives seasonal patterns of extracellular enzyme activities by altering microbial community composition in a beech forest soil.New Phytologist187: 843–858.
Kandeler E, Gerber H. 1988.Short-term assay of soil urease activity using colorimetric determination of ammonium.Biology and Fertility of Soils6: 68–72.
Klumpp K, Tallec T, Guix N, Soussana J. 2011.Long-term impacts of agricultural practices and climatic variability on carbon storage in a permanent pasture.Global Change Biology17: 3534–3545.
Kuzyakov Y. 2010.Priming effects: interactions between living and dead organic matter.Soil Biology and Biochemistry42: 1363–1371.
Lennon JT, Aanderud Z, Lehmkuhl B, Schoolmaster D. 2012.Mapping the niche space of soil microorganisms using taxonomy and traits.Ecology93: 1867–1879.
Lennon JT, Jones SE. 2011.Microbial seed banks: the ecological and evolutionary implications of dormancy.Nature Reviews Microbiology9: 119–130.
Manzoni S, Schimel J, Porporato A. 2012a.Responses of soil microbial communities to water stress: results from a meta-analysis.Ecology93: 930–938. Manzoni S, Vico G, Porporato A, Katul G. 2012b.Biological constraints on
water transport in the soil–plant–atmosphere system.Advances in Water Resources51: 292–304.
McDowell NG. 2011.Mechanisms linking drought, hydraulics, carbon metabolism, and vegetation mortality.Plant Physiology155: 1051–1059. Meyer S, Leifeld J, Bahn M, Fuhrer J. 2012.Free and protected soil organic
carbon dynamics respond differently to abandonment of mountain grassland.
Biogeosciences9: 853–865.
Moyano F, Manzoni S, Chenu C. 2013.Responses of soil heterotrophic respiration to moisture availability: an exploration of processes and models.
Soil Biology and Biochemistry59: 72–85.
Oksanen J, Blanchet F, Kindt R, Legnedre P, Minchin P, O’Hara R, Simpson G, Solymos P, Stevens M, Wagner H. 2012.vegan: community ecology package. R package version 2.0-5. URL: http://CRAN.R-project.org/package=vegan. Oksanen J. 2007.Multivariate analysis of ecological communities in R: vegan tutorial. [WWW document] URL http://ccoulufi/~jarioksa/opetus/metodi/. Olsson P. 2006.Signature fatty acids provide tools for determination of the
distribution and interactions of mycorrhizal fungi in soil.FEMS Microbiology Ecology29: 303–310.
Paterson E, Sim A. 1999.Rhizodeposition and C-partitioning ofLolium perenne
in axenic culture affected by nitrogen supply and defoliation.Plant and Soil
216: 155–164.
Popp M, Lied W, Meyer A, Richter A, Schiller P, Schwitte H. 1996.Sample preservation for determination of organic compounds: microwave versus freeze-drying.Journal of Experimental Botany47: 1469–1473. Reichstein M, Bahn M, Ciais P, Frank D, Mahecha M, Seneviratne S,
Zscheischler J, Beer C, Buchmann N, Frank Det al.2013.Climate extremes
and the carbon cycle.Nature50: 287–296.
Ruehr NK, Offermann CA, Gessler A, Winkler JB, Ferrio JP, Buchmann N, Barnard RL. 2009.Drought effects on allocation of recent carbon: from beech leaves to soil CO2efflux.New Phytologist184: 950–961.
Sanaullah M, Blagodatskaya E, Chabbi A, Rumpel C, Kuzyakov Y. 2011. Drought effects on microbial biomass and enzyme activities in the rhizosphere of grasses depend on plant community composition.Applied Soil Ecology48: 38–44.
Sch€ar C, Vidale P, L€uthi D, Frei C, H€aberli C, Liniger M, Appenzeller C. 2004. The role of increasing temperature variability in European summer heatwaves.
Nature427: 332–336.
Schimel J, Balser T, Wallenstein M. 2007.Microbial stress-response physiology and its implications for ecosystem function.Ecology88: 1386–1394. Schjønning P, Thomsen I, Moldrup P, Christensen B. 2003.Linking soil
microbial activity to water-and air-phase contents and diffusivities.Soil Science Society of America Journal67: 156–165.
Schmitt M, Bahn M, Wohlfahrt G, Tappeiner U, Cernusca A. 2010.Land use affects the net ecosystem CO2exchange and its components in mountain
grasslands.Biogeosciences7: 2297–2309.
Schwalm CR, Williams CA, Schaefer K, Arneth A, Bonal D, Buchmann N, Chen J, Law BE, Lindroth A, Luyssaert Set al.2010.Assimilation exceeds
respiration sensitivity to drought: a FLUXNET synthesis.Global Change Biology16: 657–670.
Seneviratne S, Corti T, Davin E, Hirschi M, Jaeger E, Lehner I, Orlowsky B, Teuling A. 2010.Investigating soil moisture–climate interactions in a changing climate: a review.Earth-Science Reviews99: 125–161.
Shahzad T, Chenu C, Repincßay C, Mougin C, Ollier J, Fontaine S. 2012. Plant clipping decelerates the mineralization of recalcitrant soil organic matter under multiple grassland species.Soil Biology and Biochemistry51: 73–80.
Sheik CS, Beasley WH, Elshahed MS, Zhou X, Luo Y, Krumholz LR. 2011. Effect of warming and drought on grassland microbial communities.The ISME Journal5: 1692–1700.
Steinweg JM, Dukes JS, Paul EA, Wallenstein MD. 2013.Microbial responses to multi-factor climate change: effects on soil enzymes.Frontiers in Microbiology
4: 146.
Strickland MS, Rousk J. 2010.Considering fungal:bacterial dominance in soils–
methods, controls, and ecosystem implications.Soil Biology and Biochemistry
42: 1385–1395.
Treonis A, Ostle N, Stott A, Primrose R, Grayston S, Ineson P. 2004. Identification of groups of metabolically-active rhizosphere microorganisms by stable isotope probing of PLFAs.Soil Biology and Biochemistry36: 533–537.
de Vries FT, Liiri ME, Bjørnlund L, Bowker MA, Christensen S, Seta¨la¨ HM, Bardgett RD. 2012.Land use alters the resistance and resilience of soil food webs to drought.Nature Climate Change2: 276–280.
Walker T, Bais H, Grotewold E, Vivanco J. 2003.Root exudation and rhizosphere biology.Plant Physiology132: 44–51.
Wallenstein MD, Hall EK. 2012.A trait-based framework for predicting when and where microbial adaptation to climate change will affect ecosystem functioning.Biogeochemistry109: 35–47.
Wardle DA, Bardgett R, Klironomos J, Seta¨la¨ H, van der Putten W, Wall D. 2004.Ecological linkages between aboveground and belowground biota.
Science304: 1629–1633.
Wieser G, Hammerle A, Wohlfahrt G. 2008.The water balance of grassland ecosystems in the Austrian Alps.Arctic, Antarctic, and Alpine Research40: 439–445.
Yuste J, Pe~nuelas J, Estiarte M, Garcia-Mas J, Mattana S, Ogaya R, Pujol M, Sardans J. 2011.Drought-resistant fungi control soil organic matter decomposition and its response to temperature.Global Change Biology17: 1475–1486.
Zelles L. 1997.Phospholipid fatty acid profiles in selected members of soil microbial communities.Chemosphere35: 275–294.
Supporting Information
Additional supporting information may be found in the online version of this article.
Fig. S1Plant biomass carbon pools, and soil carbon and nitrogen pools over the course of the drought experiment.
Table S1 Date and time, and abiotic conditions during pulse-labelling, for individual sites
Table S2Natural abundance of13C of plant biomass, soil and extractable organic C pool in the soil