ISSN 1450-216X Vol.30 No.4 (2009), pp.554-570 © EuroJournals Publishing, Inc. 2009
http://www.eurojournals.com/ejsr.htm
Performance Evaluation of Fuel Cell and Microturbine as
Distributed Generators in a Microgrid
Azah Mohamed
Department of Electrical, Electronic and Systems Engineering Universiti Kebangsaan Malaysia, Selangor, Malaysia
E-mail: [email protected] Tel: 60389216006
Muhammad Nizam
Department of Electrical, Electronic and Systems Engineering Universiti Kebangsaan Malaysia, Selangor, Malaysia
A.A. Salam
Department of Electrical, Electronic and Systems Engineering Universiti Kebangsaan Malaysia, Selangor, Malaysia
Abstract
This paper presents dynamic models of distributed generators (DG) and investigates dynamic behaviour of the DG units within a microgrid system. The DG units include micro turbine, fuel cell and the electronically interfaced sources. The voltage source converter is adopted as the electronic interface which is equipped with its controller to maintain stability of the microgrid during small signal dynamics. This paper also introduces power management strategies and implements the DG load sharing concept to maintain the microgrid operation in standalone, grid-connected and islanding modes of operation. The results demonstrate the operation and performance of the microturbine and SOFC as distributed generators in a microgrid.
Keywords: Microgrid, Distributed Generation, Microturbine, Fuel Cell
1. Introduction
A microgrid can be defined as a cluster of loads and DGs capable of operating as a single controllable unit (Lasseter, 2002). Although the architecture and size of a microgrid can vary widely, it is usually considered to be a small part of a medium voltage or low voltage distribution network where power is supplied by local sources. It can be operated either in grid connected mode or in islanded mode depending on factors like planned disconnection, grid outages or economical convenience. Studies have shown that the benefits of microgrid are such as improved local supply reliability, losses reduction, local voltage support and economic benefits (Hernandez-Aramburo, 2005). However, the operation of a microgrid poses a series of technical challenges with regards to its operation and control. From the grid’s point of view, a microgrid can be regarded as a controlled entity within a power system that can be operated as a single aggregated load (Tsikalakis, 2005) and given attractive remuneration, as a small source of power or an ancillary service supporting the network. From a customer point of view, similar to traditional low voltage distribution networks, microgrids provide their thermal and electricity needs, enhance local reliability, reduce emissions, improve power quality by supporting voltage and reducing voltage sags and potentially reduce costs of energy supply.
Flexible and fast controls of real and reactive power are important requirements during transient and steady-state operation of a microgrid system in both grid-connected and islanded modes. A microgrid when subjected to disturbances can experience angle instability and poor voltage quality due to the presence of DG units with slow response rotating machines and DG units with power electronic converters as the interface to the utility system. To ensure stable operation during network disturbances while maintaining power quality in the islanded mode of operation, a more sophisticated control strategy for microgrid needs to be developed. In this research, a structure of microgrid which is a combination of fuel cell and microturbine are considered. Dynamic models of microturbine and fuell cell are simulated with PSCAD/EMTDC in the presence of arbitrarily varying loads to study stability of systems in standalone, grid-connected and islanded modes of operation. Emphasis is given in the development of control strategies of fuel cell inverter and microturbine to improve stability of the system when subjected to various load conditions and different modes of operation.
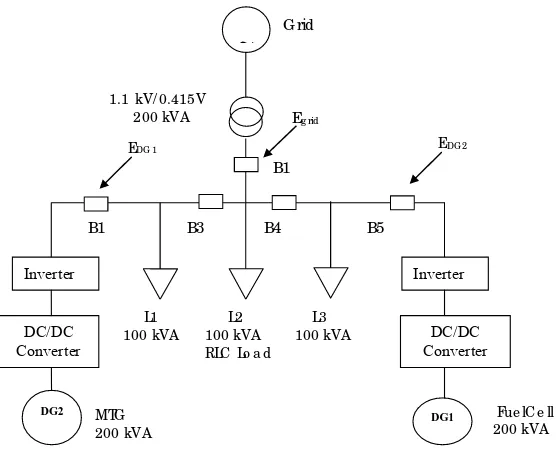
2. Microgrid Architecture
Figure 1: Microgrid Test System
MTG 200 kVA
B1 B3 B4 B5
Inverter Inverter
DC/DC Converter
DC/DC Converter
DG2
DG1 Fue lC e ll 200 kVA L1 L2 L3
100 kVA 100 kVA 100 kVA RLC Lo a d
~
G ridB1 1.1kV/ 0.415V
200 kVA Eg rid
EDG 2
EDG 1
Distributed generation powered by microsources such as fuel cell and microturbine has gained popularity due to their higher operating efficiency, improved reliability and lower emissions. Fuel cell is attractive because it is modular, efficient and environmentally friendly. The dynamic models of microturbine and fuel cell are described accordingly.
2.1. Mathematical Model of Microturbine
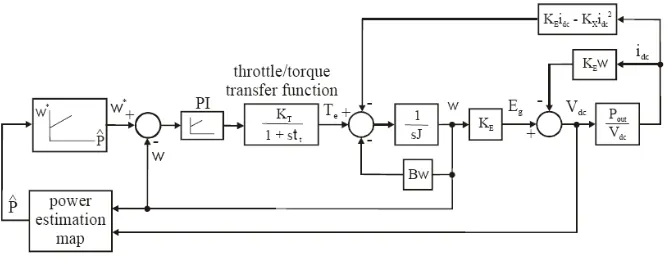
Generally, there are two types of microturbine generator system based on the position of the compressor turbine and generator. Figures 2 and 3 show a typical microturbine generator system configuration and a mathematical model of a microturbine (Simoes, 2006), respectively. The high speed single shaft design has a compressor and turbine mounted on the same shaft along with the permanent magnet synchronous generator. The generator generates power at a very high frequency ranging from 1500 to 4000 Hz. The high-frequency voltage is first rectified and then inverted to a normal AC power at 50 or 60 Hz. In another design, the turbine on the first shaft directly drives the compressor, while a power turbine on the second shaft drives the gearbox and conventional electrical generator. The microturbine is connected to the grid through an inverter and a DC link capacitor.
Figure 3: Block diagram of a microturbine mathematical model
The microturbine model assumes that the torque response is a first-order system and it is modified to accept a constant input shaft speed. In this model, the desired power output and shaft speed are set so that when the system stabilizes, and the output power follows the desired power. The parameter Ke is the ratio between no-load voltage and no-load shaft speed and the parameter Kx is
determined by using Ke. The parameters Ke and Kx are given by,
(1)
(2) From these parameters, the voltage, power and torque can be determined as,
Vdc = Ke.ω-Kx.ω.Idc (3)
Pdc = Ke.ω.Idc -Kx.ω.Idc2 (4)
τ = Ke.Idc -Kx.Idc2 (5)
The other parameters, such as shaft inertia, J; throttle gain; and time constant can be obtained through calculation or experimentation. By considering the Honeywell microturbine model [6], the microturbine parameters are obtained with Ke = 0.092, Kx = 8.594e-5, J = 0.085 and T = 10s. Figure 4
Figure 4: PSCAD/EMTDC implementation of microturbine
2.2. Mathematical Model of Solid Oxide Fuel Cell
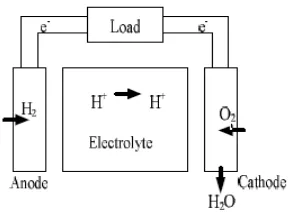
Fuel cells are electro-chemical devices and are used to convert the chemical energy of a gaseous fuel directly into electricity. In fuel cells, a chemical reaction takes place to convert hydrogen and oxygen into water and releasing electrons in the process. A fuel cell consists of two electrodes, known as the anode and cathode that are separated by an electrolyte as shown in Figure 5. Oxygen is passed over the cathode and hydrogen over the anode. Hydrogen ions are formed together with electrons at the anode and migrate to the cathode through the electrolyte. Electrons then flow to the electrode through an external circuit.
In this paper, the solid oxide fuel cell (SOFC) is considered in the development of the fuel cell model because it is suitable for large stationary power generation, relatively simple and response quickly to load changes.
Figure 5: Schematic diagram of fuel cell
(6) where,
V: Total stack voltage (V)
E0: Standard reversible cell potential (V)
r: Internal resistance of stack (Ω)
I: Stack current (A)
N: Number of cells in stack
R: Universal gas constant (J/ mol K)
T: Stack temperature (K)
F: Faraday’s constant (C/mol)
rI: ohmic loss of the stack
For the dynamics of the SOFC, consider the partial pressure of hydrogen, oxygen and water given in equations (7), (8) and (9), respectively. The slow dynamics of the fuel cell current is represented by equation (10).
(7) (8) (9)
(10)
Iref is the reference current which is given by equation (11). The fuel and oxygen flows are
given by equations (12) and (13).
(11) (12)
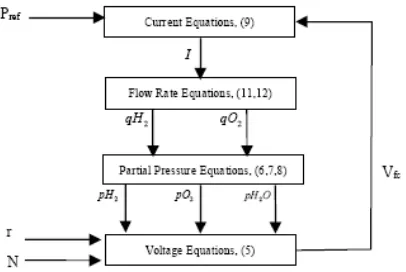
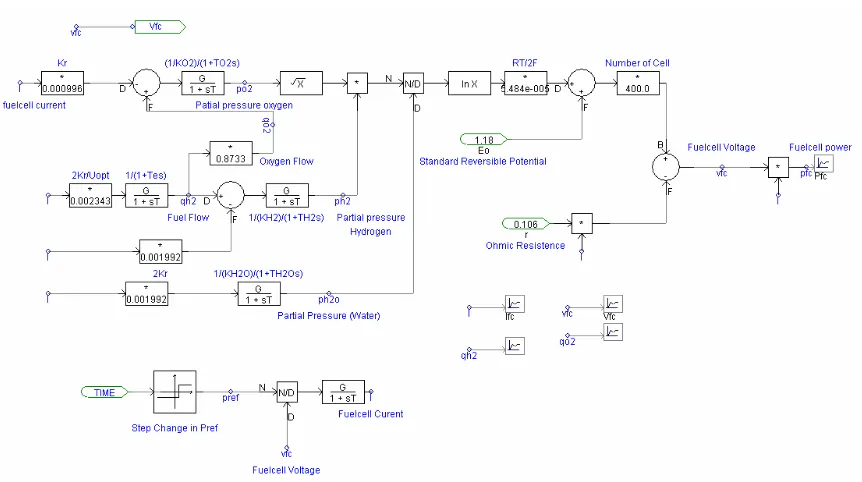
(13) The power output of the SOFC is the product of stack current and voltage. Figure 6 shows the SOFC dynamic model in terms of a block diagram.
Figure 6: Block diagram for SOFC dynamic model
Table 1. The output of the SOFC is connected to a voltage source inverter (VSI) through a DC-DC converter, so as to convert the fuel cell DC output to an AC output.
Figure 7: SOFC model in PSCAD/EMTDC
Table 1: Parameters used in SOFC simulation
Parameter Value
Operating temperature (T) 1273 K
Faraday’s constant (F) 96487 C/mol
Universal gas constant (R) 8314 J/(kmol K)
Standard reversible cell potential (E) 1.18 V
Number of cells (N) 400
Constant (Kr=N/4F) 0.996 x 10⁻⁶ kmol/(s A)
Valve molar constant for hydrogen (KH2) 8.43 x 10⁻⁴ kmol/(s atm)
Valve molar constant for oxygen (KO2) 2.81 x 10⁻⁴ kmol/(s atm)
Valve molar constant for water (KH2O) 2.52 x 10⁻³ kmol/(s atm)
Response time for hydrogen flow (TH2) 26.1 s
Response time for water flow (TH2O) 78.3 s
Response time for oxygen flow (TO2) 2.91 s
Ohmic loss (r) 0.126 Ω
Electrical response time (Te) 0.8 s
Fuel processor response time (Tf) 5 s
Ratio of hydrogen to oxygen (rHO) 1.145
Base MVA 100
3. Converter Control Strategies
otherwise it operates like a boost converter. A buck-boost converter can be obtained by the cascade connection of the buck and the boost converter.
3.1. Buck-Boost Converter Model
The design of the buck-boost converter involves determination of the inductance, L and the capacitance, C which are given by,
(14) (15)
where, D : duty cycle
f : switching frequency ΔV/Vo : voltage ripple
R : equivalent load resistance
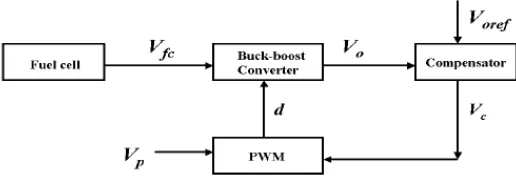
Figure 8 shows a buck-boost converter connected to the fuel cell system with a feedback control system in terms of a block diagram. The input to the converter is the fuel cell voltage (Vfc) and
the output voltage of the converter (Vo) is compared with a reference output voltage (Voref). The error
signal is compensated to obtain a control voltage (Vc) which is used to adjust the duty cycle (d) of the
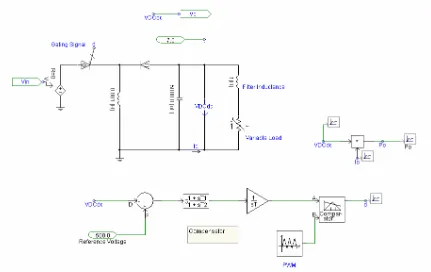
switch in the converter. The output voltage has to be regulated to be within a specified tolerance band in response to changes in the output load and the input voltage. The simulation model of the buck-boost converter developed in PSCAD/EMTDC with the parameters for L, C and filter inductance are shown accordingly in Figure 9. A filter inductance is connected in series with the load resistance to smoothen the output current and provides energy during the slow operation of the fuel cell.
Figure 9: PSCAD/EMTDC implementation of buck-boost converter
3.2. Inverter Model
The schematic diagram of a three-phase pulse width modulated (PWM) inverter is shown in Figure 10 in which it is modeled by controlled current sources. The PWM inverter model is usually preferred over the switching model for simulation purposes because it needs less computation time and small signal analysis can be performed on this model.
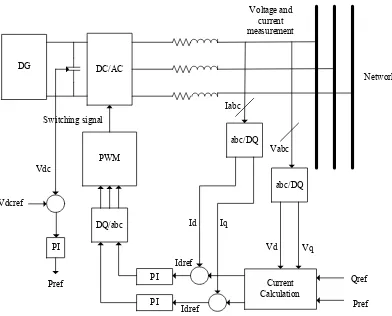
Figure 10: Three phase PWM inverter with a control system block
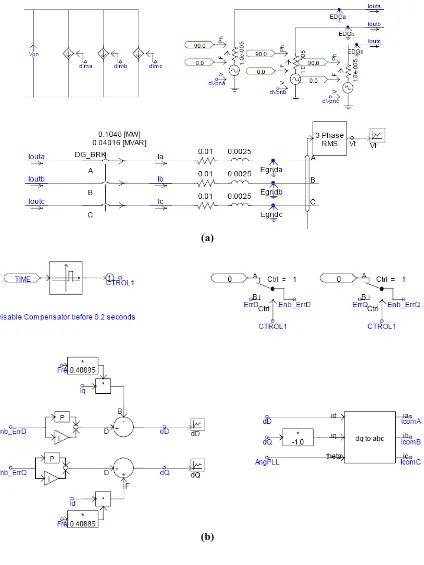
The PWM inverter is modeled in PSCAD/EMTDC by using a three-phase voltage source converter averaged model as shown in Figure 11 (a). The commands for the PWM inverter are generated by two PI control loops that control the voltage magnitude and frequency at the inverter output as shown in Figure 11 (b). From the figure, the currents, Ia, Ib, and Ic and voltages, Egrida, Egridb,
and Egridc are transformed to d-q quantities, for the PI control loops. IdREF is the reference value for the
d-axis inverter current, and IqREF is the reference value for the q-axis inverter current (Figure 10). These
Figure 11: (a) Voltage source converter model, (b) PI Controllers for the voltage source converter
(a)
(b)
4. Test Results
each load. The second simulation is to determine the characteristics of the DGs connected to the grid. The dynamic behaviour of the DGs connected to the grid is then investigated by increasing all the loads at a rate of 20%/sec in two steps during two seconds duration. Profiles of voltage and power will be compared for DG sources and grid. The simulation results are presented for the performance of DGs in standalone, grid connected and islanded mode of operations.
4.1. Results of DG in Standalone Mode of Operation
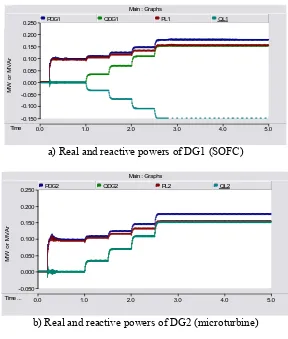
The performance for standalone mode of DG is carried out by connecting each DG to identical load of 100 kVA. Each DG is operated after 0.2 sec, for the purpose of observing its behaviour before and after start up. The results of standalone mode microgrid condition with DG1 (SOFC) and DG2 (microturbine) supplying power to static loads L1 and L3, respectively are shown in Figures 12 (a)-(c). Comparing the dynamic behaviour SOFC and microturbine during start up period, the results show that the microturbine gives a slightly faster response than the SOFC. This is due to the fact the chemical reaction in SOFC is slow in terms of producing the output power. However, it is observed that the microturbine produces oscillatory transient during start up which is due to the absorption of reactive power. The voltage profile for both DGs during standalone mode of operation with the static load connected tot eh DG is shown in Figure 12(c). The result indicates that the response of both the microturbine and SOFC is the same in terms of achieving the desired voltage level.
Figure12: Behaviour of DG in standalone mode of operation and connected to static load
Main : Graphs
a) Real and reactive powers of DG1 (SOFC)
Main : Graphs
Main : Graphs
c) Voltage profiles of DG1 and DG2
Figures 13 (a)-(c) show the responses of real and reactive powers and voltage during step increase in load at a rate of 20% /sec from the steady state in two steps from 1 sec till 2.5 sec. The results show that the response of real and reactive powers generated by both DGs is similar when subjected to step increase in load. However, the load reactive powers show different characteristic because load (L1) injects reactive power into the system whereas load L2 absorbs the reactive power. It is noted that when loads are increased, the DGs tried to produce more power and as a result the load voltages gradually decrease as shown in Figure 13 (c).
Figure 13: Behaviour of DG in standalone mode and subjected to step increase in load
Main : Graphs
a) Real and reactive powers of DG1 (SOFC)
Main : Graphs
Main : Graphs
c) Voltage Profiles of DG1 and DG2
4.2. Results of DG in Grid-Connected Mode of Operation
For investigating grid-connected mode of operation, the DGs are connected to the grid through a step-down transformer 1.1kV/415V. Three loads, L1, L2 and L3 with identical capacity of 100 kVA are connected in the microgrid system as shown in Figure 1. The performance of grid-connected mode is observed by using steady state load and dynamic load increase. The results of grid-connected mode microgrid condition with DG1 (SOFC) and DG2 (microturbine) supplying power to static loads L1, L2 and L3, respectively are shown in Figures 14 (a)-(c). The total load connected is 275 kW. It can be seen from Figure 14 (a) that the real powers from DG1, DG2 and grid are 100 kW, 100 kW and 75 kW, respectively with power contribution from DG1 and DG2 of about 73% and from grid which is 27%. During start up, initially the real powers oscillates and then reaches its steady state condition due to the injection of inrush current when DG2 is connected. Comparing the reactive powers of the DGs and grid, it is shown in Figure 14 (b) that the reactive powers produced by DG1 and DG2 are 28 kVar and 26, kVar respectively whilst the reactive power received by the grid is 53 kVar. The results show that the reactive power consumed by the load is very small, that is only 1 kVar. The voltages at the grid, DG1 and DG2 are found to be 0.97 p.u., 0.98 p.u. and 0.98 p.u, respectively as shown in Figure 14(c).
Figure 14: Behaviour of DG with static load and in grid-connected mode of operation
Main : Graphs
Main : Graphs
b) Reactive powers of DG1, DG2, grid and total load
Main : Graphs
c) Comparison of voltage profiles at DG1, DG2 and grid
The results on the performance of grid-connected mode of operation during step increase in load at a rate of 20% /sec are shown in Figures 15 (a) – (c). From Figure 15 (a), it can be seen that when the system is subjected to load increase, DG1 and DG2 produce more real power to supply the total load of 411 kW as compared to the power from the grid which shows a gradual decrease from 78 kW to 68 kW. Comparing the reactive powers of the DGs and grid, it can be seen from Figure 15 (b) that both DG1 and DG2 produce more reactive power when loads are increased while the grid reactive power decreases. This shows that the grid injects reactive power into the system thus causing a decrease in the total load reactive power. The increase in load causes the voltages at DG1, DG2 and the grid to gradually decrease as shown in Figure 15 (c). Since there is no control at the grid side, the voltage drop at the grid is greater than at the individual DGs.
Figure 15: Behaviour of DG in grid-connected mode and subjected to step increase in load
Main : Graphs
Main : Graphs
b) Reactive powers of DG1, DG2, grid and total load
Main : Graphs
c) Comparison of voltage profiles at DG1, DG2 and grid
4.3. Results of DG in Islanding Mode of Operation
In the islanding mode of operation, disconnection of the grid from the DGs and loads is made by disconnecting the grid breaker (B1) at time t = 4 seconds. The performance of the microgrid during islanded mode is shown in Figures 16 (a) and (b) by comparing the real power and reactive power of DG1, DG2, load and grid. The comparison of real power can be seen in Figure 16 (a) in which at t = 4 sec when the grid breaker is opened, anti islanding control is activated by using the grid voltage signals, Vgrda,Vgrdb and Vgrdc. This control strategy allows both DGs to generate more power to meet the load requirement. After islanding, DG1 and DG2 generate 144 kW and 136 kW, respectively to supply power to a total load of 260 kW and losses of 20 kW. The comparison for reactive power is shown in Figure 16(b). During islanded mode, the reactive powers of both DGs are reduced due to the disappearance of reactive power supply from the grid.
Figure 16: Behaviour of DG in islanded mode
Main : Graphs
Main : Graphs
b) Reactive powers of DG1, DG2, grid and total load
5. Conclusions
Dynamic models for microturbine and SOFC generation systems and related power electronic interface suitable for standalone, grid-connected and islanded microgrid operations are established in this work. First mathematical modelling of the control systems of microturbine and SOFC are shown and following that the converter control with PWM is developed under the PSCAD/EMTDC. The evaluation of the proposed microgrid design structure and control strategy demonstrates the feasibility of microturbine and SOFC as distributed generators in a microgrid. The results show that the developed models of microturbine and SOFC systems can quickly regulate its power outputs to meet the requirements of the load variations, tolerate the rapid changes in operations under normal conditions and maintain voltage quality at the grid and loads.
References
[1] Pepermans, G.,Driesen, J., Haeseldonckx, D., Belmaans, R. and W. D’haeseleer, 2005, “Distributed Generation: definition, benefits and issues”, Energy Policy (33), pp.787-798.
[2] Lasseter, R.H., 2002, "Microgrids", Proceedings PES Winter Meeting, vol.1, 305-308.
[3] Hernandez-Aramburo, C. A., Green, T. C. and N. Mugniot, 2005, "Fuel consumption minimization of a microgrid", IEEE Trans. on Industry Applications, vol.41, no. 3, pp.673-681. [4] Tsikalakis, A. and Hatziargyriou, N., 2005, “Economic Scheduling Functions of a Microgrid
Participating In Energy Markets”, DG Cigre Symposium, Athens,13-16 April 2005.
[5] Simoes, M; Farret, F. Integration of Alternative Sources of Energy. Wiley Press, January 2006. [6] Gaonkar D.N., Pillai G.N. and Patel R.N., 2009, Seamless Transfer of Microturbine Generation
System Operation Between Grid-connected and Islanding Modes, Electric Power Components
and Systems, 37:2, pp.174 – 188.
[7] Salam A.A., Nizam M. and Mohamed A., 2008, A Dynamic Solid Oxide Fuel Cell Model for Standalone and Grid Connection, 2nd International Power Engineering and Optimization