DETERMINANT FACTORS OF REAL EXCHANGE RATES:
THE BEHAVIORAL EQUILIBRIUM EXCHANGE RATES MODEL
(THE BEER MODEL)
Ade Komaludin
Fakultas Eknnomi l!nh•ersitas SilinYmf'i, Tasikmalava
The objectives of the research were: (I) to know thefundamelltalfactorofmacroecmwmic which determinf' real exchange rates; and to know the effect ofthe global economic crisis of the 2007-2008 On real exchange rates in Indonesia during the period of 2004-2008. and (2} to examine the stability of real exchange rates model in Indonesia during the period of 2004.1-2008.4.
By using the econometric approach (the time series analysis), the study found that real exchange rates in Indonesia during the period of 2004-2008 were determined by the fundamental factors of macroeconomic as follows: (a) real exchange rates at the one quarterly lag (positive correlation: It implies that an increase of real exchange rates at the one quarterly lag could be perceived by the next quarterly as well. (b) real interest rates differentials (po.sitive correlation, i.e. the degree of openness affected real exchange rates), (c) net foreign assets (negative correlation. i.e. the increase of the netforeign assets caused appreciation of rupiah against the USA dollar), and (d) the global economic crisis during the pe1iod of2007-2008 (positive correlation, i.e. the aisis tended to depreciute real exchange rates).
Employi11g rile Cl!Sl!MSQ Test (the Cumulative Sum of Squares of Recursive Residuals) for the stability of real cxchauge rates model. the study provided evidence which supported the idea that rlze .function (model) of rt?al exchange rates was stable (the parameters of the regression during the period of RPPTMRPPLセ@ ウゥァョセヲゥ」。ョエャケ@
remain unchanged).
Keywords: the fundamental factors of macroeconomic. the stability of real exchange rates, and the global economic crisis.
Introduction
One of the prominent monetary variables which have direct and indirect pass-through effect on inflation rates is exchange rates. The change of exchange rates can directly influence the inflation expectation, the pattern of price formation, especially for goods and services imported. On the other hand, the change of exchange rates is indirectly influences inflation rates through the component of aggregate demand (export and import). If aggregate demand exceed than aggregate supply (there is output gap in economy), then inflation pressure will take place.
Jurnal Ekonomi dan Bisnis Voi.XV, No.I, Maret 2009: 1-15
Calderon (2004) has carried out the study concerning the relation between trade openness with volatility of real exchange rates in 82 developing and developed countries, during the period of 1974-2003. One of the study findings stated that there was positive relation between the volatility of output growth (GOP), base money growth, and terms of trade with the volatility of real exchange rates.
The bitter experiences on the 1998 proved that the major causes of the economic crisis were unstable of the exchange rate. The impact of the crisis was not only perceived by economic sectors, but it was also perceived by the other sectors (education, healthy and so on). The various of policies has implemented to escape from crises, such as : to increase the SBJ rate, intervention to the foreign exchange market. renegotiating loans with the international creditors, and merging and liquidating ailing banks. The success of those policies is not only depending on the fundamental factors of economic, but it is also depending on non-economic factors, especially the government credibility and the holder monetary authority (Central Bank). It leads to the implication that the restrain of the exchange rate is needed. And, it is also as the government obligation, because the stability of exchange rates influences on various sectors.
As we know, that during the period of 2007 and 2008 the global economic crisis was happened, in which an impact of the crisis perceived to around of the world, especially to Indonesian economy as well. This situation interesting to be observed more in detail, because the change of global economic circumstances are nom1ally affect to the economy of other countries. By using the time series analysis. the study wants to know an effect of the global economic crisis on real exchange rates.
Based on the background mentioned above, the study formulates the research problems as follows: I. What are the fundamental factors of macroeconomic which determine real exchange rates in Indonesia
during the period of 2004-2008, and is there an effect of the global economic crisis of the 2007-2008 on real exchange rates;
2. How does the stability of real exchange rates models in Indonesia during the pe1iod of 2004-2008.
Literature Reviews
The Behavioral Equilibrium Exchange Rates Model (The BEER Model)
There are two alternatives of the models for analyzing exchange rates, namely The Fundamental Equilibrium Exchange Rates Model (PEER Model) and The Behavioral Equilibrium Exchange Rate Model (The BEER Model). The BEER Model was introduced by Clark and MacDonald ( 1998). The BEER Model is actually the reduced form equation of the fundamental factors which determines of real exchange rates (q). Generally, the BEER Model formulated as follows (MacDonald & Dias 2007: 5-8; Kurniati & Hardiyanto 2002: 43):
q,
==fll.zl,
+
ヲャセzセL@+
r-'T,
+
e
...
(1)where:
Z 1 ; vector
o.J
fundamental factors of economic which is expected has persistent effect on the exchange rate in the long run;Z, = vector of fundamental factors of economic which is expected has effect on the exchange rate in the short run;
T
=
transitory factors which is expected has effect on the exchange rate in the short run;e
=random disturbance tenns
Determinant Factors of Real Exchange Rates CA. Komaludin)
In the long run, the BEER Model correlates with the adjusted interest parity condition. It can be econometrically formulated with:
E,
[.1s,+k]
=
-(i, -i,")
+
7[1 ... (2)where s, is the value of the foreign currency which is expressed by the domestic currency;
i,
is thedomestic of nominal interest rates;
i," is the foreign of nominal interest rates;
7[1 is risk premium; ,1 is the
first difference operator.
The equation (2) can be expressed by the real value: i.e. by deducting that equation with the expected inflatton differentials: E, (L\p,+k -
.1p
;+k)
After rearranging, finally we get the equation as follows:q,
=
E,[q,+k]+(r, -r,")-7[1 ... (3)where
r,
=i
-
E, (L\p,+k) is the real interest rate?The last equation (i.e. the equation 3) states that the real exchange rate is determined by the three important components, namely: (1) expectation of the real exchange rate, E, [q,+J; (2) differential of real interest rate, (r, - r,·), and (3) risk premium, (Jr).
In order to the equation (3) can be more easy implemented, we assume that the exchange rate in the long run is only influenced by the persistent factors of the fundamental economic. Therefore, the long run equilibrium of exchange rate can be formulated as follows:
q,
=
E[q,+k]
=
E[p;z
1 ]=
p;z
1, •... (4)If risk premium is also formulated with,
J[,
=
g(gdebt, I gdebt,"),
so, the BEER equation can be completely fonnulated (MacDonald-Dias 2007; Cheung. Chinn & Pascual
2005) as:
BEER
=
f (r-r*, gdebt/gdebt*, tot, tnt, nfa) ... (5)+
+
+
+
+
where (gdebtlgdebt*) is the ratio of the domestic debt with the foreign debt as the risk premium; while
r-r*. tot. tnt, and nfa are the fundamental factors of economic. The r-r* is the real interest rate differentials;
Jurnal Ekonomi dan Bisnis Vol.XV, No.I, Maret 2009: 1-15
Empirical Studies
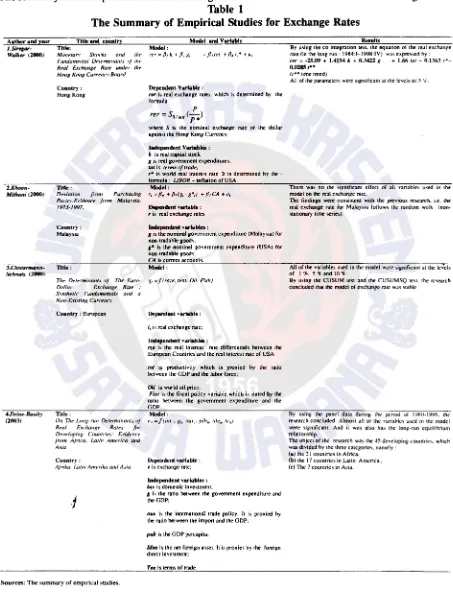
The summary of the empirical studies of exchange rates determination are listed in the following table 1:
Table 1
The Summary of Empirical Studies for Exchange Rates
Author and yeor Title and rountry J.Si,gar· Title:
Walker (2000) Mont'tan· Siwek,} and the
FundcunentCII DeterminaHI.\ (1 the·
Real eセ」ィ。Lァ・@ Rate under tile Hong kッョセ@ Curn11c_1· Board
2.Khoon-Miduuri 120001
3.l.'lost•nnann-!K:hnatz (2000)
Country:
Hong Kong
Title:
De\•iation from pオイ」ィ。セ[ゥョァ@
Paritv:E,•iclt'IICt' from Malaysia. /97il997.
Country: Mal&y'iiB
Title:
Model and Varloble Model:
Dependent Variable :
nr is real exchange rates. which is detennined by the romtula;
p
rer = SstHK(-)
P*
where S is the nominal exchange r.ue of the dollar against the Hong kッョセ@ Currency
Independent V arlables :
l is real capital stock
g is real government expenditures: tot is エ・イョイセ@ of trade;
,.. is world real interest rate. lt is detennined by the -fomtula ; UBOR inflation of USA
Model:
r, = /Jo + fJ,(g,. g•,) + /J! CA + セQL@
Dependent variable : r is real ・セ」ィ。ョァ・@ rates Independent variables :
g is the nominal government ・セー・ョ、ゥエオイ・@ (Malaysia) for non-tradable goods;
g* is the nominal government expenditure CUSA) for non-tradable goods:
C4 is current accounts. Model:
Tire d・エ・ョョゥョ。ョエセ@ of The Euro· q, ]jHイ。セ・N@ tem. Oil. Fislr)
4.Driiii-Roulty
(2flt)3)
Dollar E.-.:clwtrge Rate Syntllrtic Fundamentals a11d a Nmr-E.-.:isring Currell(\.'
Country : European
Title:
On The l.ong-nm Determinalfls of Real E-.:elrange Rate.} for De\•efopi11g Coutrtrie.}·: E1•idence from Africa. Latin America and
aNセᄋゥ。@
Country:
Afrika. !.LJ.t/11 Amerika ami A.}·ia
.J
Sources: The summary of empHical studies.
Dependent variable:
i, is real ・セ」ィ。ョァ・@ rate;
Independent Yaariables :
n.1 is the real interest rate differentials between the European Countries and the real interest rate of USA
tnt is productivity which is proxied by the ratio between the GOP and the labor force;
Oil is world oil price;
FUc is the fiscal policy variable which is stated by the ratio hetween the government ・セー・ョ、ゥエオイ・@ and the GOP.
Model:
en=/ /im•l,. g1r· OU\'n• pihrr-ide11• le11 }
Dependent variable : e is exchange rate:
Independent Yariables : tnv is domestic investment;
g is the ratio between the government ・セー・ョ、ゥエオイ・@ and the GOP;
o"v is the intrmational trade policy. 11 is ーイッセゥ・、@ by the ratio between the impon and the GOP:
pub is the GOP percapita;
ldN is the net foreign asset. It is proxies by the foreign direct investment;
T11 is terms of trade.
Rnults
By using the co integrJtion test. the ・アオセオゥッョ@ ol the real ・セ」ィオョセ・@
rate (in the Jon[! run 1984:1-1998:1V) wa'i expreo,,ed hy:
' " = -25.09 + 1.4154 k + o .• l422 K + 1.66 tot-0.1363
r•-0.028!! , ••
(t . . time trend)
All or the ー。イ。ュ・エ・イセ@ were signilicam at the levels of 5 '/.·.
There wa!l. no the significant effect of all vari01bles used in the model on the real exchange rate.
The findings were 」ッョセゥウエ・ョエ@ with the previous research. i.e. the real exchange rate for Malaysia follows the random w01lk (non-stationary lime series).
AU of the variable!l. used in the model were signific:ml ott the levels of I 'if.. S % and 10 'If·
By オウゥョセ@ the CUSUM test and the CUSUMSQ tesl. the research concluded that the model of exch:mge rate w01s o;table.
By using the panel data durin{! the period of 1 GゥセPMQYYVN@ the research concluded: Almoo;t all of the variahlc'> uo;cd in the model were significant. And it was also has the long-run equ1lihrium relationship.
The object of Lhe re!l.earch was the 45 developing count rico;. which was divided by the three categories. namely :
(a) the 21 countries in Africa. (b) the 17 countries in Latin America.
[image:4.538.44.497.117.709.2]Determinant Factors of Real Exchange Rates (A. Komaludin)
Model
The thinking of Siregar and Walker (2000), Khoon and Mithani (2000), Clostermann and Schnatz (2000) and Drine and Raulty (2003) be accordance when they analyze the determinant factors of real exchange rates. It was showed in using of the independent variables. The variable employed by them almost the same and quite relates with the BEER Model. Using all of the variables into the single equation and add on it the dummy variable, finally, the research model can be written down as follows:
rq
=
f
(k. CA. tot. rze.Fisc, n.fa, D)or, specifically can be written in the logarithmic model as
Ln rq
=
b,+
b,Ln k,+
b2 Ln CA,+
b1(tot),+
b4 (rze),+
b5 (Fisc),+
b6 Ln (nfa),+
b7D
+
1,4 ... (6)Where:
rq is real exchange rates of rupiah against the dollar USA. It is formulated by:
CPIUSA
rq = nerRpt$(
CPI
)(Krugman & Obstfeld2003: 414; Siregar& Walker2000: 8), where nerR1, 1$/NO
is nominal exchange rates of rupiah against the dollar of USA. The positive growth of rq means that the rupiah depreciates against the dollar of USA, otherwise, the real appreciation of the USA dollar against rupiah;
CP(vo CPIUSt\
k
CA tot rze
Fisc
nfa
D
=Consumer's Price Index of Indonesia (2002 = 100); =Consumer's Price Index of of USA (1982-84 = 100);
=Real capital stock (It will be proxied by the real investment expenditure, lr);
=Current accounts;
=Terms of trade (It is the ratio between the price of export and import);
= Real interest rate differentials. It is the different between the domestic real interest rate (SBI rate -Indonesia Inflation) and the foreign real interest rate (LIBOR- USA inflation); = Fiscal policy variable which is stated by the ratio between the government expenditure
and the 2002 constant price of GDP; = Net foreign assets;
=Dummy variables (the global economic crisis during the period of 2007.1-2008.4) The coefficients of b1, b
2, b1, b4, b5, b6 are expected negative; while the b7
>
0. It means thatthe global economic crisis (dummy variable) has positive effect on real exchange rates (rq) (i.e. It can depreciate the rupiah against the US dollar), and 1,4 is an error terms.
The relation between k and rq can be explained by following mechanism. The increase of real capital stock (k) will promote the labor productivity, the wage equilibrium, the price of non-tradable (such as transportations, constructions and health). It is finally influences to the real exchange rate (Siregar &
Walker 2000: 4-8). Shortly, the increase of real capital stock will appreciate the real domestic currency,
Jurnal Ekonomi dan Bisnis Yol.XY, No.I, Maret 2009: l-15
The deficit of current accounts ( CA) is automatically causes the depreciation of real exchange rates, and on the contrary for the surplus of current accounts (CA > 0). Therefore the confident of the b2 is negative (Khoon & Mithani 2000:7).
The relation between tot and rq is negative, because the increase of tot caused the capital inflows to the home country for the tradable goods. It is finally generated the real exchange rate to become stronger (the domestic currency appreciations against the USA dollar). Therefore the coefficient of b3 is negative
(Siregar & Walker 2000; Drine & Raulty 2003).
The forth variable used in the model is the real interest rate differentials (rze). If the rze more and more high, the investors are attracted by the investment in the country. They expect will get the interesting return on it. Finally, this condition will invite the capital inflow to the country and all at once will promote the position of real exchange rates. Therefore the coefficient of b4 is negative (Clostermann & Schnatz,
2000; Kurniati & Hardiyanto 2002).
The relation between the fiscal variable (Fisc) and real exchange rates (rq) can be explained as follows. The increase of government expenditures will generated the increase the demand for non-tradable goods, the increasing the relative price of non-tradable goods, and finally exchange rates to get stronger (b5
<
0), ( Clostermann & Schnatz 2000; Sire gar & Walker 2000).The last variable used in the study is net foreign asset (nfa) variable. It is quite relate to the ability of the country to solve the problem of external shocks and all at once to restraint the speculation of currencies. The impact of that, finally, the exchange rate to get stronger (b6
<
0), (Kurniati & Hardiyanto 2002;Drine & Raulty 2003).
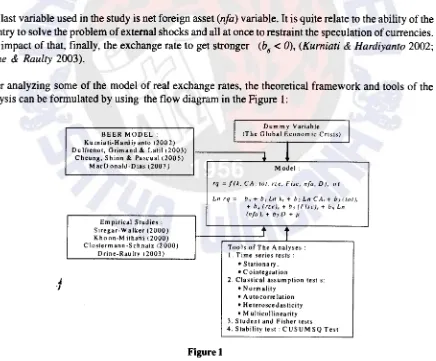
After analyzing some of the model of real exchange rates, the theoretical framework and tools of the analysis can be formulated by using the flow diagram in the Figure 1:
I
Dummy VariableI
BEER MODEL: !The Global Economic Crisis) Kumiati-Hardiyanto 12002)
l
Dulfrenot, Grimand & Latil 12003)Cheung, Shinn & Pascual12005)
..
M acD onald-Dias 12007) Model:
rq = f(k. CA, lot, r<.e. Fist·, nfa, D), or
Ln rq = b,. + b1 Ln k, + b1 Ln CA, + b, f/ot),
+ h-1 (rze), + b5 (Fisc),+ b11 Ln (nfa), + b7D +I'
Empirical Studies:
Siregar-Walker 12000) t
f
Khoon-M ithani (2000)
Clostermann-Schnalz 12000) Too Is of The Analyses : Drine-Raultv 12003) I. Time series tests:
• Stationary, • C ointegration
2. Classical assumption tests: • Normality
[image:6.538.59.495.335.696.2]• Autocorrelation • Heteroscedasticity • Multicollinearity 3. Student and Fisher le>t> 4. Stability test: CUSUM SQ Test
Figure 1
Determinant Factors of Real Exchange Rates (A. Komaludin)
Based on the literature reviews as mentioned above, the research hypothesis can be formulated as follows : (I) there is negative effect of, current accounts, terms of trade, real interest rates differentials, fiscal policy variable, and net foreign assets on real exchange rates (rupiah appreciation against the USA dollar). Otherwise, the global economic crisis has positive effect on real exchange rates (i.e. It can depreciate the rupiah against the US dollars), and (2) during the period of2004-2008, the functions of real exchange rates were stable (there were no significance structural changed of the parameters of the models).
Methodology
The data used in the study was time series data (the quarterly data) during the period of 2004-2008. It was taken from Indonesian Financial Statistic (Publication of February 2005-April 2009). Therefore, it has to be tested by using the stationary and the co integration tests. It is very important to be observed for detecting the characteristic of time series data. Is it stationary or non stationary data? The error correction model (ECM) was also used to analyze the dynamic variables in the short run.
The tests of deviation from the assumptions of Classical Regression Modei were carried out by using standard tests of normality, autocorrelation, multicollinearity, and heteroscedasticity. The aim of the rates.
The F-test (simultaneous test) and t-tests (partial tests) will be used to examine the significance of the regressions parameters. By using the t-test, the sensitivities (elasticities) of real exchange rates on independent variables can be observed.
The next step is the stability tests of the models. The aim of the tests is to know the structural stabilities of the model of real exchange rates during the period of 2004-2008. Is the parameter of the regression remains unchanged or changed. The tests of stabilities of the models used in the study are the Cumulative Sum of Squares of Recursive Residuals Test (CUSUMSQ Test). The superiority of this model compared with the Chow's Test is not necessary to known of the point in time when the shifting of the function (model) happened (Simorangkir 2002 : 9). The formula used to determine the statistic tests are the
ratio between the predicted of the sum squares residuals (SSR =
L
w,
2 ) by using the beginning of theobservation from the K + 1 till the t period, and the predicted of the sum squares residuals with the K + 1
till the T period (Greene 1997: 355-359). It is formulated as follows:
r=t
LW,2
S
= r=K+II r=T ... (7)
LWr2
r=K+l
where:
w,. = residuals of regression
r
= K+1 . .... , TT = total of sample size
K = number of independent variables
t =time
Jurnal Ek.onomi dan Bisnis Vol.XV, No.1, Maret 2009: 1-15
The test of regression equation (model) was carried out by plotting the value of S, on the vertical axis and the time (t) on the horizontal axis. The model being observed is stated stable (i.e. the null hypothesis is accepted, namely : 2
1
=
22=
23= ...
=
21=
2; where the2 is coefficients of the regression) if the
expectation value of the S, or E (S,) be located between the two border lines (confidence bounds) at the levels of 5 %. In contrary, the model is stated not stable if the value of E (S,) or the CUSUMSQ
curve strays from the two border lines. Let see the graph as an example below :
QNRセMMMMMMMMMMMMMMMMMMMMMMMMMMMMMMMMMMMMMMMMMMM]M
1.0
0.8
0.6
0.4
0.2
88 90 92 94 96 98 00 02
I ---
CUSUM of Squares ---- 5% SignificanceI
From the Figure 2 seen that the CUSUMSQ Curve be located between the two border lines (confidence level at the levels of 5 percent), therefore the model estimated can be directly stated stable (there is no structural changed on the model).
The data used in the research obtained from the several of publication of Bank Indonesia, the complete data can be examined in the table below:
Tabel 2
The Complete Data For The Function of Real Exchange Rates
(RQ)During The Period of 2004.1-2008.4
Quarterly rq (Rp) lr CA Tot rze Fisc Nfa
(Billion Rp) (Million USD) (Ratio= Px/Pm) (%) (%) (Million lJSDi
2004 I 15393.187 82,119.0 -2,224 1.4848485 2.91 0.0736813 37,419.16
II 16534.211 84,948.2 2,245 1.57 55208 2.35 0.0749638 34,85 1.00
JJI 16627.356 92,659.1 2,770 1.6405063 1.69 0.0711668 34,802.1 9
IV 15887.489 94,835.1 317 1.5505051 1.83 0.08493 22 36,320.48
2005 I 14687.79 94,307 .I 209 1.6800948 -1.28 0.0628176 36,030.14
II 16100.031 99,222.5 436 I. 7206573 -0.47 0.0614836 33,865.41
Ill I 5617.202 102,433.5 -I, 165 1.8322148 1.69 0.07723 87 30,318.32
IV 145 50.928 97,214.8 797 1.6637744 -6.65 0.1010059 34.723.69
2006 I 13697.854 95,608.5 2,949 I. 7065217 -6.68 0.0666884 40,08 1.5 7
II 14179.216 100,177.6 1,959 I. 7668319 -4.08 0.0810495 40,107.10
Ill 139 .55 103,279.1 3,772 1.7561238 -1.13 0.074 17 59 42,35 2.8 8
IV 127 .948 104,096.7 2,156 1.6385262 0.55 0.09724 78 42,586.33
2007 I 12632.44 7 102,992.5 2,640 1.62 365 76 -0.05 0.065 23 57 47,221.16
II 12883.492 107,906.3 2,271 1.6436818 0.04 0.0789346 50.924.44
Ill 12510.495 113,349.5 2,151 1.6203708 -1.44 0.074 I 608 URNXWUNQZセ@
IV 12439.406 117,365.8 3,430 1.6050118 0.53 0.0936993 56.920.13
2008 I 11687.09 117,134.0 2,794 1.5936823 -0.46 0.0636245 58.98 7.30
II 11987.022 120,867.7 -1,022 I. 57 41792 -2.97 0.0780722 59,45 2.60
Ill 11631.059 127,126.1 -943 I. 64 21804 -4.85 0.079501 57,107.97
IV 12954.93 12 8,094.6 -223 1.6107476 -2.83 0.1036494 51,639.31
Determinant Factors of Real Exchange Rates (A. Komaludin)
Results and Discussions
The discussion will be presented according to the problem identifications which was explained in the previous section, namely: (a) What are the fundamental factors of macroeconomic which determine real exchange rates in Indonesia during the period of 2004.1-2008.4, and is there the etl'ect of the global economic crisis of the 2007-2008 on real exchange rates; (b) How does the stabilities of real exchange rates in Indonesia during the period of 2004-2008.
b。セ・、@ on the unit root test and the co integration test, the variables used in the study has already satisfied to the requirements for the long run equation, and it is also for estimation, except for the variable of Ir (the real investment expenditure). It will be eliminated out from the model, because the data of Ir was not stationary on both of the level and the first level tests of the unit root tests.
The Determinant Factors of Real Exchange Rates (rq): The Eangle-Granger Cointegration Test
The aim of the co integration test is to know the long run equilibrium (relations) between real exchange rates and the macroeconomic variables: real exchange rates at the one quarterly lag (as the experimental variable, rq,), current accounts ( CA), terms of trade (tot), real interest rate differentials (rze ), net foreign assets (nja) and the global economic crisis (dummy variable, D).
The co integration test concluded that real exchange rates (rq) was co integrated with it's the independent variables at the same order (i.e. at order one). It means that the rq has the long run equilibrium (relations) with all of the independent variables used.
The long run parameters which determine real exchange rates (rq) were presented in the Table 3. The results of the diagnostic statistic gives the satisfy conclusions, because all of the Classical Assumptions (normality, autocorrelation, multicollinearity, and heteroscedasticity) were fulfilled. It means that the regression equation has the high validity. Therefore, it can be used for the economic analysis and further interpretations.
On the table 3 seen that is only the four variables have the significance effect on real exchange rates, at the level of significance (1 percent, 5 percent and 15 percent), namely: real exchange rates at the one quarterly lag (rq,). real interest rate differentials (rze), net foreign assets (nfa), and the dummy variable (the global economic crisis, D).
While, the rest of the variables were current accounts (CA), and terms of trade (tot). have not the significance effect on real exchange rates.
There were the positive correlation between the experimental variable (rq,) and the real exchange rates. It means that the effect of an increase of real exchange rates at the one quarterly lag (i.e. the depreciation of rupiah against the USA dollar at the one quarterly lag) can be felt by the next quarterly as well. The coefficient of the rq,_1 was 0.47. This was an elasticity of real exchange rates (rq) on the
rq,_r It means that the increase of the rq,_1 by 10 percent caused the increase of the rq by 4.7 percent
Jurnal Ekonomi dan Bisnis Vol. XV, No. I. Maret 2009: 1-15
The real interest rate differentials (rze) have positive significant effect on real exchange rates at the significance level of 5 percent. It means that the increasing of real interest rate differentials caused the depreciate rupiah against the US dollars (this relation was not appropriate with the hypothesis proposed, and it was also different with the conclusion of Clostermann and Schnatz (2000) and Kumiati and
Hardiyanto (2002). It can be also interpreted that the degree of opens affect on real exchange rates in
Indonesia during the period of2004-2008.
Table 3
Long Run Equation of The Real Exchange Rate (RQ)
During The Period of 2004.1-2008.4
Indep Variables Constant (c)
Log rq(-1) LogCA
Tot
Rze
Lognfa
Dummy
Summary Statistic :
R2=0.92
Adj- R' = 0.87
F = 15.96
OW= 1.61
n = 2004.1-2008.4 = 20
Classical Assumptions
Normali(v:
Jarque -Bera Statistic (J-B)
Serial Correlation :
Breusch -Godfrey
Serial Correlation LM
Test
Notes:
Dependent Variable : Log
rq
Coefficients 10.50989 0.471710 0.015138 0.394081 0.010644 -0.544842 0.085575 t-Statistic 2.094314** 1.315479* 0.962974" 0.783998" 2.118167** -2.912536*** 1.309284*
***) significant at the level of I%, (df= n-k = 13; !-table= 2.650)
**) significant at the level of 5 %; ( df = n -k = 13; t -1,blc = I. 771 )
*) significant at the level of I 5 %; ( df = n -k = ; t -,,hie = 1.079)
n) non -significant (one tail test)
Diagnostic statistic
Statistical Value Critical
Value
J -B Stat= 1.57
Obs* R 2
= 0.23
i=
9.488(5 %, v=4)
1=9.488
(5 %, v=4)
Conclusions
J-B Stat <
x-Obs* R 2
<
i
The regression fit with the normality assumption
No serial correlatin
Whit .i
Heteroskecllsticity Test: Obs* R 2
= 13.55
I=
18.475 (I % ;df= 7)Obs* R2 <
x-
Nohetcroscedasticity
Multicollinearity :
Correlogram of residuals
The table of correlogram o_f'residuals showed that all of the
value of aオエッ」ッイイ・ャ。エゥッョNセ@ (AC) was absolutely less than the
0.5. It means that the model free from the multicollinearity.
Sources :The Eviews 4.1 outpllls
[image:10.538.76.477.183.684.2]Determinant Factors of Real Exchange Rates (A. Komaludin)
The net foreign assets (nfa) has the negative significance effect on real exchange rates at the significance level of 1 percent (It is appropriate with the hypothesis). The negative relations give the meaning that the increase of the net foreign assets (nfa) caused the decrease of real exchange rates (there was appreciation of rupiah against the USA dollar). The relation was appropriate with the hypothesis proposed, as ecpected in hypothesis (see Drine & Raulty 2003).
The last variable used in the model was the global economic crisis during the period of 2007-2008 (as dummy variable). Based on the student test (t-test), the global economic crisis has apparently the positive effect on real exchange rates, at the significance level of 15 percent. It means that the crisis tends to depreciate real exchange rates.
It so happens, simultaneously the effect of macroeconomic variables were significant, because F-statistic
=
15.96 exceed of the F<o.oJ: dr= 13>=
4.62. Therefore, the regression equation can be implemented for predicting and the other analyses.The value of the variances of real exchange rates (rq) which can be explained by macroeconomic variables: rq,_1; CA. tot, rze, nfa and dummy were 92.00 percent, while the rest of 8.00 percent explained
by other variables. The high of the determination coefficient and the significance of many variables on the real exchange rate model indicate the coincidentally in choosing of macroeconomic variables which used in the model. So that the regression were very good for predicting and explanations.
The Stability Test of Real Exchange Rates Models
The long run model of real exchange rates function will be tested in this section is the equation presented in the Table 3, namely:
Log rq, = 10.510
+
0.471 Log rq ,_1+
0.472 Log rq,_1+
0.015 Log CA,+
0.394 Log tot,+
0.011 rze, - 0.545 Log nfa
+
0.086 DummyThe CUSUMSQ Curve for the equation above as follows:
QMVセMMMMMMMMMMMMMMMMMMMMMMMMMMMMMMMMMMMMMMML@
---1-2
o_a
---PNPKMMMMMセセセセMMMMMMMMMMMMMMMMMMMMMMMMMMセ@
---0.4
MPMT[MMMセMMMMMMMMNMMMMMMMMMMMセMMMMMMMMMMMMセ@
2007:3 2007:4 2008:1
1---
CUSUM of Squares --- 5% SignificanceI
Jurnal Ekonomi dan Bisnis Vol.XV, No.l, Maret 2009: 1-15
We see on the Figure 3 that the CUSUMSQ Curve be located between the two border lines (confidence bounds at the levels of
5
percent), therefore the model estimated is stable (there was no structural changed on the model). The conclusion is in accordance with the research conclusion which was found by Kurniati and Hardiyanto (2002).Conclusions and the Policy Implications
Conclusions
Based on the discussion and the analysis of determinant factors of real exchange rates, the research conclusions were:
1. The real exchange rates in Indonesia during the period of 2004-2008 were determined by the fundamental factors of macroeconomic as follows: (a) real exchange rates at the one quarterly lag (positive correlation). (b) real interest rate differentials (positive correlation, but it was not appropriate with the hypothesis), (c) net foreign assets (negative correlation, as expected in hypothesis), and (d) global economic crisis during the period of 2007-2008 (positive correlation, as expected in hypothesis). 2. During the period of the observation was found that real exchange rates model was stable (as expected in hypothesis). It means that the parameters of the functions of real exchange rates in the period of 2004.1-2008.4 were significantly unchanged.
Policy Implications
The following descriptions are the policy implications which can be implemented by the government (or the monetary authority), and the further of research recommendations:
1. As mentioned in the conclusions, the research found that real exchange rates was influenced by real exchange rates at the one quarterly lag (the experimental variable,
rq,),
real interest differentials, net foreign assets and the global economic crisis during the period of2007-2008. It means that the increase of those variables (except of net foreign assets) caused the depreciation of rupiah against the USA dollar (the relations were actually not expected). This is the real fact that the non economic factors were apparently still dominant influences to the value of rupiah against the USA dollar (real exchange rates). This condition indicates that the government has to improve its credibility which is represented by the ability to solve the political and social problems, the state securities which are happening in the country.2. The real interest rate differentials in the short run have the positive significant effect on the value of rupiah. It means that the increase of the interest rate differentials caused the depreciation of rupiah against the USA dollar. This is indication that the investment in Indonesia was not interesting anymore, because the returns which are received to become lower compared with the investment in the origin countries. That signs should be cached by the government that the depreciation of rupiah against the USA dollagis only in the short run (just temporary). It means that the depreciation of rupiah was nor only caused by the fundamental factors of economic, because in the fact that the several of fundamental factors of macroeconomic were not significance effect on real exchange rates.
QRuSuPオNセ@
Determinant Factors of Real Exchange Rates (A. Komaludin)
complete
if
that research started. It will give the big contribution to the treasury of sciences and also to the monetary economic of syariah itself.References
Almizan, Ulfa. 2003. Indonesia Satu dan Stabilitas Kurs Rupiah: Analisis Stabilitas Exchange Rates
Indonesia Pasca Krisis 1997. Jurnal Keuangan dan Moneter. 6 (2).
Babetskii, 1., and Egert B. 2005. セアオゥャゥ「イゥオュ@ Exchange Rate in The Czech Republic: How Goods is The Czech BEER? Working Paper (ISSN 1211-3298). Charles University, Ec. Institute, Czech Republic.
Bank Indonesia, Statistik Ekonomi Keuangan Indonesia 2005.
Bank Indonesia, Statistik Ekonomi Keuangan Indonesia 2006.
Bank Indonesia, Statistik Ekonomi Keuangan Indonesia 2007.
Bank Indonesia. Statistik Ekonomi Keuangan Indonesia 2008.
Bank Indonesia. Statistik Ekonomi Keuangan Indonesia 2009.
Barnett, W.A., and Kwag, C. H. 2005. Exchange Rate Determination from monetary Fundamentals: An Aggregation Theoretic Approach. Working Paper. India Study Institute, Seoul, Korea. Bleaney, M. and Fielding, D. 1999. Exchange Rate Regimes, Inflation and Output in Developing Countries.
Working Paper, Research Department of The International Monetary Fund.
Calderon, C. (2004 ). Trade Openness and Real Exchange Rate Volatility : Panel Data Evidence. Central
Bank of Chile Working Paper, Banco Central de Chile Documentos de Trabajo.
Cheung, Y.,W., Chinn, M.D., and Pascual, A.
G.
2005. Empirical Exchange Rate Models of The Nineties : Are Any Fit to Survive ? Journal of International Money and Fiance, 24:1150-1175. Elsvier, IMF, Washington DC, USA.Chowdhury, M. B. 1999. The Determinants of Real Exchange Rate: Theory and Evidence from Papua New Guinea. Working Papers, Asia Pacific Press, Asia Pacific School of Economics and Management.
Civcir, Irfan. 2003. The Long-run of Monetary Exchange Rate Model for a High Inflation Country and Misalignment: The Case of Turkey. Working Paper. Ankara University, Faculty of Political Sciences, Ankara, Turkey.
Jurnal Ek.onomi dan Bisnis Vol.XV, No.I. Maret 2009: l-15
Cooper, Donald R., and Emory, C. William. 1995. Business Research Methods. Fifth Edition, Ricard D. Irwin, Inc. USA. Cunningham, Alastair and Haldane, Andrew, G. .. The Monetary Transmission Mechanism in The United Kingdom: Pass-Through and Policy Rules. Working Paper. Bank of England.
Clark, P.B. and MacDonald, R. 1998. Exchange Rates and Economic Fundamentals: A Methodological Comparison of BEERs and FEERs. Working Paper No. WP/98/67. IMF.
Drine, Imed and Raulty, Christophe. 2003. On The Long-run Determinants of Real Exchange Rates for Developing Countries: Evidence from Africa, Latin America and Asia. JEL Class(fication,
Euro Qua, Sarbonne University.
Dropsy, Vincent and Grand, Nathalie. 2004. Exchange Rate and Inflation Targeting In Marocco and Tunisia. Working Paper, Department of Economics, California State University, USA. Enders, Walter. 1995. Applied Econometric Time Series. John Wiley & Sons, Inc., New York, USA. Frommel, M., MacDonald R., and MenkhoffL. 2004. Markov Switching Regimes in a Monetary Exchange
Rate Model. Working Paper, Universitat Hannover, Germany.
Gelbard, Enrique and Nagayasu, Jun.I999. Determinants of Angola's Parallel Market Real Exchange Rate. JMF Working Paper, African Department and Monetary and Exchange Affairs Department.
Golfeld, S., M., and Chandler, L.V. 1981. The Economics of Money and Banking. Eighth Edition, Harper International Edition, New York, USA.
Groen, Jan J.J. 1998. The Monetary Exchange Rate Model as a Long-Run Phenomenon. Working
Paper, Tinbergen Institute, Erasmus University Rotterdam, Nederland.
Hoffmann, M., and MacDonald, R. 2001. A Real Differential View of Equilibrium Real Exchange Rates.
Working Paper. University of Southampton (UK) and University of Strathclyde (Germany).
Khoon, G. S., and Mithani, D., M. 2000. Deviation from Purchasing Parity: Evidence from Malaysia, 1973-1997. Asian Economic Journal, 14 (1).
Kool, C. J. M., and Lammertsma, Alex. 2002. Inflation Persistence Under Semi-Fixed Exchange Rate Regimes: The European Evidence 1974-1998. Working Paper, Netherlands Bureau for Economic Policy Analysis (CPB), The Hague, The Netherlands.
Krugman,
Pauf
R., and Obstfeld, Maurice. 2003. International Economics: Theory and Policy. SixthEdition, World Student Series, Boston, USA. ·
MacDonald, R. and Dias P. 2007. Behavioural Equilibrium Exchange Rate Estimates and Implied Exchange Rate Adjustments for Ten Countries. Paper prepared for the workshop on Global Imbalances.
Determinant Factors of Real Exchange Rates (A. Komaludin)
Masri Singarimbun, dan Sofian Effendi. 1995. Metode Penelitian Survai. LP3ES, Jakarta, Indonesia.
Pribadi S., Janu D., Finnan M., dan Yoga A. 2000. Kajian Pemilihan Sistem Nilai Tukar Indonesia.
Buletin Ekonomi Moneter dan Perbankan. 2 (4) Maret.
Siregar, Reza Y., and Walker W. C. 2000. Monetary Shocks and the Fundamental Determinants of the Real Exchange Rate under the Hong Kong Currency Board. Asian Economic Journal. 14 (1).
Wren, Simon and Lewis. 2003. Medium Term Exchange Rate Dynamics. Working Paper. University of Exeter, London, UK.
Yati Kurniati, danA.V. Hardiyanto. 2002. Rupiah Exchange Rate Behavior and Alternative Calculation
of Equilibrium Real Exchange Rate. Bulletin of Monetary Economics and Banking.