IN ENGLISH
NO AUTHOR INSTITUTION TITTLE SUBJECT
1 Synthia A. Sari Univeristy of Bina Nusantara; [email protected]
The Effectiveness of Independent Commissioner in Implementing Good Corporate Governance at Indonesian State-Owned Enterprises
STRATEGIC
2 Yie Ke Faculty of Business and Economics-University of Surabaya
Management Style Of Chinese Overseas Companies And Indonesia Companies
STRATEGIC
3 Suresh Kumar; Randy Prasetyo
President University; [email protected]
PENETRATING INDONESIAN
BANCASSURANCE MARKET: STRATEGIC MANAGEMENT,
PT. ASURANSI CIGNA – INDONESIA STYLE
STRATEGIC
4Alain Widjanarka PT Bi a a Uta a – PPM Co sulti g Jakarta, Indonesia
DEFINE THE CRITERIA TO IDENTIFY CORE AND NON-CORE ACTIVITIES
TO LEVERAGE THE COMPANY’S COMPETIITIVENESS AND
STRENGTHENING THE PARTNERSHIP WITH OTHERS
STRATEGIC
SCHEDULE PRESENTATION PAPER FOR INSYMA 10
Session 1 (11.10 - 12.10 WITA)
Room 1: Denpasar Room 1
IN ENGLISH
NO AUTHOR INSTITUTION TITTLE SUBJECT
1Agung Wahyu Handaru, Widya Parimita, Inna Hadza Sabila
Faculty of Economics State University of Jakarta. Email:
[email protected]; [email protected]; [email protected]
Motivational Factors, Entrepreneurship, Ethnicity, and Parental Background: Evidence from the Blok M Square Electronic Center, Jakarta, Indonesia
HRM
2 Sri Wiludjeng SP, Muhammad Madyosa Ibrahim
Faculty of business management Widyatama University;
[email protected], [email protected]
The Impact of the Use of Outsourcing
Employee Against Productivity Companies In PT.Pindad Bandung
HRM
3 May Eka Ubaya Leadership and Five Stage Model of Organizaton Growth at UD "RAMA JAYA"
HRM
4 T. Soemarman Faculty of Bussiness and
Economics, Surabaya University (UBAYA)
CASE STUDY: A PROJECT OF IMPROVEMENT ON THE DESIGN OF JOBS/WORKS FOR PROFESSIONAL WORKERS AT PT. BUKIT
BATUBARA TBK – THE YEAR OF /
HRM
SCHEDULE PRESENTATION PAPER FOR INSYMA 10
Session 1 (11.10 - 12.10 WITA)
Room 2: Denpasar Room 2
IN ENGLISH
NO AUTHOR INSTITUTION TITTLE SUBJECT
1 Suskim Rianti, Harry Setyo Negoro, Alfiah Hasanah
Faculty of Business & Management, Widyatama University, Bandung, Indonesia (writer 1,2); 3Faculty of Economics, Padjadjaran University, Bandung, Indonesia (3)
EVALUATING THE FINANCIAL PERFORMANCE USING THE GROWTH OF EPS, CFO AND EVA AND THEIR IMPACT TO THE STOCK RETURN OF LISTED TELECOMMUNICATION INDUSTRY IN BEI
FINANCE
2 I Putu Sugiartha Sanjaya Atma Jaya University, Yogyakarta;
CASH FLOW RIGHT LEVERAGE AND FIRM PERFORMANCE: CASE FROM FAMILY FIRM LISTED IN INDONESIA STOCK EXCHANGE
FINANCE
3 Aris Armuninggar, DR UNAIR; [email protected] The Role of Insurance Agreement as Part of Risk Management Process in Indonesian Business Activities
FINANCE
4 Yohanna Handjaja, Deddy Marciano, Liliana Inggrit Wijaya
Faculty of Business and Economics, University of Surabaya, Indonesia Email:
GAUGING THE FINANCIAL
PERFORMANCE OF BANKING USING CAMEL MODEL: THE PROSPECT OF ISLAMIC BANK IN INDONESIA ACCORDING TO PUBLIC TRUST COMPARED WITH CONVENTIONAL BANK
FINANCE
Moderator : DR. Putu Anom Mahadwarta
SCHEDULE PRESENTATION PAPER FOR INSYMA 10
BAHASA
NO AUTHOR INSTITUTION TITTLE SUBJECT
1Suciaty Debora Ridwan & M.Sienly Veronica
Maranatha Christian University Bandung. Email: [email protected]; [email protected].
Earnings Management Trend Toward Coal Company Listed in the Indonesia Stock Exchange Which Expected To Bankruptcy By Use The Altman Z-score Model, Springate Model And Zmiwisky Model In Period 2009-2011
FINANCE
2Yulius Pratomo Satya Wacana Christian University, Salatiga;
FOREIGN DIRECT INVESTMENT IN ASEAN, 1994-2010: DOES THE CHINA EFFECT EXIST?
FINANCE
3 M.Nashihin Trilogi University, Jakarta; [email protected], [email protected]
Strategies to implement the changes in the basis of cash transfer from a household-base to a family-base: the case of PKH in Indonesia
FINANCE
4Hendro Lukman & Stevanus Adree Cipto Setiawan
Tarumanagara University; [email protected]
THE EFFECT OF FINANCIAL CONDITION, THE FAILURE OF DEBT RATIO, FIRM SIZE AND PUBLIC ACCOUNTING REPUTATION
ON ACCEPTANCE OF GOING CONCERN OPINION
FINANCE
SCHEDULE PRESENTATION PAPER FOR INSYMA 10
Session 1 (11.10 - 12.10 WITA)
Room 4: Tabanan Room
IN ENGLISH
NO AUTHOR INSTITUTION TITTLE SUBJECT
1 Amak Mohamad Yaqoub & Indri Apriani Rahma Pratama
Airlangga University;
[email protected]; [email protected]
The Role of Power and Conflict Resolution in Supply Chain Relationship: Small and Medium Enterprises Context
OPERATION
2Weli Imbiri Atmajaya University; [email protected]
The Relationship between the Level of the Use of ERP System, SCM,Strategic Alignment,and Firm Performance
Using Balanced Scorecard Approach
OPERATION
3 Tuwanku Aria Auliandri Airlangga University; [email protected] ; [email protected]
Improving the company competitive advantages by identifying waste in the production process. Case study at Watutulis Sugar Cane
Manufacturer in Sidoarjo
OPERATION
4 Christine Dwi K.S. Sondang M.R.
Adriana Oktarina Sembiring
Maranatha Christian Univ; [email protected]
INTERNAL AUDIT QUALITY ROLE IN IMPROVING EFFECTIVENESS OF
QUALITY MANAGEMENT SYSTEM ISO 9001:2000
(Case Study PT INTI Bandung)
OPERATION
5 Dianne Frisko UBAYA; [email protected] , [email protected]
VALUE CHAIN CONCEPT ON STRATEGIC CSR PROGRAM:
Case Study of Martha Tilaar Group
OPERATION
SCHEDULE PRESENTATION PAPER FOR INSYMA 10
Session 1 (11.10 - 12.10 WITA)
Room 5: Amlapura Room
IN ENGLISH
NO AUTHOR INSTITUTION TITTLE SUBJECT
1 Levina Rolanda Tjia, Dudi Anandya & Christina R. Honantha
Faculty of Business and Economics, University of Surabaya, Indonesia
Email: [email protected]
FACTORS INFLUENCE INDONESIAN YOUNG CONSUMERS’ ONLINE PURCHASE INTENTION IN SOCIAL MEDIA WEBSITES
MARKETING
2 Edo Sri Harsanto & Naafilah Lailatirrohmah
Management Departement Economics and Business Faculty Diponegoro University;
The Relevancy of Using Website for Promoting Healthcare Product and Services
MARKETING
3Rendy May Fandi, Efendi Haslim
Economics Faculty, Atma Jaya Catholic University; [email protected]
Emotional Attachment as a Mediator of the Relationship Between Service Quality and Emotional Brand
MARKETING
4Rini Oktavera, Erna Andajani Industrial Engineering Department, WR Supratman University , Surabaya, Management Department Surabaya University; [email protected]
IMPLEMENTATION OF VALUE CHAIN ANALYSIS IN THE BROILER SUPPLY CHAIN AGRIBUSSINESS
OPERATION
Moderator : DR. Dudy Anandya
SCHEDULE PRESENTATION PAPER FOR INSYMA 10
5Mudiantono, Rizal Hari Magnadi
Economics and Business Faculty Diponegoro University. Email: [email protected]; [email protected]
Evaluation of Using Importance Performance Analysis Approach
to Design Service Excelence Strategy for Service Product (Based on RSI Sultan Agung Semarang Case Study)
OPERATION
IN ENGLISH
NO AUTHOR INSTITUTION TITTLE SUBJECT
1 Dini Arwati, Dini Verdania
University of Widyatama Bandung;
INFLUENCE OF PARTNERSHIP SRATEGIC TO PERFORMANCE OF PRIVATE COLLEGE IN
BANDUNG
STRATEGIC
2 Aluisius Hery Pratono & Suyanto
Faculty of Business and
Economics, Universitas Surabaya E-mail: [email protected]; [email protected]
INNOVATION SUCCESS IN SMALL BUSINESS CONTEXT:
AN EMPIRICAL EVIDENT FROM INDONESIA
STRATEGIC
3Ida Bagus Made Wiyasha & Ni
Luh Suastuti Sekolah tinggi Pariwisata Nusa Dua Bali; [email protected]; [email protected]
The survival of small restaurants: micro analysis of non classified restaurants in Kuta Selatan, Bali
STRATEGIC
4Rohmawati Kusumaningtias UNESA;
Corporate Governance, Sustainability, and Islamic Banking Performance
STRATEGIC
SCHEDULE PRESENTATION PAPER FOR INSYMA 10
Session 2 (13.00 - 14.00 WITA)
Room 1: Denpasar Room 1
BAHASA
NO AUTHOR INSTITUTION TITTLE SUBJECT
1I Gede Adiputra Faculty of Economy, Tarumanagara University Jakarta
email: [email protected]
THE EFFECTS OF INTERPERSONAL COMMUNICATION AND
MOTIVATION TO PRODUCTIVITY OF EMPLOYEES AT HOTEL MULIA JAKARTA
HRM
2Yenny Purwati, Rosaly Franksiska, Eristia Lidia Paramita
Satya Wacana Christian University. Email: [email protected], [email protected] / [email protected],
SUPPLY CHAIN MANAGEMENT: STRATEGY IN INFORMATION TECHNOLOGY TO REDUCE COST
HRM
3 Luh Kadek Budi Martini Mahasaraswati Univiersity Denpasar; [email protected]
CAREER DEVELOPMENT OF CREATIVITY REVIEWED, AND COURAGE IN BUSINESS INNOVATIVE MULTI-LEVEL MARKETING (MLM)
DISTRIBUTOR ORIFLAME DENPASAR
HRM
4Jun Surjanti, Sanaji, & Dwiarko Nugrohoseno
UNESA, [email protected] SELF-CONCEPT AND SELF-EFFICACY FOR BUILDING AN ACADEMIC PERFORMANCE: A META-ANALISYS APPROACH
HRM
SCHEDULE PRESENTATION PAPER FOR INSYMA 10
Session 2 (13.00 - 14.15 WITA)
Room 2: Denpasar Room 2
5 Verina H. Secapramana University of Surabaya [email protected]
THE PREDICTIVE MODEL OF RELATIONSHIP BETWEEN ROLE STRESS, PERSONALITY, AND SALES PERFORMANCE
IN SERVICES MARKETING
HRM
IN ENGLISH
NO AUTHOR INSTITUTION TITTLE SUBJECT
1Tan Ming Kuang Accounting Department, Maranatha Christian University;
Can Innovation of Time Driven ABC System Replace Conventional ABC System?
FINANCE
2 Budhi Purwandaya, Eko Kusmurtanto
Trilogi University, Jakarta; [email protected]
Revealing the Preferences in Conveying Price Information
FINANCE
3 Anthony Kevin Bandono; Deddy Marciano
UBAYA;
FACTORS THAT INFLUENCED
SYNDICATED LOANS DECISIONS IN THE ASEAN OVER THE PERIOD 2006-2010
FINANCE
4 Berto Usman & Eduardus Tandelilin
Program Studi Manajemen Fakultas Ekonomi Universitas Bengkulu
[email protected] Program Studi Manajemen Fakultas Ekonomika Bisnis Universitas Gadjah Mada [email protected]
GOOGLE SEARCH TRAFFIC AND IT’S INFLUENCE ON RETURN, LIQUIDITY AND VOLATILITY OF STOCK RETURN EMPIRICAL STUDY: MANUFACTURING FIRMS
IN INDONESIA STOCK EXCHANGE
FINANCE
Moderator : DR. Putu Anom Mahadwarta
SCHEDULE PRESENTATION PAPER FOR INSYMA 10
5 Julius Irianto Gunawan; Endang Ernawati
UBAYA;
THE FACTORS AFFECTING THE COMPANIES CAPITAL STRUCTURE IN THE SECTOR OF INFRASTRUCTURE, UTILITIES, AND TRANSPORTATION LISTED ON INDONESIA STOCK
EXCHANGE DURING PERIOD 2006-2010
FINANCE
BAHASA
NO AUTHOR INSTITUTION TITTLE SUBJECT
1Doddy de Queljoe, Amelia Loresia, Indri Purnama Putri
Faculty of Pharmacy, University of Surabaya,Surabaya, Indonesia; [email protected]
Cost Effectiveness Analysis of DiureticsTherapyfor Ascites in Hepatic Cirrhosisat Adi Husada Undaan Wetan
Hospital in Surabaya
FINANCE
2Yeye Susilowati Stikubank University (UNISBANK), Semarang;
SYSTEMATIC RISK AS MODERATOR OR MEDIATOR OF THE INFLUENCE BETWEEN MACROECONOMIC FUNDAMENTAL FACTORS AND STOCK RETURN
FINANCE
3 Lia Amaliawiati, Edi Winarso
Faculty of business management Widyatama University
[email protected] , [email protected]
THE INFLUENCE OF MONETARY POLICY (BI RATE)
ON PROFITABILITY OF COMMERCIAL BANKS IN INDONESIA
FINANCE
SCHEDULE PRESENTATION PAPER FOR INSYMA 10
Session 2 (13.00 - 14.00 WITA)
Room 4: Tabanan Room
4 Eka Darmadi Faculty of Bussiness and
Economics, Surabaya University (UBAYA)
BETTER INVESTMENT CHOICE IN CRISIS AND AFTER CRISIS:
STOCK VERSUS GOLD
FINANCE
BAHASA
NO AUTHOR INSTITUTION TITTLE SUBJECT
1 Lina Anatan Department of Management, Maranatha Christian University Bandung,
FACTORS INFLUENCING THE SUPPLY CHAIN PERFORMANCE
(A Study of Manufacturing Firms in Indonesia)
OPERATION
2Meythi & Riki Martusa Master of Accounting, Faculty of Economics, Maranatha Christian University, Bandung. Email: [email protected]; [email protected]
SUPPLY CHAIN MANAGEMENT: STRATEGY IN INFORMATION TECHNOLOGY TO REDUCE COST
OPERATION
SCHEDULE PRESENTATION PAPER FOR INSYMA 10
Session 2 (13.00 - 14.00 WITA)
Room 5: Amlapura Room
3 Sahnaz Ubud Trilogi University, Jakarta; [email protected]
THE ROLE OF ENVIRONMENTAL
UNCERTAINTY AND IMPLEMENTATION SUPPLY CHAIN FOR INCREASING
COMPETITIVE ADVANTAGE
MANUFACTURING INDUSTRIES IN EAST JAVA
OPERATION
4 Verani Hartati & Wiwik Sulistiyowati
Department of Industrial Engineering, Universitas Muhammadiyah Sidoarjo
FISH DISTRIBUTION SYSTEM DESIGN (Case Study: Fish Auction Place Sidoarjo)
OPERATION
BAHASA
NO AUTHOR INSTITUTION TITTLE SUBJECT
1Sabrina O. Sihombing Universitas Pelita Harapan Jakarta; [email protected]
Consumer Behavior and Indonesian Values Scale: Validation and Short-Form Scale Development
MARKETING
2Yudi Pramudiana & Arinda Ike Wardhani
InstitutManajemenTelkom, Indonesia; [email protected]
The Role of Event Sponsorshipin Promoting Tourist Enthusiasm (Studies in SemarangGreat Sale Event)
MARKETING
3 Jessica Adelaide Gusti & Sabrina O. Sihombing
Universitas Pelita Harapan Jakarta; [email protected]; [email protected]
Contrasting Reflective and Formative Models on E-service Quality:
an Empirical Study
OPERATION
Moderator : DR. Dudy Anandya
SCHEDULE PRESENTATION PAPER FOR INSYMA 10
4Samuel David Lee, Pandam Rukmi Wulandari ,Aris Budi Setyawan
Faculty of Economic, Accounting Departement, Gunadarma University. Email: [email protected]; [email protected];
EFFECTIVENESS OF IT GOVERNANCE IN BANKING SECTOR
OPERATION
BAHASA
NO AUTHOR INSTITUTION TITTLE SUBJECT
1 Maria Assumpta Evi Marlina
Ciputra University, Surabaya; [email protected]
IMPLEMENTATION OF FIVE FORCES ANALYSIS IN BUSINESS START UP
STRATEGIC
2 Lim Sanny School of Business Management, Bina Nusantara University; [email protected]
EFFECT OF RELATIONAL QUALITY AND ENTREPRENEUR ORIENTATION TOWARD
FRANCHISEE PERFORMANCE IN INDONESIA
STRATEGIC
3 Syuhada Sufian Faculty of Economics and Business, Diponegoro University, Semarang, [email protected]
HIERARCHICAL INNOVATION MODEL DEVELOPMENT IN INDONESIAN PHARMACEUTICAL INDUSTRI
STRATEGIC
SCHEDULE PRESENTATION PAPER FOR INSYMA 10
Session 3 (14.00 - 15.00 WITA)
Room 1: Denpasar Room 1
4 Sri Setyo Iriani & Monika Tiarawati
State University of Surabaya (Indonesia)
E-mail :
[email protected] Email:
THE ANALYSIS OF INTERNAL AND EXTERNAL FACTORS
IN FORMULATING COMPETITIVE STRATEGIES
ON SKULL-CAP AND TAMBOURINE
INDUSTRIES IN BUNGAH VILLAGE - GRESIK
STRATEGIC
5 Machasin Riau University; [email protected]
Competitive Business Environment, Market Orientation, Strategic Orientation and
Performance of SMEs (empirical study on small and medium industries Pekanbaru city)
STRATEGIC
BAHASA
NO AUTHOR INSTITUTION TITTLE SUBJECT
1 Irene Rini Demi Pangestuti Diponegoro University; [email protected]
DETERMINANTS OF THE DECISION TO BUY AND SELL MUTUAL FUNDS
IN INDONESIA
FINANCE
2 Agus Wahyudi Salasa Gama & Ni Wayan Eka Mitariani
Mahasaraswati University Denpasar;
[email protected] , [email protected]
THE INFLUENCE OF MANAGEMENT PERFORMANCE AND INTELLECTUAL CAPITAL TOWARD THE FIRM VALUE
FINANCE
SCHEDULE PRESENTATION PAPER FOR INSYMA 10
Session 3 (14.15 - 15.30 WITA)
Room 2: Denpasar Room 2
3 I Dewa Made Endiana Mahasaraswati University Denpasar; [email protected]
EFFECT OF INVESTMENT OPPORTUNITY SET ON CASH DIVIDEND POLICY WITH AVERAGE OF SALES GROWTH ON EVERY LIFE CYCLE AS A MODERATING VARIABLE
(Studies On Manufacturing Companies In Indonesia Stock Exchange)
FINANCE
IN ENGLISH
NO AUTHOR INSTITUTION TITTLE SUBJECT
1 Niki Jayanthi & Felizia Arni Rudiawarni
Accounting/Faculty of Business and Economics Surabaya University; [email protected];
THE IMPACT OF RELATED PARTIES’
TRANSACTIONS TO MARKET VALUATION OF FIRMS
FINANCE
2 Fidelis Arastyo Andono & Fandy San
Accounting/Faculty of Business and Economics Surabaya University;
MALMI AND BROWN’S MANAGEMENT
CONTROL SYSTEM IN PRODUCTION AREA
OPERATION
Moderator : Dra.ec. Liliana Inggrit Wijaya, M.M.
SCHEDULE PRESENTATION PAPER FOR INSYMA 10
3 Stephanie Susilo & Felizia Arni Rudiawarni
Accounting/Faculty of Business and Economics Surabaya University; [email protected]; [email protected]
TRANSITION OF IFRS IN INDONESIA: FINANCIAL POSITION, FINANCIAL PERFORMANCE AND KEY FINANCIAL INDICATORS EFFECTS
FINANCE
BAHASA
NO AUTHOR INSTITUTION TITTLE SUBJECT
1 Sri Harryani , Bagus Nurcahyo,
Re y Nur’ai i Accounting Department, Economic Faculty, Universitas Gunadarma;
I pa t of I telle tual Capital o the Fir ’s Market
Value: The Mediation Role of Financial Performance (Empirical Study From The Indonesian Banking Companies since 2007-2011)
FINANCE
2 Andrea Widianti Maris1), Samuel David Lee2), Dr. Renny Nur’ainy3)
Accounting Department, Economic Faculty, Universitas Gunadarma
THE ROLE OF LEVERAGE IN THE EFFECT OF GOOD CORPORATE GOVERNENCE ON CORPORATE PERFORMANCE
FINANCE
3 Bambang Suko Priyono UNISBANK SEMARANG [email protected]
The Influence of Prospector and Defender Strategies on Performance
With Dimensions of Social Capital As Moderating
FINANCE
SCHEDULE PRESENTATION PAPER FOR INSYMA 10
Session 3 (14.00 - 15.00 WITA)
Room 4: Tabanan Room
4 Christina Yanita Setyawati
Ciputra University, Surabaya; [email protected]
Managing Global Business by Minimizing Rupiah Volatility
FINANCE
BAHASA
NO AUTHOR INSTITUTION TITTLE SUBJECT
1 R Ait Novatiani, Pondang Widyatama University,
Economics Faculty – Bandung, Indonesia;
The Influence of Total Quality Management (TQM) Applications to Sales Raising at PT. Kereta Api Indonesia (Persero) Bandung The 2nd Operations Area
OPERATION
2 Choirum Rindah Istiqaroh Saraswati Budi Utami
Merdeka University, Madiun; [email protected]
ACTIVITY PERFORMANCE ANALYSIS OF SUPPLY CHAIN
PERFORMANCE OF ACTIVITY MODEL APPROACH
STUDY AT UKM KRIPIK BUAH KEBONSARI
OPERATION
3 Kabul WahyuUtomo & Lely Dahlia
Trilogi University Jakarta; [email protected]
Increasing Wholesale Centers Role as Part of Supply Chain Management of SMEs
OPERATION
4 Yetty Dwi Lestari, MT UNAIR; [email protected]. IMPROVEMENT BANK CUSTOMER SATISFACTIONWITH SERVICE QUALITY
OPERATION
Session 3 (14.00 - 15.00 WITA)
Room 5: Amlapura Room
BAHASA
NO AUTHOR INSTITUTION TITTLE SUBJECT
1 Victor Wianto Agus Zainul Arifin
MM, Tarumanagara University Jakarta
PLACEMENT EFFECTIVENESS OF AUTOMATIC TELLER MACHINE ON INDONESIAN PRIVATE
BANKING
OPERATION
2 Wasifah Hanim University of Widyatama Bandung; E-mail:
MODEL PENGEMBANGAN KLASTER BISNIS PADA USAHA MIKRO, KECIL DAN MENENGAH
OPERATION
3 Agustine Eva Maria Soekesi
Unika Soegijapranata Semarang; [email protected]
PRODUCT QUALITY CONTROL PROFILE ON LASEM BATIK CENTRE
OPERATION
4 Agustine Eva Maria Soekesi; Meniek Srining Prapti; Inneke Hantoro; Alberta Rika Pratiwi
Unika Soegijapranata Semarang; [email protected]
THE EXISTING MODEL IDENTIFICATION OF CURCUBITA Sp (YELLOW PUMPKIN) AGRO INDUSTRY SUPPLY CHAIN MANAGEMENT IN GETASAN SUB-DISTRICT, SEMARANG REGENCY
OPERATION
Moderator : Christina Honanta, S.E., M.M.
SCHEDULE PRESENTATION PAPER FOR INSYMA 10
BAHASA
NO AUTHOR INSTITUTION TITTLE SUBJECT
1 Kazia Laturette International Business
Accounting, Ciputra University [email protected]
Impact of Acquisition of PT. Indosiar Karya Media, Tbk by PT. Elang Mahkota Teknologi, Tbk
STRATEGIC
2 Maulana & Sardiyo STIE –STMIK MURA Lubuklinggau;
ANALYSIS EFFECT OF INCENTIVE AND COMPETENCY TO THE WORKING PERFORMANCE OF EMPLOYEES AT SMART MANAGEMENT CONSULTANT PALEMBANG
HRM
3 Ayu Septirini & Agus Frianto Department of Management, Faculty of Economic UNESA; [email protected]
INFLUENCE OF JOB MOTIVATION AND JOB SATISFACTION ON EMPLOYEE PERFORMANCE IN ASURANSI JIWA BERSAMA (AJB) BUMIPUTERA 1912
SURABAYA REGIONAL OFFICE
HRM
4 Didik Hadiyatno Misna Ariani
Faculty of Economics, University of Balikpapan
Effect of Competence, Training, Motivation Employee Performance Against PT Thiess Contractors Indonesia at
Balikpapan
HRM
SCHEDULE PRESENTATION PAPER FOR INSYMA 10
Session 4 (15.00 - 16.00 WITA)
Room 1: Denpasar Room 1
BAHASA
NO AUTHOR INSTITUTION TITTLE SUBJECT
1 M.Sienly Veronica Maranatha Christian University Bandung; [email protected]
ANALYSIS THE INFLUENCE OF MACRO ECONOMIC FACTORS AND FINANCIAL COMPANY PERFORMANCE TO BUILD A BANKRUPTCY PREDICTION MODEL (STUDY AT LISTED COMPANIES IN IDX FOR YEAR 1999-2010)
FINANCE
2 I Gede Cahyadi Putra Mahasaraswati University Denpasar; [email protected]
The Effect of Age, Level of Education, Work Experience and Business Type on the Audit Delay Public Accountant in Bali
FINANCE
3 Rima Rachmawati & Priska Amelia
Faculty Economy at Widyatama University-Indonesia;
EFFECT CAPITAL ADEQUANCY RATIO (CAR) AND NON PERFORMING LOAN (NPL) ON RETURN
ON ASSET (ROA) BANKING IN INDONESIA (Survey on Indonesia Stock Exchange /IDX)
FINANCE
4 Olivia Idrus & Lely Fera FE Open University The Influence of Company's Concentration of Ownership Toward The Quality Of Corporate Governance's Implementation (Review of Corporate
Governance Perception Index)
FINANCE
Session 4 (15.00 - 16.00 WITA)
Room 2: Denpasar Room 2
Moderator : DR. Dedy Marciano
SCHEDULE PRESENTATION PAPER FOR INSYMA 10
Session 4 (15.00 - 16.00 WITA)
BAHASA
NO AUTHOR INSTITUTION TITTLE SUBJECT
1 Panji Aditya Evindo & Nadia Asandimitra Haryono
Faculty of Economics, UNESA, [email protected]
A COMPARATIVE STUDY ON RETURN STOCKS BETWEEN VALUE STOCKS AND GROWTH STOCKS IN THE GO PUBLIC
COMPANIES AT THE INDONESIAN STOCK EXCHANGE (Period of 2006-2010)
FINANCE
2 Siti Puryandani STIE BANK BPPD, Semarang; [email protected]
ANALYSIS OF FACTORS THAT INFLUENCE CAPITAL STRUCTURE AND TEST DIFFERENT CAPITAL STRUCTURE IN FINANCIALLY CONSTRAINED (FC) AND NON FINANCIALLY CONSTRAINED (NFC)
FINANCE
3 Ni Wayan Rustiarini Mahasaraswati University Denpasar; [email protected]
FIRM CHARACTERISTICS, INTELLECTUAL CAPITAL,
AND ENVIRONMENTAL PERFORMANCE (EMPIRICAL EVIDENCE FROM LISTED COMPANIES IN INDONESIA)
FINANCE
4 Dheo Rimbano, Sardiyo, Maulana
STIE – MURA Lu ukli ggau;
THE INFLUENCE OF FINANCIAL PERFORMANCE {EPS (EARNING PER SHARE), PER (PRICE EARNING RATIO), DPR (DEVIDENT PAYOUT RATIO), ROE (RETURN ON EQUITY) AND ROA (RETURN ON ASSETS)} TO SHARE PRICE INDEX
FINANCE
Room 3: Gianyar Room
Moderator : Dra.ec. Liliana Inggrit Wijaya, M.M.
BAHASA
NO AUTHOR INSTITUTION TITTLE SUBJECT
1 Sugiartiningsih Widyata a U iversity – Ba du g
– I do esia;
THE EFFECT OF ECONOMIC GROWTH ON THE NUMBER OF POOR PEOPLE IN INDONESIA, PERIOD 1994-2010
FINANCE
2 Rosemarie Sutjiati
[email protected]; Maranatha Christian Univ
The Effect of Financial Ratios to Stock Price in Several Companies listed in SRIKEHATI Group in Indonesia Stock Exchange
FINANCE
3 Sutama Wisnu D & Budi Astuti Master of Management, Islamic University of Indonesia Condong Catur Sleman Yogyakarta;
Effect Of Application Corporate Social Responsibility On Image PT . Antam Unit Pascatambang Kijang
FINANCE
4 Etty Soesilowati & Sri Utami
Economics Faculty, Semarang State University;
POLICY INTEGRATION FOR HOUSEHOLD WASTE MANAGEMENT
THROUGH ESTABLISHMENT OF WASTE BANK
FINANCE
BAHASA
NO AUTHOR INSTITUTION TITTLE SUBJECT
Moderator : Dra.ec. Endang Ernawati, M.M.
SCHEDULE PRESENTATION PAPER FOR INSYMA 10
Session 4 (15.00 - 16.00 WITA)
Room 5: Amlapura Room
1 Lely Dahlia Trilogi University Jakarta; [email protected]
Cooperative Entrepreneurship Paradigm as the Pattern of Cooperative Improvement
toAlleviate Poverty in KulonProgo Regency, 2013
OPERATION
2 Ellen Puspitasari, Ceacilia Srimindarti
Faculty of Economy University of STIKUBANK Semarang;
THE PERCEPTION OF ADOPTING AN INFORMATION TECHNOLOGY INNOVATION
ON THE RURAL BANKS OWNED BY LOCAL GOVERNMENT
OPERATION
3 Fidelis Arastyo Andono & Fandy San
Accounting/Faculty of Business and Economics Surabaya University;
MALMI AND BROWN’S MANAGEMENT
CONTROL SYSTEM IN PRODUCTION AREA
OPERATION
4Ratna Widiastuti Management Program, Faculty of Economy, Maranatha Christian University; [email protected]
Total Quality Management in Education (TQME): Prospective Strategy for University
OPERATION
BAHASA
SCHEDULE PRESENTATION PAPER FOR INSYMA 10
Session 4 (15.00 - 16.00 WITA)
Room 6 : Bangli Room
NO AUTHOR INSTITUTION TITTLE SUBJECT
1 Moh. Rofik, Nindria Untarini, Yessy Artanti
Department of Management, Faculty of Economic,
UNESA. Email: [email protected]
PERCEPTION OF ACCEPTANCE KOMMUTER TRAIN SIDOARJO-SURABAYA ROUTE TO WORK PLACE AS ALTERNATIVE CHOICE ON PUBLIC TRANSPORTATION
WITH PLANNED BEHAVIOR THEORY
OPERATION
2 Christina Esti Susanti Widya Mandala Catholic University;
INFLUENCE OF TRUST IN SUPPLIER AND TRUST IN BRAND ON THE PURCHASE AND
ATTITUDINAL LOYALTY FOR RETAILER AT PT SINAR SOSRO IN SURABAYA
OPERATION
3 Anita Wongso UBAYA
Activity Complaint Handling the Engineering Department Novotel Surabaya Hotel & Suites
OPERATION
4Samuel David Lee, Pandam Rukmi Wulandari ,Aris Budi Setyawan
Faculty of Economic, Accounting Departement, Gunadarma University. Email: [email protected]; [email protected];
EFFECTIVENESS OF IT GOVERNANCE IN BANKING SECTOR
The Effect of Financial Ratios to Stock Price in Several Companies listed in
SRIKEHATI Group in Indonesia Stock Exchange
Rosemarie Sutjiati Njotoprajitno
Maranatha Christian University
Abstract
Now adays most or maybe all company's goal is to improve their values which are shown in stock prices. This paper tries to examine the effects of factors which affect the stock price. This paper tries to study the effect of profitability (ROE), liquidity (CR), leverage (DER, DAR), EPS, and dividend policy (DPR) to stock price in the selected group of Indonesia stock market. The group of companies examined selected from the SRIKEHATI group in Indonesian stock market. This group is formed to adopt the sustainability issues that nowadays become public concern. About how the companies in the groups attain these criteria is not discussed in the paper. The study used quantitative approach. When the statistical process was executed, CR and DER variables have to be expelled since they didn’t pass the statistical test. The result show that ROE didn’t have significant effect to price while DAR, DPR, and EPS have significant effect to stock price which suggested that improvement in these financial ratios can be used as the media to improve stock price in SRIKEHATI listed companies.
Keywords: Profitability, liquidity, leverage, dividend policy, stock price
Introduction
In the past when someone were asked what is the purpose of the establishment of a
company then the answer is to get the largest possible profits that can be obtained. At the
present time, there is a slight shift in which the main objective of the establishment of a
company is to increase the value of the company itself. The value of the company can be
described from the price of the stock of the company itself. Therefore the management of the
company will continue to strive to improve its performance, correcting and improving the
various parts of the company in order to constantly improve the value of the company. The
success or failure of the company's management will be seen from how great the increase or
decrease in the value of the company. Financial ratios are often used as a measurement tool to
measure the improvement/decline of the company; therefore logically it should be directly
proportional to the increase/decrease in the company's stock price. This paper tries to study
policy (DPR) to stock price in the selected group of Indonesia stock market. The group of
companies examined selected from the SRIKEHATI group in Indonesian stock market. This
group is formed to adopt the sustainability issues that nowadays become public concern.
About how the companies in the groups attain these criteria is not discussed in the paper.
There are several theory and research about the relation of financial ratio selected
with stock price that might be different one to another. Basically, companies sell stock to
public to raise funds needed in their operational, investments, and other purpose. The shares
in circulation tend to rise or fall because some internal factors such as the company's
performance and other external factors or even simply because the supply and demands
activities. There are a lot of speculations how the performance of a company might effect to
stock price. Chandra (2009:197) stated that when properly combined, financial ratios may be
used to assess corporate excellence, judge creditworthiness, predict bankruptcy, and value
equity shares.
Return on equity shows how much return can be gained from the money brought by
the shareholders to the company. Logically investors would prefer company with higher ROE
since it shows promise of future profit for the investors. Martaniet.al. (2009:50) stated that
ROE (Return on equity), has significant positive correlation with return. A higher ROEshows
that the firm can earn higher return on shareholder’s equity. A higher ROE also indicates a higher efficiencyin spending money invested by shareholder to earn profit growth. Karaca
and Savsar (2012:62) research also shows that ROE have significant relation with firm value
with negative directions.
Khan (2012:18) shows the significant positive relation between Cash Dividend,
Retention Ratio and Return on Equity with Stock Market Prices while Earnings per Share and
Stock Dividend have negative and statistically insignificant relationship with Stock Market
Prices. About the leverage, Zhou (2008:160) shows that in market level, leverage can be both
statistically and economically important to options pricing. While Modigliani and Miller
(1958) shows that capital structure has no effect to the value of a company. Adami et. al.
(2010:21) stated that returns have a negative, albeit small, relation with leverage in all the
three models used for the estimation. It means an increase in leverage means a slight decline
in price. Hamada (1972) shows that if leverage is rising then price is rising as well, while
Earning per Share and dividends also directly shows the profit of the company and the
dividends which will be distributed to investors. Higher EPS shows that the company has
high capability to earn profit. While about dividend higher dividends will attract investors
that expect to gain profit from dividends while lower ones is assumed to be reinvested and
achieve capital gain. Miller and Modigliani (1961) proved that dividends are not relevant in
determining the value of a company (the theory assumes a world without taxes or transaction
cost, and investors having rational and having the same expectations). It means according to
their theory, a company values is not affected (independent) by dividends. About the
dividend policy, Brigham and Houston (2009:458) use formula Po= D1/(rs-g) that shows if a
company increase dividend payout ratio it will raise D1, which taken alone will cause the
stock price to rise, but at the same time it means less money will be available for
reinvestment and cause expected growth to decline and will tend to lower stock price. This
means dividends policy can be like double-edged sword which need to be considered fully.
These researches, to a larger extent, put attention on how these financial ratios
examined can affect stock price in the SRI KEHATI group and to what extent. There is still a
lot of difference result and theory about the relation of these ratios to stock price up till this
day. Since stock price is an important part to describe companies' values then this study
hopefully can give useful view to the companies to better improve the performance.
Research Methods and Data Collection
There are independent variables such as Return on Equity (ROE), Current Ratio (CR),
Debt to Equity Ratio (DER), Debt to Asset Ratio (DAR), Earning per Share (EPS), and
Dividend Payout Ratio. The dependent variable is Stock Price. The method used is
quantitative method. Quantitative method is done through collecting numeric data, process it
and analyze it in order to acquire scientific information of the numeric data (Martono,
2010:19). The information process is using SPSS programs. The data is collected from all the
go public companies listed in SRI KEHATI group in Indonesian stock market. This group
believed to be a group of company that has a good sustainability practices that represent
nowadays concerns. The data is secondary data from IDX sites collected from 2008-2011
Operational Definition of Variables
This part describes the operational definition for independent and dependent variables
that is discussed in the paper:
1. Profitability
Profitability describes the capability of the company to be profitable or to generate
money. Profitability ratio is the most frequently used financial ratio. Investors and
other parties tend to look at past profitability data and projects future profitability of a
company as their primary basis. They mostly put more attention to the ability of the
company to earn future profits and tend to use analysis that represents this.One of the
ratios of profitability used in this paperis Return on Equity (ROE) measuring the
return of the money investors put into a company. ROE is calculated in the following
way:
The most important goal of company's management is to maximize returns for its
stockholders, about this Rich et.al. (2010:646) stated that although the link between a
corporation's net income and increases in dividends and share price return is not
perfect, the return on equity ratio is still an effective measure of management
performance for the stockholders. It is the underlying assumption that the ratio of
ROE becomes one of the factors that determine the rate of return and stock price.
2. Liquidity
Liquidity ratio is a ratio that measure the capability of a company to pay their
lliability especially short term financial commitments as they become due and it is an
important measure of financial health. Sinha (2009:90) stated that the importance of
short-term liquidity can be felt from the repercussions of the claimants when a firm
fails to meet its obligations, and lack of sufficient liquidity prevents a firm from
taking advantage of favorable discounts or profitable opportunities. Further, shortage
of liquidity means limited opportunities and having constraints within management
work. The ratio used to represent liquidity in this paper is Current Ratio (CR). Current
ratio is the most basic liquidity test that can show the user whether a company has
enough current assets to meet its short term liabilities as they become due.
Current Ratio is calculated in the following way:
Sinha (2009: 93-94) stated that there are merits of current ratio such as:
a. It is able to measure how adequately current abilities are covered. The greater
the ratio, the greater the assurance can be given for meeting the current
liabilities.
b. This ratio indicates the degree of buffer against losses. The larger the ratio, the
larger is the buffer, and the lower is the risk. It helps in signifying the degree
of safety for covering shrinkage in values of non-cash current assets.
c. It shows the volume of liquid assets available as margin of safety against
uncertain shocks to firm from unexpected circumstances.
3. Leverage
Leverage is also an important measure of a company's financial health. Leverage can
describe a company financing methods. This paper use Debt to Asset Ratio (DAR)
and Debt to Equity Ratio (DER) to represent leverage. DAR or simply called debt
ratio Shows Company's debt percentage compared to total asset. DER is one of the
most important leverage ratios that describe how much is company is financed by
debt holders compared to owners (stockholders). DAR and DER is calculated in the
following way:
Morrell (2007:71) stated that DER is still considered one of the most important ratio
for an assessment of risk and solvency, although some analyst now rely more on the
less problematical interest cover. He stated that ideally net debt to equity should be
calculated, but some resources only allow the more traditional debt/equity to be
higher the lender's own investment (relative to the actual investment by the business's
owners) the riskier is the investment and the less interested they will be in loaning
money while at the owners perspective often seek to maximize their financial leverage
and create total liabilities to total equity ratios in excess of 1.00. The same also goes
for DAR which investors favor more debt while lenders favor less debt to ensure the
safety of loan payment.
4. Earning per Share
Earning per share (EPS) measure how much money earned by each share of stock.
Investors tend to put high attention to EPS. EPS can determine the success or failure
of a company and their ability to pay dividends to stockholders. EPS is calculated in
the following way:
5. Dividend Policy
Dividend policy might be different between companies. Companies that have high
growth rate usually have lower dividends pay rate than a companies that have lower
growth rate. Dividend policy might also differ according to the age of the companies;
younger companies might offer no dividends or low dividends policy. While most
people might prefers company who regularly pay high dividends from time to time
since the company is assumed to be a good one, Moles et.al. (2011:671) argues that it
doesn’t seem that simple, he argue that the companies that pays high dividends might did it because they already have more than enough money for all their future
investments opportunities (while they have a good future investment opportunities).
Or they pay high dividends because doesn't need much money because they have no
future investment opportunities. The second reason shows a bad signal of a company
future growth.
6. Stock Price
The stock price of a company doesn't directly have the same meaning with a company
value. First we have to multiply the stock prices with number of shares in circulation.
Examining stock price movements and the number of shares in circulation can shows
the growth of a company and many other things. But there are also cases of
make high profit or actually in a bad shape. Factors that surely affect stock price
movement is still become concern for many people.
Research Models
The analytical method used in this research is the analysis of linear regression
formulated as follows:
Y = a+b
1X
1+ b
2X
2+b
3X
3+b
4X
4+b
5X
5+b
6X
6Y = variable price X1 = variable ROE X2 = variable CR X3 = variable DER X4 = variable DAR X5 = variable Annual EPS X6 = variable DPR
a = Interception points b1-b5 = regression coefficient
Operation of Variable
1. Dependent variables (Y) is a logarithm transformation of price
2. X1 is a logarithm transformation of ROE
3. X2 is a logarithm transformation of CR
4. X3 is a logarithm transformation of DER
5. X4 is a logarithm transformation of DAR
6. X5 is a logarithm transformation of EPS
7. X6 is a logarithm transformation of DPR
Hypothesis
Based on the problems hypothesis is as follow:
1. Hypothesis 1: Return on Equity (ROE) has a positive and significant effect on stock
price of companies examined.
2. Hypothesis 2: Current Ratio (CR) has a positive and significant effect on stock price
of companies examined.
3. Hypothesis 3: Debt to Equity Ratio (DER) has a positive and significant effect on
4. Hypothesis 4: Debt to Asset Ratio (DAR) has a positive and significant effect on
stock price of companies examined.
5. Hypothesis 5: Earning Price Ratio (EPS) has a positive and significant effect on stock
price of companies examined.
6. Hypothesis 6: Dividend Payout Ratio (DPR) has a positive and significant effect on
stock price of companies examined.
7. Hypothesis 7: ROE, CR, DER, DAR, Annual EPS, DPR simultaneously has a positive
and significant effect on stock price of companies examined
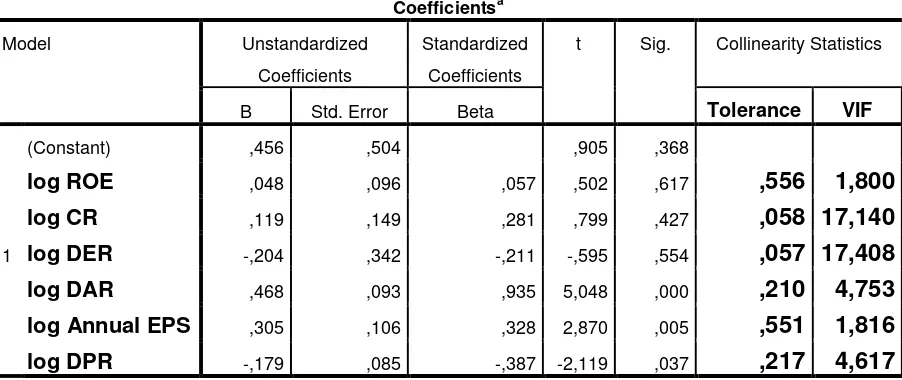
Statistical Tests
The statistical test of financial data being done through classical assumption stages:
[image:34.595.75.526.373.563.2]multicolinearity test, normality test, heteroscedasticity test.
Table 1 MulticolinearityTest -Stage 1
Coefficientsa
Model Unstandardized Coefficients
Standardized Coefficients
t Sig. Collinearity Statistics
B Std. Error Beta Tolerance VIF
1
(Constant) ,456 ,504 ,905 ,368
log ROE ,048 ,096 ,057 ,502 ,617 ,556 1,800
log CR ,119 ,149 ,281 ,799 ,427 ,058 17,140
log DER -,204 ,342 -,211 -,595 ,554 ,057 17,408
log DAR ,468 ,093 ,935 5,048 ,000 ,210 4,753
log Annual EPS ,305 ,106 ,328 2,870 ,005 ,551 1,816
log DPR -,179 ,085 -,387 -2,119 ,037 ,217 4,617
a. Dependent Variable: log Price
The requirements of multicolinearity are VIF ≤ 10, Tolerance ≥ 0,1, and table 1 shows that from stages 1 test CR and DER didn’t pass the test and have to be abandoned. And the formula customized to:
Y = a+b
1X
1+ b
2X
2+b
3X
3+b
4X
4X1 = variable ROE X2 = variable DAR X3 = variable Annual EPS X4 = variable DPR
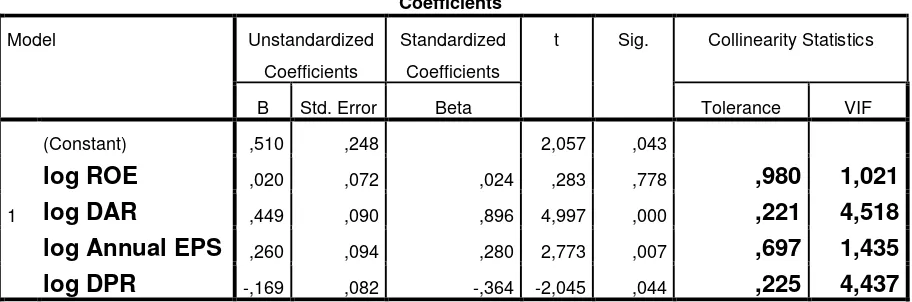
Table 2MulticolinearityTest -Stage 2
Coefficientsa
Model Unstandardized Coefficients
Standardized Coefficients
t Sig. Collinearity Statistics
B Std. Error Beta Tolerance VIF
1
(Constant) ,510 ,248 2,057 ,043
log ROE ,020 ,072 ,024 ,283 ,778 ,980 1,021
log DAR ,449 ,090 ,896 4,997 ,000 ,221 4,518
log Annual EPS ,260 ,094 ,280 2,773 ,007 ,697 1,435
log DPR -,169 ,082 -,364 -2,045 ,044 ,225 4,437
a. Dependent Variable: log Price
[image:35.595.153.443.331.504.2]The 2nd stage test shows that all variables pass the test and can be inserted to the next test.
Table 3 Normality -One-Sample Kolmogorov-Smirnov Test
Unstandardized Residual
N 96
Normal Parametersa,b Mean ,0000000 Std. Deviation ,19382548
Most Extreme Differences
Absolute ,078 Positive ,072 Negative -,078 Kolmogorov-Smirnov Z ,769 Asymp. Sig. (2-tailed) ,596
a. Test distribution is Normal. b. Calculated from data.
[image:35.595.72.528.608.754.2]Normality value is 0.596 (requirement sig value > 1%, 5%, or 10%) all variables pass the test.
Table 4 Heteroscedasticity test
Coefficientsa
Model Unstandardized Coefficients Standardized Coefficients
t Sig.
B Std. Error Beta
1
(Constant) -,728 2,293 -,318 ,751
log ROE -1,719 ,662 -,253 -2,598 ,011
log DAR -1,041 ,831 -,257 -1,253 ,213
log Annual EPS 1,201 ,868 ,160 1,382 ,170
a. Dependent Variable: ln
The test shows that all variables pass the test.
Results
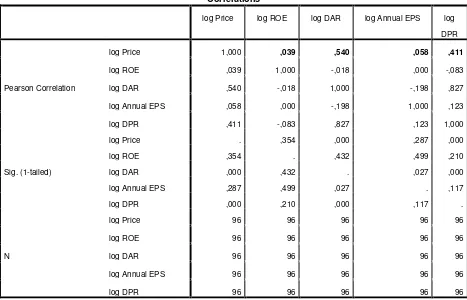
[image:36.595.72.539.266.566.2]This following table shows the result of data process:
Table5 Correlations Statistics
Correlations
log Price log ROE log DAR log Annual EPS log
DPR
Pearson Correlation
log Price 1,000 ,039 ,540 ,058 ,411
log ROE ,039 1,000 -,018 ,000 -,083
log DAR ,540 -,018 1,000 -,198 ,827
log Annual EPS ,058 ,000 -,198 1,000 ,123
log DPR ,411 -,083 ,827 ,123 1,000
Sig. (1-tailed)
log Price . ,354 ,000 ,287 ,000
log ROE ,354 . ,432 ,499 ,210
log DAR ,000 ,432 . ,027 ,000
log Annual EPS ,287 ,499 ,027 . ,117
log DPR ,000 ,210 ,000 ,117 .
N
log Price 96 96 96 96 96
log ROE 96 96 96 96 96
log DAR 96 96 96 96 96
log Annual EPS 96 96 96 96 96
log DPR 96 96 96 96 96
The results show partial effect of:
ROE to Price = 0,0392. 100% = 0,15%. (not significant and can be ignored)
DAR to Price = 0,5402. 100% = 29,16%.
Annual EPS to Price = 0,0582. 100% = 0,34%.
DPR to Price = 0,4112. 100% = 16,89%.
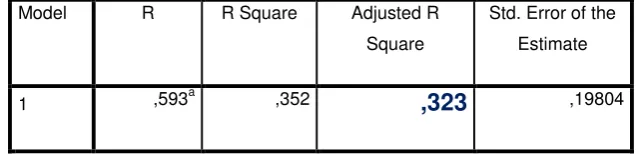
Model R R Square Adjusted R Square
Std. Error of the Estimate
1 ,593a ,352 ,323 ,19804
a. Predictors: (Constant), log DPR, log ROE, log Annual EPS, log DAR
b. Dependent Variable: log Price
[image:37.595.137.457.73.150.2]Simultaneously Effect = 0,323 or 32,3%
Table 7 ANOVAa
Model Sum of Squares df Mean Square F Sig.
1
Regression 1,937 4 ,484 12,348 ,000b
Residual 3,569 91 ,039
Total 5,506 95
a. Dependent Variable: log Price
b. Predictors: (Constant), log DPR, log ROE, log Annual EPS, log DAR
Simultaneously test proved to be having an effect and significant which it means the
[image:37.595.71.499.224.368.2]hypothesis of the research accepted. Sig value (0,000) < α (1%,5%, or 10%)
Table 8 Results
Coefficientsa
Model Unstandardized Coefficients
Standardized Coefficients
t Sig.
B Std. Error Beta
1
(Constant) ,510 ,248 2,057 ,043
log ROE ,020 ,072 ,024 ,283 ,778
log DAR ,449 ,090 ,896 4,997 ,000
log Annual EPS ,260 ,094 ,280 2,773 ,007
log DPR -,169 ,082 -,364 -2,045 ,044
Regression Formula
Y = a+b1X1 + b2X2+b3X3+b4X4
= 0,510 + 0,020 X1 + 0,449 X2 + 0,260 X3 - 0,169 X4
Y = log (price)
X1 = log (ROE)
X2 = log (DAR)
X3 = log (Annual EPS)
X4 = log (DPR)
a = 0,510 it means when X= 0, then Y (price) = 0,510
b1 = When log (ROE) increase by 1 point, then log (price) increase 0,020
b2 = When log (DAR) increase by 1 point, then log (price) increase 0,449
b3 = When log (Annual EPS) increase by 1point, then log (price) increase 0,260
b4 = When log (DPR) increase by 1 point, then log (price) decrease 0,169
Partial test shows:
Sig log (ROE) = 0,778- > α (1%,5%, or 10%), then research hypothesis is declined, partially
ROE didn’t have significant effect to price.
Sig log (DAR) = 0,000 < α (1%,5%, or 10%), then research hypothesis is accepted, partially DAR have a significant effect to price.
Sig log (Annual EPS) = 0,007 < α (1%,5%, or 10%), then research hypothesis is accepted, partially annual EPS have a significant effect to price.
Sig log (DPR) = 0,044 < α (5%, or 10%), then research hypothesis is accepted, partially DPR have a significant effect to price but whit negative sign.
ROE didn’t have significant effect to price in the SRI KEHATI group this is different
from the previous research and theory mentioned above.This could be affected by the fact
that companies that are in the group are composed of companies of diverse kinds. DAR has
significant effect to stock price. The finding about leverage has the opposite result with
Adami et. Al (2010:21) result mentioned above but somehow consistent with capital structure
theory which show that financing risk imposed by leverage will be rewarded with higher
be a positive sign toward investment and growth. The companies in the group which is a
assumedly as a sustainable companies believed to have strength and long term lifespan makes
the investors attracted while off course there is still limitation on how much the debt can give
this effect. If somehow the debt is pass certain optimum point then the fact could be reversed.
The length of the leverage is not examined here and need further study but it is believed that
the difference of the length of leverage can give opposite effect to stock price.
EPS have significant effect to stock price. This is the same with the other research or
theory mentioned above. Stock price will rise whenever EPS is rising. It also shows that
investors put attention to EPS in their decision.DPR have a significant negative effect to price
it could be means that investors in this group tends to prefer capital gains rather than
dividends.
The variables examined simultaneously shows significant effect to price and therefore
companies need to pay attention to improve their performance in order to shape the financial
ratio in a better form that can attract investor and improve company's value.
Conclusions and Limitations
From the statistical results shows that the variable ROE didn’t have significant effect to stock price, while variables DAR, annual EPS and DPR have significant effect to stock
price. Simultaneously, these variables show important meaning in determining stock price
and company values and therefore need to be considered more. This research also shows the
movement of stock price is also influenced by other factors that is not examined since it
simultaneously effect is 32.3%. Further researches that examine other factors are needed in
order to better describe the movement of stock price. Since SRI KEHATI group is composed
of companies of diverse kinds, further research that sort out these companies absolutely
essential.
Reference
Adami, R., Gough, O., Muradoglu, G., and Sivaprasad, S. (2010).The Leverage Effect on Stock Returns .Social Science Research Network. P 1-34. http://ssm.com /abstract=1690183 (access: 27 February 2013)
Chandra, Prasanna (2009). Investment Analysis and Portfolio Management. New Delhi: Tata McGraw-Hill Education Private Limited.
Dimitrov V and Jain P C (2008). The Value Relevance of Changes in Financial Leverage Beyond
Growth in Assets and GAAP Earnings. Journal of Accounting, Auditing and Finance
191-222.
Dopson, L.R. and Hayes, D.K. (2008).Managerial Accounting for the Hospitality Industry. New Jersey: John Wiley and Sons.
Hamada R S (1972). The Effect of the Firm’s Capital Structure on the Systematic Risk of
Common Stocks.Journal of Finance 27(2) 435-452.
Karaca, S.S. and Savsar, A. (2012).The effect of Financial Ratios on the Firm Value: Evidence from Turkey1. Journal of Applied Economic Sciences.Vol 7(2012), 55-63.
Khan, K.I. (2012). Effect of Dividends on Stock Prices – A Case of Chemical and Pharmaceutical Industry of Pakistan. Proceedings of 2nd International Conference on Business Management.(ISBN: 978-969-9368-06-6), 1-23
Martani, D., Mulyono, and Khairuruzka, R. (2009). The Effect of Financial Ratios, Firm Size, and Cash Flow from Operating Activities in the Interim Report to the Stock Return.Chinese Business Review, Jun. 2009, Volume 8, No.6 (Serial No.72), 44-55
Martono, N. (2010). Metode Penelitian Kuantitatif. Jakarta: PT Rajagrafindo Persada.
Miller, M. H. and Modigliani, F. (1961). Dividend Policy, Growth and the Valuation of Shares. Journal of Business, 34, 411-33.
Modigliani, F. and Miller M. H. (1958). “The Cost of Capital, Corporation Finance and the
Theory of Investment.”American Economic Review 48(3), 261–297.
Moles, P., Parrino, R. and Kidwell, D. (2011). Corporate Finance. UK: John Wiley & Sons Ltd.
Morrell, P.S. (2007). Airline Finance 3rd eds. England and USA: Ashgate Publishing Limited and Ashgate Publishing Company.
Rich, J.S., Jones, J.P., Mowen, M.M., and Hansen D.R. (2010). Cornerstone of Financial Accounting. USA: South-Western Cengage Learning.
Sinha, G. (2009). Financial Statement Analysis. New Delhi: Asoke K. Ghosh, PHI Learning Private Limited.
Zhou, Yi. (2008). Leverage, Asset Pricing and Its Implications. Los Angeles: University of California.
Financial Report Date September 2009-2010-2011
KODE TAHUN ROE CR DER DAR Annual EPS DPR Price
(%) (%) (Rp) (%)
AALI
2008 76.60 194.42 0.23 0.18 1,670.76 30.23 9,800.00 2009 40.16 182.58 0.18 0.15 1,054.55 85.82 22,750.00 2010 41.10 193.17 0.19 0.15 1,280.70 64.81 26,200.00 2011 39.55 130.97 0.21 0.17 1,586.65 62.71 21,700.00
ADHI
2008 20.97 113.25 7.75 0.88 45.23 25.44 270.00 2009 45.37 115.15 6.69 0.87 91.89 30.75 410.00 2010 37.26 121.37 4.71 0.82 105.19 30.75 910.00 2011 32.96 119.33 5.17 0.84 101.37 29.92 580.00
AKRA
2008 24.31 99.67 1.81 0.60 67.20 31.25 720.00 2009 26.89 95.87 2.20 0.63 87.54 28.56 1,170.00 2010 17.60 104.79 2.01 0.63 81.97 203.73 1,730.00 2011 20.70 135.73 1.32 0.57 133.75 168.22 3,025.00
ANTM
2008 23.93 801.65 0.26 0.21 143.43 40.07 1,090.00 2009 9.62 727.31 0.21 0.18 63.35 40.06 2,200.00 2010 23.72 381.77 0.28 0.22 176.49 40.07 2,450.00 2011 23.85 1,064.23 0.41 0.29 201.79 45.09 1,620.00
ASII
2008 46.44 132.17 1.21 0.50 2,270.30 38.32 10,550.00 2009 41.11 136.88 1.00 0.45 2,480.02 33.47 34,700.00 2010 42.65 126.18 1.10 0.48 3,548.60 13.24 54,550.00 2011 33.98 136.40 1.02 0.51 5,273.25 37.55 74,000.00
BBCA
2008 33.16 110.47 9.55 0.91 234.28 42.68 3,250.00 2009 32.11 110.94 9.14 0.90 276.10 39.84 4,850.00 2010 31.23 111.75 8.51 0.89 343.92 32.71 6,400.00 2011 32.40 112.37 8.09 0.89 436.84 35.94 8,000.00
BBNI
2008 12.52 108.30 12.07 0.92 80.04 10.00 680.00 2009 17.99 118.31 10.88 0.92 162.63 35.00 1,980.00 2010 16.56 115.39 6.50 0.87 219.95 30.00 3,875.00 2011 19.72 114.49 6.90 0.87 321.26 19.45 3,800.00
BBRI
2008 39.46 109.99 10.01 0.91 483.43 34.92 4,575.00 2009 36.29 109.41 10.63 0.91 592.73 22.28 7,650.00 2010 40.65 109.98 10.02 0.91 930.10 12.47 10,500.00 2011 37.65 111.86 8.43 0.89 620.07 19.72 6,750.00
BDMN
2009 30.83 109.82 10.23 0.91 341.22 5.65 4,700.00 2010 33.63 110.32 9.81 0.91 439.04 31.94 6,500.00 2011 26.35 112.81 7.81 0.89 534.83 19.63 6,750.00
INDF
2008 30.59 89.77 3.11 0.67 117.81 39.90 930.00 2009 40.02 116.09 2.45 0.62 236.42 39.34 3,550.00 2010 32.37 203.65 1.34 0.47 336.30 39.55 4,875.00 2011 20.10 190.95 0.70 0.41 571.43 30.62 4,600.00
INTP
2008 27.44 178.57 0.33 0.24 474.16 31.63 4,600.00 2009 35.54 300.55 0.24 0.19 746.12 30.16 13,700.00 2010 32.49 555.37 0.17 0.15 876.05 30.02 15,950.00 2011 29.92 698.54 0.15 0.13 978.35 29.95 17,050.00
ISAT
2008 13.36 90.49 1.95 0.66 345.70 50.00 5,750.00 2009 12.43 54.63 2.05 0.67 275.72 0.00 4,725.00 2010 6.06 51.55 1.94 0.65 119.10 50.00 5,400.00 2011 6.28 55.05 1.77 0.64 171.68 44.75 5,650.00
JSMR
2008 14.39 315.77 1.18 0.53 104.09 49.96 910.00 2009 15.23 115.64 1.17 0.52 145.98 60.22 1,810.00 2010 19.07 165.04 1.37 0.56 175.51 60.22 3,425.00 2011 18.68 106.05 1.32 0.57 194.35 40.59 4,200.00
KLBF
2008 32.52 333.35 0.38 0.24 69.60 17.96 400.00 2009 34.13 298.70 0.39 0.26 91.47 27.33 1,300.00 2010 32.95 439.36 0.23 0.18 126.66 55.27 3,250.00 2011 30.50 365.27 0.27 0.21 151.61 62.66 3,400.00
LPKR
2008 10.48 170.15 1.54 0.59 21.44 0.00 800.00 2009 10.78 177.34 1.40 0.56 22.43 0.00 510.00 2010 9.33 202.55 1.03 0.49 24.29 47.51 680.00 2011 10.47 206.31 0.94 0.48 25.13 31.00 660.00
LSIP
2008 41.50 170.06 0.54 0.35 679.74 30.60 2,925.00 2009 26.44 140.54 0.27 0.21 518.47 40.31 8,350.00 2010 30.34 239.27 0.22 0.18 757.25 8.06 12,850.00 2011 35.80 483.25 0.16 0.14 306.40 32.64 2,250.00
MEDC
2008 68.16 222.50 1.68 0.62 920.71 16.34 1,870.00 2009 7.13 155.40 1.85 0.64 54.44 0.00 2,450.00 2010 27.46 204.24 1.86 0.64 223.77 0.00 3,375.00 2011 42.49 160.52 2.02 0.67 1,323.48 0.00 2,425.00
PGAS
2008 18.11 217.65 2.47 0.69 27.60 151.24 1,860.00 2009 70.30 248.36 1.35 0.55 256.96 60.01 3,900.00 2010 58.14 343.40 1.22 0.53 257.38 60.00 4,425.00 2011 44.54 549.92 0.80 0.45 254.25 52.95 3,175.00 PJAA 2008 21.71 316.76 0.51 0.34 82.65 45.19 355.00
2010 17.87 200.00 0.47 0.31 88.60 46.84 840.00 2011 17.69 135.75 0.47 0.32 101.21 44.46 1,000.00
PTBA
2008 63.82 365.74 0.51 0.33 741.18 0.00 6,900.00 2009 65.98 491.23 0.40 0.28 1,183.84 45.06 17,250.00 2010 40.83 579.05 0.36 0.26 871.86 60.00 22,950.00 2011 49.71 463.25 0.41 0.29 1,339.27 60.03 17,350.00
SMGR
2008 44.48 338.58 0.30 0.23 425.45 50.58 4,175.00 2009 45.65 357.63 0.26 0.20 560.82 55.00 7,550.00 2010 39.33 29.17 0.29 0.22 612.53 50.00 9,450.00 2011 34.83 264.65 0.35 0.26 667.72 49.56 11,450.00
TINS
2008 55.20 262.41 0.51 0.34 2,667.10 4.99 1,080.00 2009 16.01 294.13 0.42 0.29 62.34 0.00 2,000.00 2010 26.82 323.67 0.40 0.29 188.34 50.00 2,750.00 2011 27.58 325.70 0.43 0.30 178.25 49.98 1,670.00
TLKM
2008 59.20 54.16 1.38 0.52 526.76 56.37 6,900.00 2009 57.32 60.58 1.22 0.49 526.76 51.25 9,450.00 2010 48.21 91.49 0.98 0.43 572.27 56.37 7,950.00 2011 34.20 95.80 0.69 0.41 767.91 48.32 7,050.00
UNTR
2008 34.60 163.62 1.05 0.51 799.77 40.01 4,400.00 2009 39.33 165.64 0.76 0.43 1,147.48 28.76 15,500.00 2010 31.37 156.59 0.84 0.46 1,164.13 50.68 23,800.00 2011 28.30 171.64 0.69 0.41 1,571.92 52.17 26,350.00
UNVR