CORPORATE FAILURE PREDICTION: A STUDY OF PUBLIC LISTED COMPANIES
IN INDONESIA STOCK EXCHANGE (IDX)
Compiled by:
Debby Octavia Boentoro
Student ID Number: 111219232
Supervisor A. Jatmiko Wibowo, SE., SIP. MSF.
International Business Management Program (IBMP) Faculty of Economics Atma Jaya Yogyakarta
Babarsari Street Number 43-44, Yogyakarta
Abstact
The main purpose of this research is to develop a model that can predict financial distress amongst public listed companies in Jakarta Stock Exchange from year 2008 until 2013. Author uses 216 companies as sample where 168 for healthy companies and 48 for distress companies. The methodology that use on this paper is using logistic regression analysis.
The result proves there are four financial ratios namely: Quick Asset Turnover, Cash Flow to Assets, Total Liabilities Total Assets, and Debt Ratio that have been found to be significant and useful for corporate failure prediction in Jakarta Stock Exchange. The results show that logistic regression analysis is a more reliable technique for predict financially healthy companies than distress companies. But, overall classification results of 81 percent prove that the model can describe the financial condition of the companies.
INTRODUCTION Research Background
Recently, the economic condition around the world is going stronger; it is caused by the open market policy that occurs almost around the world. Open market policy allows countries that participate to the organization can sell (export) or buy (import) products or services without paying a tax. This policy gives big advantages to the companies that have strong economic condition to get higher profit and increase the number of export. But, not all companies get the advantages of that policy. New and small companies which cannot survive and compete with others companies especially from foreign will face difficulty that leads into bankruptcy.
Bankruptcy or Business failure is the important fact of life in the business environment. Business failure occurs when a firm is unable to meet its obligations. Over the past few years business failure have been rising and become more seriously. The effect of business failure gives lots negative impact to the shareholders, creditors, suppliers, owner(s), and employees who work in that company and also it gives indirect effects to the society such as increasing unemployment and criminality.
Actually, financial failures (financial distress) that lead into bankruptcy are generally evidenced long before the event. Early indicators of bankruptcy include decreasing amount of profit, increasing debt, declining number of sales, etc. Since failures cause many social and economic problems, their avoidance is highly beneficial. Due to big impact caused by failure, failure prediction has become an important topic in corporate finance literature over the past two decades. That’s why now adays many researchers try to developed model of failure prediction to predict accurately and precisely.
Problem Statement
In conducting research about failure prediction, Author is immediately confronted with one problem:
Is the logistic regression analysis can predict corporate failure in Indonesia Stock Exchange (IDX) accurately?
Research Scope
Research Objectives
The objective of this research is to develop a model that can predict financial distress amongst public listed companies in Indonesia Stock Exchange (IDX) using regression analysis.
THEORETICAL BACKGROUND
Corporate failure is situation when company faced crisis in terms of financial and do not take proper actions that can avoid bankruptcy. According to (Bryan, 2012), financial distress in firms that lead to bankruptcy is generally evident long before the event. Based on that study, Author believes that predicting bankruptcy is necessary to investigate.
Financial Distress
Financial distress is a situation where a firm’s operating cash flows are not sufficient to satisfy current obligations (such as trade credits or interest expenses), and the firm is forced to take corrective action. According to Platt and Platt (2012), financial distress may lead a firm to default on a contract, and it may involve financial restructuring between the firm, its creditors, and its equity investors. Usually the firm is forced to take actions that it would not have taken if it had sufficient cash flow.
Bankruptcy
Financial distress may or may not lead into Bankruptcy. A firm is in financial distress when it is having trouble paying its debts as they come due.On the other hand, a firm is bankrupt when it has filed a petition for relief from its creditors under the bankruptcy codes, or when it has consented to a filing by its creditors (Chang, 2000).
In Indonesia, Indonesia Bankruptcy system regulated by Undang Undang Republic Indonesia No. 37 Tahun 2004 Tentang Kepailitan dan Penundaan Kewajiban Pembayaran Utang. (BPKP, 2004). According to the UU No. 37 Year 2004 Bankruptcy process is performed in the Commercial Court.
There are two sources of bankruptcy:
1. External Factors 1.1Market Condition
Market condition is related with business cycle. Usually customers want something that in the trend situation, they do not want to buy something that out of trend.
1.2Intense Competition
1.3Other causes
Bankruptcy can result from a host of other underlying problems that inhibit profitability. Some other factors that can contribute to bankruptcy include poor business location, loss of key employees, lawsuits raised by competitors and personal issues like illness or divorce. Unforeseen disasters and criminal activities like floods, storms, theft, and fraud can also cause hardships that lead to bankruptcy.
2. Internal Factors 2.1Poor Management
According to Dun & Bradstreet survey, 94 percent of business failure was caused by lack of management experience, unbalanced experience, or outright managerial incompetence. For the additional information, based on the book of RE-CODE YOUR CHANGE DNA by Rhenald Kasali (2007), the author motivates managers in the companies to change if they want to improve the condition of their companies to avoid bankruptcy. 2.2Unwise Expansion
This situation happened when the company only focus to expand the company without consider other negative possibilities. Because of that policy, whole company can faced bankruptcy. Author does not say that expansion is bad; expansion is good and profitable if the company consider all possibilities wisely. 2.3Too Much Debt
When company faced too much debt, it makes the amount of interest payment also huge and decrease the profit which company can get. If the company has higher debt than profit (negative profit) it makes company difficult to pay other obligations and lead it into bankruptcy.
In this study, author only focus on the internal sources of bankruptcy which is related to the financial statement.
How to detect bankruptcy?
One indicator to consider that company will faced bankruptcy is financial distress. Financial distress is the situation when the company faced difficulty in terms of financial which means the company difficult to meets its obligation. Company which faced financial distress does not faced bankruptcy yet but if the company does not take any proper strategies to handle its condition, it will lead into bankruptcy.
These are written reports that quantify the financial strength, performance and liquidity of a company. Financial Statements reflect the financial effects of business transactions and events on the entity (Ammar Ali, 2010).
Financial Ratios
One of the measurements to detect financial distress is the calculation of financial ratio from the data in the financial statement of the company. Financial ratio simplifies the process of determining the health of a listed company and make reported financial information more meaningful and useful for investors. Financial ratio analysis must form the basis of all investment decisions, because without knowing the true financial position of a company you are purely speculating (Graham, 1928).
Relationship Between Financial Ratios to the Bankruptcy (Conceptual Framework)
(1)Liquidity Ratio has negative relationship to Bankruptcy
According to ASA (2010), the higher value of liquidity ratio indicates that the company ability to pay off its debt obligation is greater. Based on that theory, Author makes a conclusion that Liquidity ratio has negative relationship to bankruptcy because the higher the value of liquidity ratio, the lower the probability of the company faced bankruptcy.
(2)Leverage/ solvency ratio has positive relationship to Bankruptcy
According to ASA (2010), the higher the value of leverage ratio, the more debts than assets that company has. It means that the more value of leverage ratio of the company the higher risk that company has. Based on that theory, Author concludes that the leverage or solvency ratio has positive relationship to bankruptcy.
(3)Profitability ratio has negative relationship with Bankruptcy
According to the theory of ASA (2010), Profitability ratios measure a company’s performance and provide indication of its ability to generate profits. The higher the value of profitability ratio, the higher the ability of the company to generate the profit. Based on that theory, Author concludes that profitability ratio has negative relationship to the bankruptcy because the higher the value of profitability ratio the lower the probability that company to faced bankruptcy.
(4)Valuation ratio has negative relationship with Bankruptcy
of valuation ratios the lower the probability of the company to faced bankruptcy.
Hypotheses
In conducting research about failure prediction, Author is immediately confronted with one hypothesis:
Logistic Regression Analysis can be used to predict financial distress amongst public listed companies in Indonesia Stock Exchange (IDX) accurately.
RESEARCH METHODOLOGY Population and sample
Researcher will use all of the companies that listed in the Indonesia Stock Exchange (IDX) as population. Based on the data of companies that have been listed in the year 2009, there are 395 companies.
From the population, it will be sampled. The sample method that used in this research is using purposive sampling. Purposive sampling is the sampling method that used some criteria to select the samples (Amalia and Kristjiadi, 2003:13). The criteria that used in this research are:
1) Company has been listed in the Indonesia Stock Exchange in year 2007
2) The company has been published their financial statement in period of 2008-2013
3) The company has completed data of financial statement in the Indonesia Capital Market Directory (ICMD) and Jakarta Stock Exchange (IDX).
4) The criteria of the company that has financial distress are has negative gross profit (Hofer, 1980; and Whitaker, 1999) or faced decreasing gross profit up to 50 % (Sheikhi, 2011).
5) The company does not classify as delisting companies in the Jakarta Stock Exchange (IDX).
6) Companies that chosen as the samples classified as “0” (healthy companies) and “1” (distressed companies).
Data and Data Gathering
This research is using secondary data as main data which means the data have been processed and published by partly entitled (Supranto, 1987). Secondary data that used in this research are getting from the data that have been processed and published by Jakarta Stock Exchange (IDX) on www.idx.com and Indonesia Capital Market Directory (ICMD). For additional knowledge and information, author also used data from text books, articles, and journals.
Methods used in data gathering are archival and online research. Archival method used to find data with content analysis from books or journals. While online research conducted to collect secondary data using the technique of collecting data with the data base. Both of the methods provide clear ideas for the author to conduct the research.
Sources of the data that used in this research are come from:
(1) Company financial statement from year 2008-2013
(2) Indonesia Capital Market Directory in period of 2008-2013
Data analysis in this research is using IBM SPSS Statistics 19 Software.
RESEARCH VARIABLES 1. Independent Variables
Independent variables are variables that varied or manipulated by the researcher. An independent variable is the presumed cause, whereas the dependent variable is the presumed effect (Dependent and Independent Variables).
There is no theoretical approach to select the variables to failure prediction. According to Laitinen and Laitinen (2000), the choice of financial ratios as variables in financial distress prediction is constructed from a series of trial and error processes as practiced by most of the researchers in previous studies. Based on that understanding and opinion, author concludes that there are no good or bad variables in predicting failures. Therefore in this study, author selects the variables based on the significance and recognition of financial ratios in earlier studies.
Activity Ratio
Quick asset turnover Sales/(cash + receivables)
Current asset turnover Sales/current assets
Asset turnover Sales/total assets
Days sales in receivable Receivables/(sales/365)
Sales to fixed assets Sales/fixed assets
Cash Flow Ratio
Cash flow to assets Earnings before interest, taxes, depreciation and amortization (EBITDA)/total assets Cash flow to total debt EBITDA/total liabilities
Liquidity Ratio
Current Ratio Current Assets/Current Liabilities
Leverage/Solvency Ratio
Total liabilities to total assets (Debt Ratio)
Total liabilities/total assets
Debt to equity Total liabilities/(total assets-total liabilities)
Profitability ratio
Return on equity (ROE) Net income/(total assets – total liabilities)
Source: (Shuk-Wern Ong)
2. Dependent Variable
The dependent variable is the response that is measured. The dependent variables in this study are using dichotomous variables. Dichotomous variables are nominal variables that only have two levels or categories. Therefore, in this study the two categories are y = 0 (is for healthy companies) and y = 1 (is for distressed companies).
3. Control Variable
Control variable is variable that controlled the dependent and independent variables to minimize the effect of external variables. The purpose of using control variable is to handle factors that may or may not disturb the result analysis (Pramunia, 2010). In this study, control variable that used by the author is the same industry.
only industrial firms. Author also exclude secondary stocks of existing firms and foreign stocks and Investment or Financial Trusts as they are often voluntarily liquidated after a few years or terminated upon agreement (Christidis & Gregory, 2010).
Author used same industry to minimize bias. (Shuk-Wern Ong, A corporate failure prediction: a study of public listed companies in Malaysia, 2011)
METHOD OF ANALYSIS AND HYPOTHESIS TESTING Descriptive statistics of independent variables
Descriptive statistics of independent variables is the method of analysis that using independent variables and used to estimate the logistic regression model in this paper. The purpose is to describe the data through mean and standard deviation. Mean shows the average of the sample, and standard deviation shows how much each measurement deviates from the mean on average (Andrew MacMillan, 2007). Financially healthy companies have higher mean of all financial ratios that used in this study except for current asset turn over. Higher mean of current asset turn over in distress companies give a signal that distress companies would probably have difficulties to meet their short-term credit obligations.
Logistic Regression Analysis Model
Method of analysis used to predict financial distress amongst public listed companies in Indonesia Stock Exchange (IDX) in this study is Logistic Regression Model which use financial ratio as an indicator. Logistic Regression models also known as LOGIT analysis are a combination of multiple regressions and discriminated analysis. Logistic Regression is the appropriate statistical technique when the dependent variable is categorical nominal or non metric variable and the independent variables are metric variables (Hair et al., 2006). Logistic regression also used to predict and explain binary (two-group) categorical variable rather than a metric-dependent measurement. In this study, the metric-dependent variables are two-group categorical variable: distressed two-group and non-distressed two-group.
Where:
Logit i = Financial Distress ( 1 = Distress and 0 = healthy)
b0 = Constants
b1, b2, bn = coefficient of regression
X1, X2, Xn = independent variables
Estimation results of logistic regression analysis
In this part, author wants to show the statistical test of individual predictors to know which independent variables are significant and not by looking the significant values of each variable. If the significant value is lower than 0.05 (alpha 5%), means that the variable can used as a significant predictor to predict corporate failure.
The second information that wants to show by the author is Wald χ2 statistics. Wald χ2 statistics are used to test the significance of individual coefficients in the model. Each Wald statistic is compared with a χ2 distribution with 1 degree of freedom. Actually, Wald χ2 statistics just support the result of significant value of each independent variables.
Author also gives the information about coefficient value of each independent variable. If the coefficient value is negative means that the higher the value the lower the probability of the company to faced failure. Otherwise if the coefficient value is positive means that the higher the value the higher the probability of the company to faced failure.
Hypothesis Testing
Hypothesis testing refers to the formal procedures used by statisticians to accept or reject statistical hypotheses (Startrek, 2015). The major purpose of hypothesis testing is to choose between two competing hypotheses about the value of a population parameter. In this study, author uses the significant value of the Hosmer table where if the significant value is higher than 0.05 (5%) means that we have to accept H0 and reject Ha. Otherwise, if the significant value of Hosmer is lower than 0.05 (5%) means we have to reject H0 and accept Ha. (Oomarudin, 2008).
Relationship between the model and financial ratios
To conduct a research, author also checks the result of Nagelkerke R². Nagelkerke R² shows how strong independent variables explain the dependent variable. In this study, Nagelkerke R-square is used to know how strong financial ratios explain the distress and healthy group. The higher the value of Nagelkerke R² the better the model.
Classification results of logistic regression analysis
DATA ANALYSIS
Descriptive statistics of independent variables
Descriptive statistics are used to describe the basic features of the data in a study. They provide simple summaries about the sample and the measures. (William M.K. Trochim, 2006). Descriptive analysis is important because if we presented the raw data, it would be difficult to describe what the data was showing, especially if the data was a lot.
INDEPENDENT VARIABLES DISTRESS COMPANY
HEALTHY COMPANY
MEAN SD MEAN SD
ACTIVITY RATIO
1.QUICK ASSET TURNOVER 8.729 19.463 5.752 6.518 2. CURRENT ASSET
TURNOVER 2.262 2.852 2.484 4.003 3. ASSET TUNOVER 1.000 1.177 1.200 1.438 4. DAYS SALES IN
RECEIVABLE 75.042 158.442 58.795 78.798 5. SALES TO FIXED ASSETS 103.155 1338.330 16.809 78.798
CASH FLOW RATIO
6. CASH FLOW TO ASSETS -0.008 0.193 0.097 0.145 7. CASH FLOW TO TOTAL
DEBT -0.107 2.613 0.285 0.523
LIQUIDITY RATIO
8. CURRENT RATIO 13.219 88.832 2.214 4.047 LEVERAGE/SOLVENCY
RATIO
9. DEBT RATIO 0.544 0.493 0.534 0.428 10. DEBT TO EQUITY 1.640 3.491 1.228 4.117
PROFITABILITY RATIO
11. RETURN ON EQUITY
(ROE) -0.067 0.803 0.108 1.163
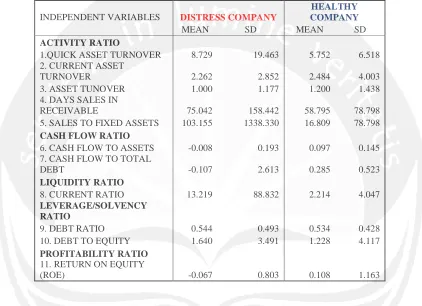
Table above reports the descriptive statistics of explanatory variables for group 0 (healthy) and group 1 (distress). It shows the general relationship and differences in the financial ratios of healthy and distress firms.
[image:11.612.97.519.199.505.2]companies take a shorter period to collect money from their debtors. The mean of sales to fixed assets for distress and healthy companies are 203.255 and 16.809. It indicates that both of distress and healthy companies have been more effective in using the investment in fixed assets to generate revenues.
The mean of cash flow to assets for financially healthy and distress companies are 0.097 and -0.008, respectively. Apart from that, the cash flow to total debt for healthy companies is 0.285, while the ratio is -0.107 for distress companies. The negative sign for both cash flow ratios shows indicates that distress companies are facing a loss.
Current ratio shows the ability of the companies to meet their short-term credit obligation. The mean of current ratio for financially healthy and distress companies are 2.214 and 13.219 which means that the distress companies may not faced difficulties to meet their short-term credit obligation.
The mean of debt ratio for financially healthy and distress companies are 53 percent and 54 percent. The mean of debt to equity ratio for healthy and distress companies are 1.64 and 1.23. It indicates that distress companies have higher debt than healthy companies and it affects the condition of the company itself.
The mean of Return on Equity for financially healthy and distress companies are 0.108 and -0.067. It indicates that distress companies faced difficulties to use money from shareholders to generate profit. So, the higher return on equity the better because it is show that the company is using its investors’ funds effectively. (Shaun, 2015)
Estimation results of logistic regression analysis
In this part, author wants to show the important information need to understand which variables that fit to the model and what variable that give positive and negative effect to the model.
Variables Coefficient Wald test Sig.
Activity Ratio
Quick asset turnover 0.029 9.980 0.002 Current asset turnover -0.016 0.438 0.508 Asset turnover 0.050 0.315 0.574 Days sales in receivable 0.001 2.349 0.125 Sales to fixed assets 0.000 1.201 0.273
Cash flow ratio
Cash flow to assets -7,309 55.093 0.000 Cash flow to total debt 0.181 1.471 0.225
Solvency ratio
Total liabilities to total assets -0,636 4.937 0.026 Debt to equity 0.032 1.413 0.235
Liquidity ratio
Current ratio 0.029 4.773 0.029
Profitability ratio
As we can see on the coefficient column, current asset turnover, cash flow to assets, total liabilities to total assets and return on equity are negatively correlated with the probability of a firm going into financial distress. Means that the higher the values of these ratios the lower the probability of the company faced bankruptcy. And the rest (seven ratios) are positively correlated with the probability of a firm going into financial distress. Means that the higher the values of those ratios, the higher the probability of the company to faced bankruptcy.
Based on the coefficient result, author makes a new logistic regression equation that use in this research which is:
! !
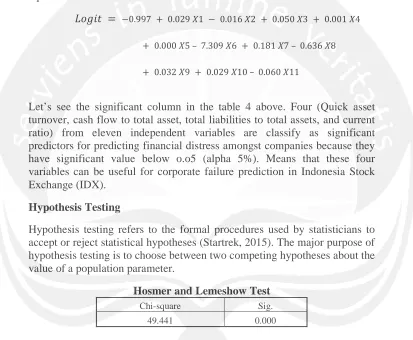
Let’s see the significant column in the table 4 above. Four (Quick asset turnover, cash flow to total asset, total liabilities to total assets, and current ratio) from eleven independent variables are classify as significant predictors for predicting financial distress amongst companies because they have significant value below o.o5 (alpha 5%). Means that these four variables can be useful for corporate failure prediction in Indonesia Stock Exchange (IDX).
Hypothesis Testing
Hypothesis testing refers to the formal procedures used by statisticians to accept or reject statistical hypotheses (Startrek, 2015). The major purpose of hypothesis testing is to choose between two competing hypotheses about the value of a population parameter.
Hosmer and Lemeshow Test Chi-square Sig.
[image:13.612.104.517.217.557.2]49.441 0.000
Relationship between the model and financial ratios
Nagelkerke R-square is one way to know how strong the independent variables explain the dependent variable. In this study, Nagelkerke R-square is used to know how strong financial ratios explain the distress and healthy group.
Nagelkerke R-Square
Nagelkerke R-Square 0.185
Nagelkerke R² (also known as coefficient of determination) of this model is 0.185 means that 18.5 percent of the variance in the dependent variable; distress and healthy groups can be explained by the financial ratios in this analysis. And the rest, 81.5 percent shows that there are other factors that can explain the dependent variable in this study.
Classification results of logistic regression analysis
In this part, author wants to show whether the prediction can show the real condition of the company or not. The higher percentage correct means the prediction can predict more accurately the model.
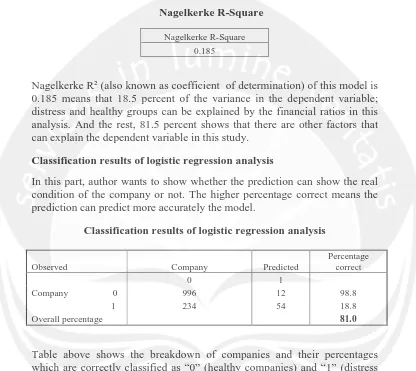
Classification results of logistic regression analysis
Observed Company Predicted
Percentage correct
0 1
Company 0 996 12 98.8 1 234 54 18.8
Overall percentage 81.0
Table above shows the breakdown of companies and their percentages which are correctly classified as “0” (healthy companies) and “1” (distress companies) for the logistic regression analysis. Based on the result, author concludes that logistic regression analysis as a model in this study has been succeed better to predict healthy companies rather than distress companies with 98.8 percentage correct. On the other hand, logistic regression analysis can explain company which faced distress with 18.8 percent. But overall, we can say that logistic regression analysis is a good model because it is able to explain the condition of the company with 81 percent of overall percentages.
[image:14.612.101.517.158.529.2]analysis can predict corporate failure in Indonesia Stock Exchange (IDX) accurately?)
CONCLUSION, LIMITATION, AND SUGGESTION
Conlusion
This study reveals that not all financial ratios can be used as significant predictors to predict financial distress amongst companies. However, there four financial ratios that give significant results and can be used to predict financial distress are:
a. Quick Asset Turnover (QAT) gives positive effect which means the higher the value the higher the probability of the company to faced financial distress.
b. Cash Flow to assets (CFA) gives negative effect which means the higher the value the lower probability of the company to faced financial distress.
c. Total Liabilities Total Asset (TLTA) gives negative effect which means the higher the value the lower probability of the company to faced financial distress.
d. Current Ratio (CR) gives positive effect which means the higher the value the higher the probability of the company to faced financial distress.
The conclusion of this research is derived from the hypothesis testing to answer the problem statement:
The hypothesis of Ha which states that logistic regression analysis can be used to predict corporate failure in Indonesia Stock Exchange (IDX) accurately is supported.
The classification results show that logistic regression analysis is a more reliable technique for predict financially healthy companies than distress companies. But, overall classification results of 81 percent prove that the model can describe the financial condition of the companies.
Limitation
As limitations, author did not select the sample with closest asset size and also author only used one model which is Logistic Regression Model in this study. Both of these factors may affect the results.
Suggestion
REFERENCES
Ammar, A., (2010), “Definition- What are Financial Satatements?”, Accounting-Simplified, accessed from http://accounting-simplified.com/financial/statements/types.html on May 12th, 2015.
ASA., (2010), “The Top 15 Financial Ratio”, Australian Shareholders’ Association.
BPKP, (2004), Peraturan, Jakarta.
Bryan, D., Guy, D.F., and Tripathy, A., (2012), “ Bankruptcy risk, productivity and firm strategy”, Review of Accounting and Finance, XXII (4), pp.309-326.
Christidis, A.C., and Alan, G., (2010), “Some New Models for Financial Distress Prediction in the UK”, Centre for Finance and Investment, X (4), pp. 1-46.
Mbanwie, G., and Ngam, E.N., (2009), “Financial Rations as Bankruptcy Indicators: The case of Financially Distressed Firms in Sweeden”, Master Degree Project, pp. 1-48.
Millan, A.M., (2007), “Basic Statistics”, accessed from https://controls.engin.umich.edu/wiki/index.php/Basic_statistics:_ mean,_median,_average,_standard_deviation,_z-scores,_and_p-value on April 17th 2015.
Ong, S.W., Voon, C.Y., and Roy, W.L., (2011), “Corporate failure prediction: a study of public listed companies in Malaysia”, Managerial Finance, XXXVII (6), pp. 553-564.
Oomarudin, I., (2008), “Rasio Keuangan Sebagai Prediksi Financial Distress pada Perusahaan Manufaktur di Bursa Efek Jakarta”, Thesis Summary, Sekolah Tinggi Ilmu Ekonomi Perbanas Surabaya. (unpublished).
Ross, D.H., (2012), Financial Distress, McGraw-Hill.
Shaun ., (2015), “Financial Ratio”, My accounting course, accessed from www.myaccountingcourse.com on July 22th,2015.
Startrek., (2015), “What is Hypothesis Testing?”, AP Statistical Tutorial, accessed from http://stattrek.com/hypothesis-test/hypothesis-testing.aspx on July 23th, 2015.
Trochim, M.K., (2006), “Descriptive Statistics”, Research Method
Knowledge Base, accessed from