Oktian Fajar Nugroho, 2013
The Effect Of Poster Presentation Towards Students’ Creativity And Concept Comprehension About Pollution Concept
THE EFFECT OF POSTER PRESENTATION TOWARDS
STUDENTS’ CREATIVITY AND CONCEPT COMPREHENSION
ABOUT POLLUTION CONCEPT
Research Paper
Submitted as requirement to obtain degree of Sarjana Pendidikan in International Program on Science Education study program
Proposed by:
OKTIAN FAJAR NUGROHO 0901944
INTERNATIONAL PROGRAM ON SCIENCE EDUCATION FACULTY OF MATHEMATIC AND SCIENCE EDUCATION
The Effect of Poster Presentation
to ards Students’ Creati ity and
Concept Comprehension about
Pollution Concept
Oleh
Oktian Fajar Nugroho
Sebuah skripsi yang diajukan untuk memenuhi salah satu syarat memperoleh gelar Sarjana pada Fakultas Pendidikan Matematika dan Ilmu Pengetahuan Alam
© Oktian Fajar Nugroho 2013 Universitas Pendidikan Indonesia
September 2013
Hak Cipta dilindungi undang-undang.
Oktian Fajar Nugroho, 2013
The Effect Of Poster Presentation Towards Students’ Creativity And Concept Comprehension About Pollution Concept
SHEET OF LEGITIMATION
THE EFFECT OF POSTER PRESENTATION TOWARDS STUDENTS’ CREATIVITY AND CONCEPT
COMPREHENSION ABOUT POLLUTION CONCEPT
By:
Oktian Fajar Nugroho 0901944
Approved and Authorized by, Supervisor I
Prof. Dr. Fransisca Sudargo, M.Pd NIP. 195107261978032001
Supervisor II
Dr. Yayan Sanjaya, M.Si NIP. 197112312001121001
Perceive,
Head of International Program on Science Education Study Program
THE EFFECT OF POSTER PRESENTATION TOWARDS
STUDENTS’ CREATIVITY AND CONCEPT COMPREHENSION ABOUT
POLLUTION CONCEPT
Oktian Fajar Nugroho Indonesia University of Education International Program on Science Education
ABSTRACT
This study aims to examine the effect of poster presentation towards students’ creativity and concept comprehension about pollution concept. The type of this study was weak experiment with one group pretest and postest design. Population in this research was grade 10 of senior high school students at Bina Nusantara International School Serpong consists of 10 classes. The sample has taken by using random cluster sampling technique. The quantitative data of this research has gained through concept comprehension test and observational sheet, meanwhile the qualitative data gathered through rubric and questionnaire Based on the analysis of the result, this research obtained improvement in concept comprehension with normalized gain 0,307 which was categorized into medium improvement. The correlation between students’ creativity and concept comprehension done by using coefficient correlation which the result is 9%, meaning that 9% of concept comprehension may be explained by creativity. Based on the result of questionnaires about the use of poster presentation, it may be concluded that students were enjoying the use of poster presentation.
Oktian Fajar Nugroho, 2013
The Effect Of Poster Presentation Towards Students’ Creativity And Concept Comprehension About Pollution Concept
PENGARUH POSTER PRESENTATION TERHADAP KREATIFITAS SISWA DAN PENGETAHUAN KONSEP TENTANG KONSEP POLUSI
Oktian Fajar Nugroho Universitas Pendidikan Indonesia International Program on Science Education
ABSTRAK
Penelitian ini bertujuan untuk mengetahui pengaruh dari poster presentation terhadap kreatifitas siswa dan pengetahuan konsep tentang konsep polusi. Tipe penelitian ini adalah weak experiment dengan one group pretest dan postest design. Dalam penelitian ini populasinya yaitu kelas 10 dari sekolah menengah atas di Bina Nusantara International School Serpong terdiri dari 10 kelas. Sampel penelitian diambil menggunakan teknik random cluster sampling technique. Data kuantitatif dalam penelitian ini diambil melalui tes pengetahuan konsep dan lembar observasi, dimana data kualitatif didapat melalui rubrik penelitian dan kuisioner. Dari hasil analisa, dalam penelitian terdapat peningkatan dari pengetahuan konsep dengan normalitas gain sebesar 0,307 dengan kategori peningkatan sedang. Korelasi diantara kreatifitas siswa dan pengetahian konsep menggunakan coefficient corellation dengan nilai 9%, artinya 9% dari pengetahuan konsep siswa dapat dijelaskan dengan kreatifitas. Dari hasil kuisioner tentang penggunaan poster presentation, dapat disimpulkan bahwa siswa merasa nyaman saat menggunakan poster presentation.
TABLE OF CONTENT
APPROVAL FORM OF RESEARCH PAPER ... i
DECLARATION ... ii
PREFACE ... iii
ACKNOWLEDGEMENT ... iv
ABSTRACT ... vi
TABLE OF CONTENT ... vii
LIST OF TABLES ... x
LIST OF FIGURES ... xii
LIST OF APPENDIX ... xiii
CHAPTER I: BACKGROUND A. Background ... 1
B. Research Problem ... 3
C. Research Questions ... 3
D. Aim of the Study ... 3
E. Limitation of Research ... 3
F. Assumption ... 3
G. Organization Structure of Research Paper ... 4
H. Significant of Research ... 5
CHAPTER II : LITERATURE REVIEW A. Poster Presentation ... 6
B. Creativity ... 9
C. Concept Comprehension ... 10
D. Pollution ... 13
E. Hyphothesis ... 19 CHAPTER III : RESEARCH METHODOLOGY
Oktian Fajar Nugroho, 2013
The Effect Of Poster Presentation Towards Students’ Creativity And Concept Comprehension About Pollution Concept
1. Research Location and Period ... 20
2. Population and Sample ... 20
B. Type of Experimental Design ... 20
C. Research Method ... 21
D. Operational Definition ... 21
E. Research Instrument ... 22
F. Instrument Development ... 22
G. Data Analysis ... 31
H. Research Procedure ... 35
I. Scheme of Research ... 36
J. Design of Poster Presentation ... 37
CHAPTER IV : RESULTS AND DISCUSSIONS A. Results ... 38
B. Discussions ... 51
CHAPTER V : CONCLUSIONS AND RECOMENDATIONS A. Conlusions ... 56
B. Recomendations ... 57
REFFERENCES ... 58
CHAPTER I INTRODUCTION
A. Background
There are several things that hang on experiences and adding visualization in the teaching learning practice for the student in the class that can improve students soft skill. Visualize the concept of the science materials can increase students interest to science. This thing has already implemented in some schools, such as poster presentation as assessment. Visualize the concept of science is also benefit during the teaching activities.
Some students seem to be less interested in the science class while they were only listening to teacher’s explanation, taking notes and explanation only. Sometimes, teacher
hard to find or identify the students who has already understood about the material or they who don’t understand about the material. When I was a child, I like visualization in science, maybe visualization can answer the question of how to measure student understanding about the material during the class.
According to American Heart Association 2004 (MacIntosh, 2007: 351) “A poster presentation consists of a visual display of research highlights on fiberboard
background combined with an interpersonal question and answer period”. There are the key benefits for students because poster are student centered, encourage students to reflect on their learning during their class activity, and enable students to demonstrate
their learning and to learn from other students’ experience. They are also felt to be less
intimidating than standard oral presentations by enabling the flow of discussion around student experience (McNamara, et al, 2010:5).
Oktian Fajar Nugroho, 2013
The Effect Of Poster Presentation Towards Students’ Creativity And Concept Comprehension About Pollution Concept
abilities”. According to Huddle (McNamara, et al 2010:5). “Poster preparation allows students to become active learners and encourages deeper learning”.
The use of poster presentation is being one of the triggers for student’s enthusiasm in learning science, because as stated by the experts they found that poster presentation is effective in visual learning. Learning science using a poster presentation is expected
to enhance student’s creativity and understanding. By way of an effective teaching and educational, it is expected the students to feel comfortable while learning activities.
Papers are designed to appeal to an indicator of scholarly journal, and to meet the formal organizational and informational requirements of publication. Posters are often designed to appeal to peers and colleagues at public display. A poster presentation can
allow for question and answer sessions, and the exchange of ideas and information regarding research.
According to Bloom’s Taxonomy proposed (Anderson, 2001) reveal the mastery is the ability of these terms, like being able to capture a material that is presented in a form that can be understood and be able to provide interpretation and classify. Mastery and understand of the concept of a person’s level of learning outcomes that can define or describe a piece of information with their own words, students are required not merely to remember the material by using their own words. Mastery and understand the concepts is essential in teaching and learning activities because without concept, the learning process will be hampered.
B. Research Problem
According to what have stated aboved, so the research problem how is the effect of
poster presentation towards students’ creativity and concept comprehension about pollution?
C. Research Questions.
1. How does the creativity of students through poster presentation about pollution? 2. How does the improvement of students’ concept comprehension before and after
they make a poster presentation about pollution concept?
3. How is the correlation between students’ creativity and concept comprehension?
D. Aim of the Study
1. To investigate the creativity of students through poster presentation.
2. To investigate the improvement of students’ concept comprehension through poster presentation about pollution concept.
3. To investigate the correlation between students’ creativity and concept comprehension.
E. Limitation of Research
Oktian Fajar Nugroho, 2013
The Effect Of Poster Presentation Towards Students’ Creativity And Concept Comprehension About Pollution Concept
F. Assumption
According to Vujakovic, 1995 and Wihempfheimer, 2004 (McNamara, et al 2010:5)
“Constructing a poster is an effective means of developing both research skills and
creative abilities.”. According to Huddle, 2000 “Poster preparation allows students to
become active learners” and Pearce and Sutton-Brady, 2003 “encourages deeper
learning”. (McNamara, et all 2010:5)
G. Organization Structure of Reseacrh Paper
This research paper is arranged based on its necessity .In order to get organized structure of paper, this research paper is arranged based on the following organization
structure:
1. Chapter 1 : Introduction
This chapter elaborates the background of the research followed by the problem proposed as well as its limitation. In this part also explain the aim of the research and the benefit for other parties in the same field of study.
2. Chapter II : Literature Review
This chapter describes some literatures and basic theories of the research. This research is reviewing poster presentation, creativity, concept comprehensio and pollution concept. Those theories are used to strengthen or support the data gained from the research in analysis part.
3. Chapter III : Methodology
This chapter examines the step of research procedures, the type of research, how the data will be obtained, what is the object of the research, the instruments, and the research plot.
4. Chapter IV : Result and Discussion
In this part, all of the data from the research will be interpreted as result of the research. The discussion of the result will be followed after, it analyzes the result of research and the correlation between the result and the theories.
As its title conclusion and recommendation, in this chapter all of research question will be answered based on the result. The difficulties and obstacles that found in this research will be discussed in recommendation part.
H. Significance of Research
1. For Teachers: Teachers should be able to understand the students who have already learnt the material. Small group with poster presentation should be use for the student in the end of the class. Teacher was expected to be able to develop the activity using poster presentation as their assessment to evaluate the understanding of the materials.
2. For Students: This study is expected the students to explore their knowledge through drawing, and they should be able to illustrate their verbal statement. This
study is expected for students to feel enjoy when they learn science in visual. Through poster, it was hopefully that students should have more opportunity to develop their soft skill and explore their mind.
Oktian Fajar Nugroho, 2013
The Effect Of Poster Presentation Towards Students’ Creativity And Concept Comprehension About Pollution Concept
Universitas Pendidikan Indonesia | repository.upi.edu| perpustakaan.upi.edu CHAPTER III
RESEARCH METHODOLOGY
A. Location and Subject
1. Research Location and Period
This research have already implemented in Bina Nusantara International School Serpong which applied Cambridge Curriculum in the learning process. The data collection was done in May 2013.
2. Population and Sample
Population of this research is all of students’ ability in concept comprehension
and creativity that belongs to grade 10 consists of 10 classes in Bina Nusantara International School Serpong.
The sample of this research is one class of grade 10 consists of 23 students in science class. The sampling technique of this research is random cluster sampling from all of the population, the consideration of the sample is based on the cluster sampling in each class.
B. Type of Experimental Design
The design that used in this research is one group pretest and posttest design, this group is small group with poster presentation. In this research design there was a test
to know students’ prior knowledge or pretest (O1), poster presentation (X), and after the concept given the treatment the final posttest will be conducted (O2) (Arikunto, 2010).
One group pretest and posttest design
Pretest Treatment Posttest
O1 : Pretest
X : poster presentation
O2 : Posttest
C. Research Method
The type of method in this research is weak experiment. This method is chosen because using one class in making a poster presentation without control group. Based on Arikunto (2010) weak experiment method is only use one group research without any control group.
D. Operational Definition 1. Poster Presentation
Poster presentation has already implemented in the class activities. It was advantageous for students to become active learner and to develope their communication skills. In order to implemented of poster presentation, one class of experimental group has already choosen. Class divided into several group, one group consists of 4 students. They have to discuss about pollution before they make a poster. In this activity, students should work together. After students finished their poster, they should present their poster in front of the class. Students have to explore their knowledge and creativity through poster presentation. Rubric was used to evaluate the poster.
2. Creativity
Creativity is the ability to find some new links, in looking at the subject from a new perspective and create new combinations from several ideas, products, colors,
textures, and other things. Students’ creativity were assed through poster presentation that use observation sheet as an instrument. There will be such indicators in
Oktian Fajar Nugroho, 2013
The Effect Of Poster Presentation Towards Students’ Creativity And Concept Comprehension About Pollution Concept
Universitas Pendidikan Indonesia | repository.upi.edu| perpustakaan.upi.edu 3. Concept Comprehension
Students’ concept comprehension in this research is a cognitive domain in pollution concept. Mastery and understand the concepts is essential in teaching and
learning activities. According to Bloom’s Taxonomy cognitive domain are C1
(remember), C2 (understand), C3 (apply), C4 (analyze), C5 (evaluate), C6 (create) that are measured by using an objective test consist of 20 multiple choice question.
E. Research Instrument
The experimental instrument which is used to collect the data in this research based on Harahap (1982) consist of:
1. Objective test in a form of multiple choice question is used to measure students’
achievement before and after treated poster presentation in pollution concept 2. Rubric form is used to guide students for making a poster during class activities.
Rubric is also used to measure students’ creativity. The poster will be analyzed
based on Munandar (1992) indicator such as Fluency, Flexibility, Originality, and Elaboration.
3. Observational sheet is used to measured students’ creativity in making a poster. The indicator was adapt from Munandar (1992) which is consits of Fluency, Flexibility, Originality, and Elaboration.
4. Questionnaire form. This instrument is used to give feedback after making a
poster in the class. To know students’ respond about poster presentation. Students will be answered with yes or no questions.
F. Instrument Development
Instrument which is used to collect the data in this research consist of:
1. Achievement Test in a form of pretest and posttest. This test is used to
measure students’ comprehension skill before and after conducting poster
a. Construction of Pretest and Posttest blueprint
Construction of pretest and posttest blueprint is aimed to determine the aspect of poster presentation aspect that will be measure which is appropriate with learning indicator. Blueprint of pretest and posttest is provided on the table below:
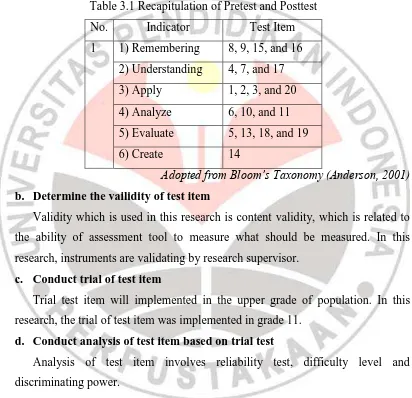
Table 3.1 Recapitulation of Pretest and Posttest
No. Indicator Test Item
1 1) Remembering 8, 9, 15, and 16
2) Understanding 4, 7, and 17 3) Apply 1, 2, 3, and 20
4) Analyze 6, 10, and 11
5) Evaluate 5, 13, 18, and 19
6) Create 14
Adopted from Bloom’s Taxonomy (Anderson, 2001) b. Determine the vailidity of test item
Validity which is used in this research is content validity, which is related to the ability of assessment tool to measure what should be measured. In this research, instruments are validating by research supervisor.
c. Conduct trial of test item
Trial test item will implemented in the upper grade of population. In this research, the trial of test item was implemented in grade 11.
d. Conduct analysis of test item based on trial test
Analysis of test item involves reliability test, difficulty level and discriminating power.
Oktian Fajar Nugroho, 2013
The Effect Of Poster Presentation Towards Students’ Creativity And Concept Comprehension About Pollution Concept
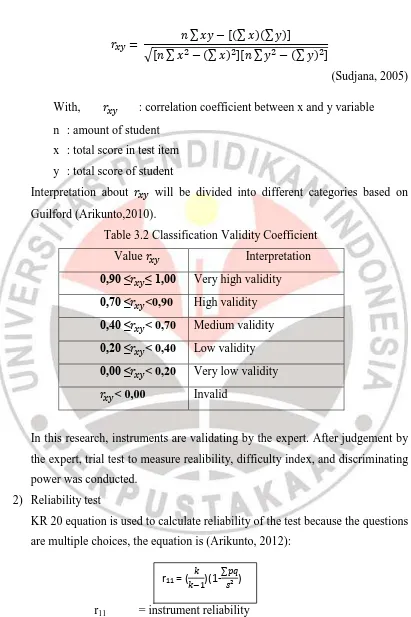
Universitas Pendidikan Indonesia | repository.upi.edu| perpustakaan.upi.edu ∑ [ ∑ ∑ ]
√[ ∑ ∑ ][ ∑ ∑ ]
(Sudjana, 2005)
With, : correlation coefficient between x and y variable
n : amount of student x : total score in test item
y : total score of student
Interpretation about will be divided into different categories based on
Guilford (Arikunto,2010).
Table 3.2 Classification Validity Coefficient
Value Interpretation
0,90 ≤ ≤ 1,00 Very high validity 0,70 ≤ <0,90 High validity 0,40 ≤ < 0,70 Medium validity 0,20 ≤ < 0,40 Low validity 0,00 ≤ < 0,20 Very low validity
< 0,00 Invalid
In this research, instruments are validating by the expert. After judgement by the expert, trial test to measure realibility, difficulty index, and discriminating power was conducted.
2) Reliability test
KR 20 equation is used to calculate reliability of the test because the questions are multiple choices, the equation is (Arikunto, 2012):
r11 = instrument reliability k = amount of test item
r11 = (
∑pq = multiplication result of p and q s = deviation standard
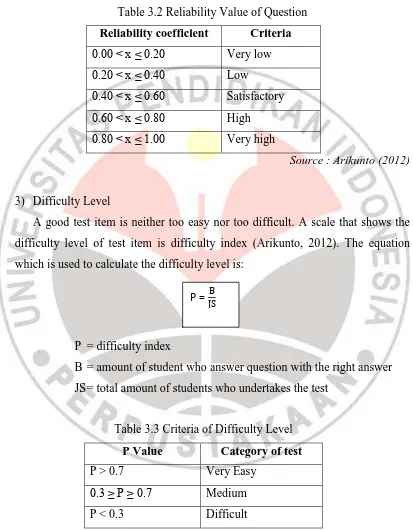
Table 3.2 Reliability Value of Question
Reliability coefficient Criteria
0.00 < x ≤ 0.20 Very low
0.20 < x ≤ 0.40 Low
0.40 < x ≤ 0.60 Satisfactory
0.60 < x ≤ 0.80 High
0.80 < x ≤ 1.00 Very high
Source : Arikunto (2012)
3) Difficulty Level
A good test item is neither too easy nor too difficult. A scale that shows the difficulty level of test item is difficulty index (Arikunto, 2012). The equation which is used to calculate the difficulty level is:
P = difficulty index
B = amount of student who answer question with the right answer JS = total amount of students who undertakes the test
Table 3.3 Criteria of Difficulty Level
P Value Category of test
P > 0.7 Very Easy
0.3 ≥ P ≥ 0.7 Medium P < 0.3 Difficult
Source : Arikunto (2012)
P =
Oktian Fajar Nugroho, 2013
The Effect Of Poster Presentation Towards Students’ Creativity And Concept Comprehension About Pollution Concept
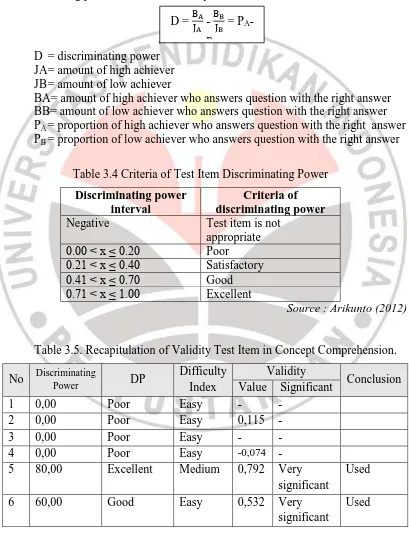
Universitas Pendidikan Indonesia | repository.upi.edu| perpustakaan.upi.edu 4) Discriminating power
Discriminating power of test item is the ability of test item to differentiate between high achiever and low achiever (Arikunto, 2012). To determine discriminating power of test item, the equation below is used:
D = discriminating power JA = amount of high achiever JB = amount of low achiever
BA= amount of high achiever who answers question with the right answer BB= amount of low achiever who answers question with the right answer PA = proportion of high achiever who answers question with the right answer PB = proportion of low achiever who answers question with the right answer
Table 3.4 Criteria of Test Item Discriminating Power
Discriminating power interval
Criteria of discriminating power
Negative Test item is not
appropriate
0.00 < x ≤ 0.20 Poor
0.21 < x ≤ 0.40 Satisfactory
0.41 < x ≤ 0.70 Good
0.71 < x ≤ 1.00 Excellent
Source : Arikunto (2012)
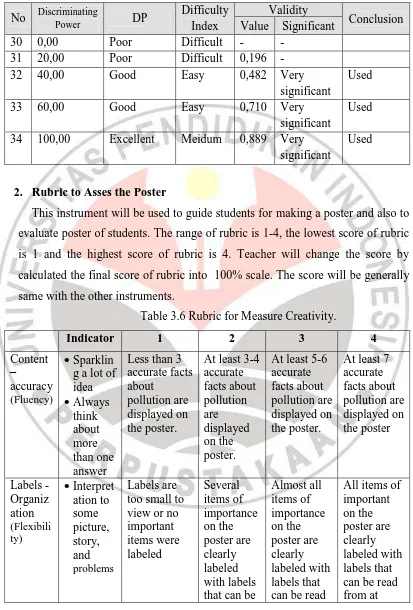
Table 3.5. Recapitulation of Validity Test Item in Concept Comprehension.
Oktian Fajar Nugroho, 2013
The Effect Of Poster Presentation Towards Students’ Creativity And Concept Comprehension About Pollution Concept
Universitas Pendidikan Indonesia | repository.upi.edu| perpustakaan.upi.edu No Discriminating
2. Rubric to Asses the Poster
This instrument will be used to guide students for making a poster and also to evaluate poster of students. The range of rubric is 1-4, the lowest score of rubric
is 1 and the highest score of rubric is 4. Teacher will change the score by calculated the final score of rubric into 100% scale. The score will be generally same with the other instruments.
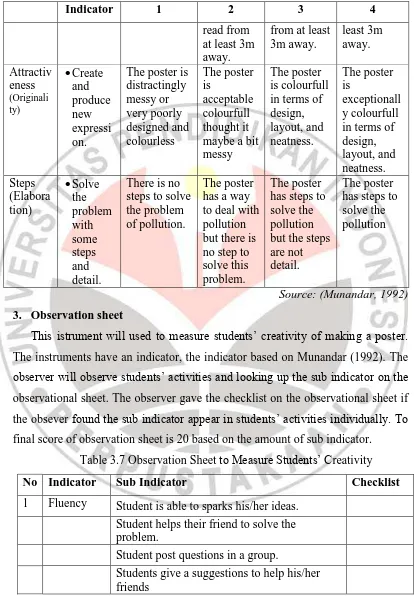
Table 3.6 Rubric for Measure Creativity.
Indicator 1 2 3 4
This istrument will used to measure students’ creativity of making a poster.
The instruments have an indicator, the indicator based on Munandar (1992). The
observer will observe students’ activities and looking up the sub indicator on the
observational sheet. The observer gave the checklist on the observational sheet if the obsever found the sub indicator appear in students’ activities individually. To final score of observation sheet is 20 based on the amount of sub indicator.
Table 3.7 Observation Sheet to Measure Students’ Creativity
No Indicator Sub Indicator Checklist
1 Fluency Student is able to sparks his/her ideas. Student helps their friend to solve the problem.
Student post questions in a group.
Oktian Fajar Nugroho, 2013
The Effect Of Poster Presentation Towards Students’ Creativity And Concept Comprehension About Pollution Concept
Universitas Pendidikan Indonesia | repository.upi.edu| perpustakaan.upi.edu
No Indicator Sub Indicator Checklist
Student always think about more than one answer
2 Flexibility Student produce new ideas based on their mind
Can see the problem from the perspective of different area
Giving a various skill towards unusual things Giving a various interpretation to some picture, story, and problems
Implement the concept or idea differently Give consideration to some situation, that have different situation given by someone else 3 Originality Create and produce a new expression and
unique
Think differently to express their selves
Can make a combinations that is different with other things
Chose asymmetry design to create a picture or design
Refer to synthesize than analyzes
4 Elaboration Finding the meaning of some question deeply
Solve the problem with some steps and detail
Trying and testing a detail to see the final goal Have a beautiful sense so there will be dissatisfaction with blank or simple appearance, and adding some line, colors, and details with their own picture or the other picture.
Total
Source: (Munandar, 1992)
4. Questionnaire
disagree. Questionnaire is given to students, and the students are asked to give
checklist (√) sign according to the statement.
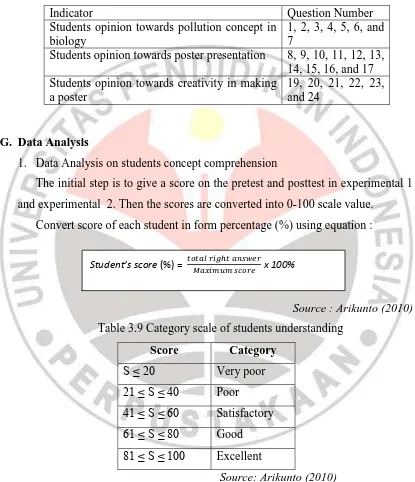
Table 3.8 Recapitulation of the Questionnaire.
Indicator Question Number
Students opinion towards pollution concept in biology
1, 2, 3, 4, 5, 6, and 7
Students opinion towards poster presentation 8, 9, 10, 11, 12, 13, 14, 15, 16, and 17 Students opinion towards creativity in making
a poster
19, 20, 21, 22, 23, and 24
G. Data Analysis
1. Data Analysis on students concept comprehension
The initial step is to give a score on the pretest and posttest in experimental 1 and experimental 2. Then the scores are converted into 0-100 scale value.
Convert score of each student in form percentage (%) using equation :
Source : Arikunto (2010)
Table 3.9 Category scale of students understanding
Score Category
S ≤ 20 Very poor
21 ≤ S ≤ 40 Poor
41 ≤ S ≤ 60 Satisfactory
61 ≤ S ≤ 80 Good
81 ≤ S ≤ 100 Excellent
Source: Arikunto (2010)
Gain score (actual gain) was obtained from the difference of pretest score and post-test score. The difference in pretest scores and the post-test is assumed as the effect of the intervention. Normalized gain calculations are intended to determine
Student’s score (%) =
Oktian Fajar Nugroho, 2013
The Effect Of Poster Presentation Towards Students’ Creativity And Concept Comprehension About Pollution Concept
Universitas Pendidikan Indonesia | repository.upi.edu| perpustakaan.upi.edu
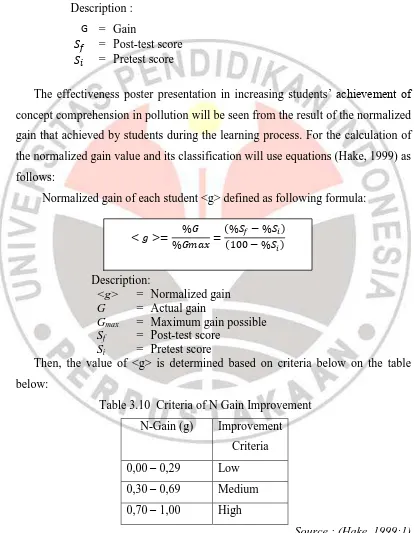
the categories of students’ achievement improvement. According to Hake (1998) normalized gain is calculated by using this following formula:
Description :
G = Gain
= Post-test score = Pretest score
The effectiveness poster presentation in increasing students’ achievement of concept comprehension in pollution will be seen from the result of the normalized gain that achieved by students during the learning process. For the calculation of the normalized gain value and its classification will use equations (Hake, 1999) as follows:
Normalized gain of each student <g> defined as following formula:
Description:
<g> = Normalized gain
G = Actual gain
Gmax = Maximum gain possible
Sf = Post-test score
Si = Pretest score
Then, the value of <g> is determined based on criteria below on the table
below:
Table 3.10 Criteria of N Gain Improvement N-Gain (g) Improvement
Criteria
0,00 – 0,29 Low
0,30 – 0,69 Medium
0,70 – 1,00 High
Source : (Hake, 1999:1)
b. Calculate students’ average score using equation below :
2. Data processing in students creativity
Making a poster is an activity that can ehncance students’ creativity. To measure students’ creativity in this research is used an observational sheet. The
fulfillment of the observational sheet is give the check list mark on the available
coloum that representative of appereance of students’ creativy based on the
indicator from Munandar. The observer will observe students appereance of creativity and guided by observational sheet. Data obtained from observational
sheet using percentage, the following formula:
Source: (Arikunto, 2010)
Explanation :
P = Response percentage R = Actual response observed
Rmax = Maximum possible response
3. Data processing in questionnaire
Making a poster is an activity that can enhance students creativity. This treatment measured by questionnaire, there will be 24 questions with 2 optional answers. The fulfillment of the questionnaire is give check list mark on the available coloum that representative of yes and no.
Data obtained from the questionnaire using percentages, the following formula:
Source:(Arikunto, 2010)
Explanation :
P = Response percentage R = Actual response observed
Rmax = Maximum possible response
Oktian Fajar Nugroho, 2013
The Effect Of Poster Presentation Towards Students’ Creativity And Concept Comprehension About Pollution Concept
Universitas Pendidikan Indonesia | repository.upi.edu| perpustakaan.upi.edu
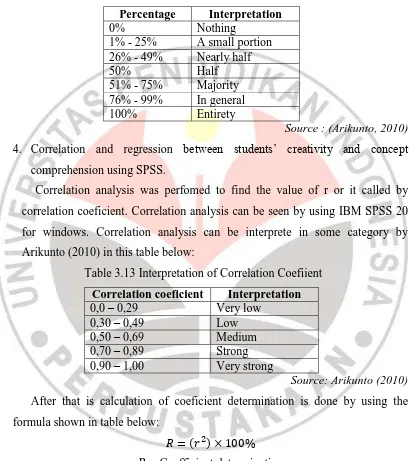
Percentage of students responses were interpreted using a qualitative interpretation of the questionnaire by (Arikunto, 2010) in this table below:
Table 3.12 Interpretation of Questionnaire
Percentage Interpretation
0% Nothing
1% - 25% A small portion 26% - 49% Nearly half
50% Half
51% - 75% Majority 76% - 99% In general
100% Entirety
Source : (Arikunto, 2010)
4. Correlation and regression between students’ creativity and concept
comprehension using SPSS.
Correlation analysis was perfomed to find the value of r or it called by correlation coeficient. Correlation analysis can be seen by using IBM SPSS 20 for windows. Correlation analysis can be interprete in some category by Arikunto (2010) in this table below:
Table 3.13 Interpretation of Correlation Coefiient
Correlation coeficient Interpretation 0,0 – 0,29 Very low
0,30 – 0,49 Low
0,50 – 0,69 Medium
0,70 – 0,89 Strong 0,90 – 1,00 Very strong
Source: Arikunto (2010)
After that is calculation of coeficient determination is done by using the
formula shown in table below:
H. Research Procedure
There are three stages of procedure that is conducted in this research, including preparation stage, implementation stage, and analysis and conclusion stage.
1. Preparation stage
In this stage, the activity is focusing on arranging and designing the instruments and lesson plan by considering the curriculum, instruction how to construct poster presentation, and skill achievement.
a. Determining teaching material that will be used in this research. b. Designing teaching learning.
c. Making research instrument. d. Instrument Validation.
e. Revising instrument. f. Preparing research license. g. Determining research subject. 2. Implementation stage
This stage is the chance for students to implement poster presentation as an Assessment, take some data, and evaluate the data gained using valid instrument.
a. Conducting pretest.
b. Conducting lecturer method.
c. Conducting poster presentation method. d. Conducting posttest.
e. Giving questionnaire.
3. Analysis and Conclusion stage
Oktian Fajar Nugroho, 2013
The Effect Of Poster Presentation Towards Students’ Creativity And Concept Comprehension About Pollution Concept
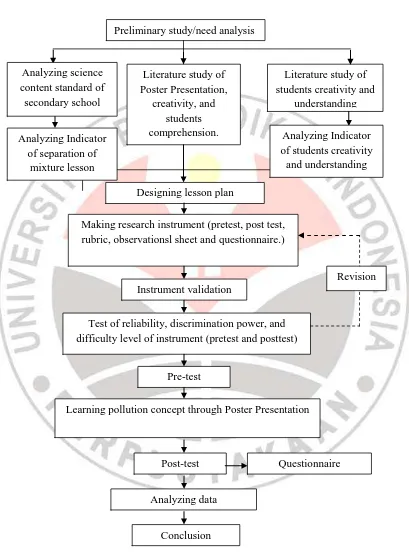
Universitas Pendidikan Indonesia | repository.upi.edu| perpustakaan.upi.edu I. Scheme of Research
Figure 3.1 Scheme of the Research Preliminary study/need analysis
Literature study of Poster Presentation,
creativity, and students comprehension.
Literature study of students creativity and
understanding
Analyzing Indicator of students creativity and understanding
concept Designing lesson plan
Making research instrument (pretest, post test, rubric, observationsl sheet and questionnaire.)
Instrument validation
Test of reliability, discrimination power, and difficulty level of instrument (pretest and posttest)
Pre-test
Learning pollution concept through Poster Presentation
Post-test Questionnaire
Analyzing data
Conclusion
Revision Analyzing Indicator
J. Design of Poster Presentation
Figure 3.2 Design of Poster Presentation and Assessment Learning activities about pollution
Poster Presentation working mode
Group A Design Poster about air pollution by
Sulphur dioxide
Design Poster about water pollution by chemical sewage and chemical waste
Design Poster about air pollution by green
house gasses contributing to global warming
Design Poster about pollution due to
pesticides including insecticides and herbicides
Design Poster about pollution due to nuclear fall out
Preparation for presentation
Questionnaire Posttest
At the end of each session, teacher makes sure that all student have understanding about pollution concept that is compatible with daily
life experience.
Group A, B, C, D, and E present
and discuss their ropic Group B
Group C
Group D
Group E
Oktian Fajar Nugroho, 2013
The Effect Of Poster Presentation Towards Students’ Creativity And Concept Comprehension About Pollution Concept
CHAPTER V
CONCLUSIONS AND RECOMMENDATIONS
A. Conclusion
The research about the effect of poster presentation towards students’
creativity and concept comprehension has been conducted systematically. Based on the result of the research it can be concluded that the implementation of poster
presentation towards students’ creativity and concept comprehension can be seen
below:
The profile of students’ creativity based on the observational sheet results which is 56% of students can explore their creativity through poster presentation. The creativity of students shows a positive impact to the result of poster presentation in term of visualization and audiolization.
The implementation of poster presentation can improve students’ concept
comprehension, it can be noticed by processing the differences between pretest and posttest score. The differences score of pretest and posttest can be seen by calculate normalized gain which is 0,30 which include as medium category. There is a significant effect of poster presentation towards students’ concept comprehension.
Based on the coefficient determination can be shown that 9% of concept comprehension can be explained by creativity, meaning that the rest or 91% of concept comprehension can be explained by the other things. The respond of students towards the implementation of poster presentation shows the positive
B. Recomendation
There are some recomendation based on the finding of the research that has been conducted and the consideration that implementation is still need to be improve. The recomendation and suggestion that necesary to be conveyed by the researchers are:
1. Poster presentation can be implemented as an alternative teaching strategy in other science concept in school.
2. Before designing the instrument to measure the creativity, the analysis of the indicator based on the expert has to be more spesific so it can be appropiate to concept.
3. Analizing students’ ability before making a group is should be done.
Oktian Fajar Nugroho, 2013
The Effect Of Poster Presentation Towards Students’ Creativity And Concept Comprehension About Pollution Concept
References
Arifin, Z. (2009). Evaluasi Pembelajaran. Bandung: PT Remaja Rosdakarya.
Arikunto, Suharsimi. (2012). Dasar-dasar Evaluasi Pendidikan. Jakarta: Bumi Aksara.
Arikunto, Suharsimi. (2010). Prosedur Penelitian. Jakarta: PT Rineka Cipta.
Anderson, O. W., Krathwohl, D.R. (2001). A Taxonomy for Learning,
Teaching, and Assessing A Revision of Bloom’s Taxonomy of Educational
Objectives. New York: Longman
Bartoszeck, A. B. (2012). Graphic Representation of Organ and Organ System: Psychological View and Developmental View. Brazil: Eurasia Journal of
Mathematics, Science and Technology Education.
Berry, J. , Houston, K. (1995) Students Using Poster as a means of
communication and Assessment. New York: Published by: Springer
Stable
Boediono and Koster. (2001). Teori dan Aplikasi, Statistika dan Probabilitas. Bandung:PT Remaja Rosdakarya
Bracher, L., Cantrell, J., and Wilkie, K. (1998). The Process of Making Poster Presentation: a Valuable Experience. Medical Teacher 20, 552-557
Dahar, R. W. (1996). Teori-Teori Belajar. Cetakan kedua. Bandung: Erlangga
Gow, Britt. (2011). Sulphur Dioxide and Air Pollution. [Online] available at : www.slide shared.net/britthow/pollution4-air-pollution-and-SO2.[March 5th, 2013]
Hake, R. (1991). Analyzing Change/Gain Scores. [On Line]. Available: http:lists.asu.edu [2 February 2013]
Harahap, Nasrun. (1982). Tekhnik Penilaian Hasil Belajar. Jakarta: Bulan
Bintang
Haryati, M. (2007), Model & Teknik Penilaian Pada Tingkat Satuan
Kim, Kyung Hee. (2011). The Creativity Crisis: The Decrease in Creative
Thinking Scores on the Torrance Test of Creative Thinking, London:
Taylor and Francis Group
Lee, Kyung-Hwa. (2005). The Relationship Between Creative Thinking Ability and Creative Personality of Preschoolers. International Educationa
Journal, 6(2), 194-199
Munandar, Utami; S.C. (1992). Mengembangkan Bahan dan Kreatifitas Anak
Sekolah (petunjuk bagi para guru dan orang tua), Jakarta: PT Gramedia.
Munandar, Utami: S.C. (2002). Strategi Mewujudkan Potensi Kreatif dan
Bakat, Jakarta: PT Gramedia
MacIntosh, Anu and Murray. (2007). Poster Presentations as A Genre in
Knowledge Communication: A Case Study of Forms, Norms, and Values.
University of Torronto
McNamara, J., Larkin, I. And Beatson, A. (2009) Using poster presentation as
assessment of work integrated learning, 29 September – 1 October 2010, Curtin University of Technology, Perth.
Olmanson, A. K, (2011). The Effects of Students Drawing in Their Science
Notebooks on Their Understanding of Science in Seventh Grade Science.
Bozeman, Montana..
O’Boyle, K. (2011) Case Study 3: Assessing scientific presentions. A
Practitioner’s Methods within a Module, Case Studies from UCD.
Dublin: UCD Teaching and Learning.
O’Neill, K. (2012). An Introduction to Effective Poster Design and Production, UCD Teaching and Learning: Dublin.
Pillsbury, R. T. (2006). Making learning a never ending story. Science Scope,
30(4), 22- 26. Retrieved from World Wide Web 2010 http://www.nsta.org/main/news/stories/journal_archive_date_list.php?cat egory_ID=87&issue_ID=1000 and http://www.bcb.uwc.ac.za/sci_ed/ grade10/ecology/conservation/poll.htm
Purwanto, M. Ngalim. (2009). Prinsip-Prinsip dan Teknik Evalusasi
Oktian Fajar Nugroho, 2013
The Effect Of Poster Presentation Towards Students’ Creativity And Concept Comprehension About Pollution Concept
Saepuzaman, D. (2008). Penerapan Model Pembelajaran Berbasis Masalah
Dalam Pembelajaran Materi Rangkaian Listrik Arus Searah Untuk Meningkatkan Penguasan Konsep dan Keterampilan Berfikir Kritis Siswa SMA. Thesis FPMIPA UPI. Bandung: not published
Slameto. (2003). Belajar dan Faktor-Faktor yang memperngaruhi. Jakarta: PT Asdi Mahasatya
Sugiyono, (2008). Metode Penelitian Kuantitatif, Kualitatif dan R&D. Bandung: Alfabeta.
Sumarwan. Sumartini. Kusmayadi. (2012). Biology for Junior High School
Grade VII. Bandung. Erlangga
Volkwyn, Roy. (2006). Pollution [Online]. Available at: www.bcb.uwc.ac.za/sa_ed/grade10/ecology/conservation/poll.htm#intro [March 5th, 2013
Wheland, Ethel. (2005). The Poster Session: A Tool for Education, Assessment,