TABLE OF CONTENTS
PREFACE ……… i
ACKNOWLEDGEMENT ……… ii
STATEMENT ……….. iii
ABSTRACT ………. iv
TABLE OF CONTENT ……….… v
LIST OF TABLES ……… x
LIST OF APPENDICES ……….……….... xii
CHAPTER I: INTRODUCTION ……….………..…….….. 1
1.1.Background of the Study ………...……….…….. 1
1.2.The Purposes of the Study ……….…...…....…... 8
1.3.Research Questions …………...……….………….…….. 8
1.4.Scope of the Problem ………..………...……. 9
1.5.The Significance of the Study ……….……….………9
1.6.Research Method ……….….…….. 9
1.7.Clarification of Terms ..…….……….…………... 10
1.8.Research Paper Organization ………... 10
CHAPTER II: LITERATURE REVIEW ……… 13
2.2. Total Physical Response (TPR) ....………..……. 15
2.2.1. Introduction to the Origin of TPR ………..… 15
2.2.2. Background Theories of TPR Method .……….…….. 17
2.2.3. Implementation of TPR Method ………..……….. 22
2.2.4. Roles in the Activities ………... 24
2.2.4.1. The Roles of Students and Teacher ………..…. 24
2.2.4.2. The Roles of Classroom Language and Learning Material … 26 2.2.5. Advantages of TPR Method ………..…..……… 27
2.3. Vocabulary Acquisition ……….………….……….. 29
2.4. Teaching English Vocabulary ……….…….. 30
2.4.1. Definition of Vocabulary ……….. 30
2.4.2. Different Kinds of Vocabulary Items or Words ……….…… 31
2.4.3. How to Teach English Vocabulary ……… 34
2.5. Teaching English to Children ………..………….. 38
2.5.1. Children or Young Learners ………..………. 38
2.5.2. The Characteristics of Young Learners ..………..…………..…….. 39
2.6. Teaching English Vocabulary to the First Graders of Elementary School
Using TPR Method ………...……. 42
2.7. Related Research Findings ……….………... 44
CHAPTER III: RESEARCH METHOD …………....….……….……... 46
3.1. Brief Explanation to Research Method ………. 46
3.1.1. Research Design ………….……….………. 48
3.1.2. Variable ……….……….……...………... 51
3.13. Hypothesis ……….……….... 52
3.2. Population and Sample ……….……. 53
3.3. Data Collection ……….………..………... 53
3.3.1. Pretest ………..….…… 54
3.3.2. Observation ……….………. 54
3.3.3. Posttest ……….……….... 55
3.4. Evaluating Test Instrument ………..…. 55
3.4.1. Instrument Validity ……….………. 56
3.4.1.1. The Measurement Result of Test Instrument Validity ……… 57
3.4.2.1. The Measurement Result of Test Instrument Reliability …… 60
3.5. Data Analysis ………..……….………. 62
3.5.1. Analyzing Data on Test Score ………..…… 62
3.5.2. Analyzing Data on Pretest …….………..…………. 62
3.5.3. Analyzing Data on Posttest ……….……….……… 64
3.5.4. Determination of the Effect Size ………..…….……... 66
3.5.5. Analyzing Data from Observation ……….……….. 67
3.6. Treatment Implementation ……….…...……… 67
3.7. Research Procedure ………..………. 68
CHAPTER IV: FINDINGS AND DISCUSSION ……..………... 70
4.1. TPR Method Was Effective in English Vocabulary Mastery of Elementary School Children ……….………… 70
4.1.1. Findings from Pretest of Experiment and Control Group……..….… 71 4.1.2. Findings from Posttest of Experiment and Control Group .……..….. 73
4.2. Students Responded Positively to Teaching English Vocabulary Using TPR method ………..… 82
4.3. Discussion on Findings ..………...………… 87
CHAPTER V: CONCLUSION AND SUGGESTIONS ………..……..…... 90
5.1. Conclusion ………..………...….… 90
5.2. Suggestions ………..……...….... 91
LIST OF TABLES
Table 3.1. Major classes of Experimental Research Design ……… 49
Table 3.2. Description of Research Design ……….. 51
Table 3.3. Interpretation of r Coefficient ………..……….. 56
Table 3.4. The Result of Test Item Validity .……….…..…. 57
Table 3.5. r Coefficient Correlation ………. 58
Table 3.6. Criteria of Discrimination Index ………. 59
Table 3.7. Criteria of Difficulty Index ………. 59
Table 3.8. The Result of Discrimination and Difficulty Index .………..…. 60
Table 3.9. Coefficient Correlation of the Effect Size Scale .………..…. 66
Table 4.1. Group Statistics of Pretest ……...……….…..…. 71
Table 4.2. Independent Samples Test of Pretest ………...………. 71
Table 4.3. Group Statistics of Posttest …….……….…..…. 73
Table 4.4. Independent Samples Test of Posttest ……..………..………… 73
Table 4.5. Paired Samples Statistics of Experiment Class …………....…….…. 75
Table 4.6. Paired Samples Correlation of Experiment Class ……….…...…..…. 76
Table 4.8. Paired Samples Statistics of Control Class ……….…..….…. 78
Table 4.9. Paired Samples Correlation of Control Class ……….……...…..…. 78
LIST OF APPENDICES
Appendix 1. The Result of Data Analysis of Pilot Test Using Anatest for
Multiple Choices ………..……….…… 101
Appendix 2. The Score Result of Control Class Pretest ………….………... 105
Appendix 3. The Score Result of Experiment Class Pretest ……....……..…... 106
Appendix 4. The Score Result of Control Class Posttest ………….…..……... 107
Appendix 5. The Score Result of Experiment Class Posttest ..…..……….…...108
Appendix 6. Pilot Test Questions ……….. 109
Appendix 7. Pretest and Posttest Questions ……….……...….. 112
Appendix 8. Syllabus ………..………..… 118
Appendix 9. Lesson Plan ………...………...…………. 124
Appendix 10. The Primary Data Gained from Observation Using Field Notes ………. 141
CHAPTER I INTRODUCTION
This chapter presents the background of the study that shows the
enhancement of English education at elementary schools, and how this education
requires good teachers to teach with appropriate method. This chapter consists of
some subchapters, namely the purposes of the study, research questions, scope of
the problem, the significance of the study, research method, clarification of terms
and research paper organization.
1.1.Background of the Study
The enhancement of education that gives priority to the elementary
students’ ability to master English as a result of this subject categorized as local
content in the curriculum is responded positively by public (Yauri, 2007). Many
parents ask their children to be taught English in their elementary schools like in
others (Suyanto, 2004), as in the society as Istiqomah (2011) implies, English
plays an important role not only as academic language but also as daily one, such
as in computer, internet, banking, medic, tourism, flight, entertainment and radio.
Moreover, Nunan (2003: 591) states, “In business, industry, and government, workers are increasingly expected to develop proficiency in English.” Therefore,
the parents want their children to learn English as early as possible so that they
will take advantage from English as an important part of their academic and
This condition also encourages a number of elementary schools to
implement English education based on the government policy (Sukamerta, 2011),
SK Menteri Pendidikan dan Kebudayaan (the Decree of Minister of Education
and Culture) No. 060/U/1993 in February 25, 1993. This policy states that it is
possible to teach English as local content subject in Elementary school starting
from the fourth grade (Suyanto, 2004).
I n I n d o n e s i a , E n g l i s h is now introduced to children at the early age
(Matondang, 2005). Even, public interest in English for Young Learners (EYL)
has become enhanced (Musthafa, 2010) as t here is a widely-held belief that
younger second language learners do better than older learners supported by a
theory of acquiring language called Critical Period Hypothesis (Ellis, 1996). This
theory says that language could be acquired starting from roughly early infancy to
puberty (Johnson & Newport, 1989). It means that according to Snow and
Hoefnagel-Hohle (1978: 1114), “One prediction of this hypothesis is that second
language acquisition will be relatively fast, successful, and qualitatively similar to
first language only if it occurs before the age of puberty.” It is clarified by
Marinova-Todd, Marshall, & Snow (2000: 9), that “children are generally considered capable of acquiring a new language rapidly and with little effort,
whereas adults are believed to be doomed to failure.” Birdsong (1999) also
highlights that one real advantage of having children start learning English at an
early age is that they are better equipped to develop English language acquisition.
As a matter of fact, it can be inferred that it would be advantageous for language
old - so that they can enjoy the developmental benefits of that period (Shin, 2006).
B e s i d e s , Baker (2008), as cited in Fatmawati (2011), argues that in the present
days, English is regarded as an important and prestigious language that many
people in a particular domain may be exposed to it.
The process of teaching and learning English in elementary school,
however, does not always run well (Yauri, 2007; Suyanto, 2004) as in this level it
is relatively new in Indonesia, unlike in Malaysia, Philippines, etc.
(Edisonyusman, 2011). Besides, teacher competency is as one of the obstacles
(Yauri, 2007; Suyanto, 2004). The teachers mostly are not English teachers, but
class teachers, and not all of them learn English as a major subject (Yauri, 2007;
Suyanto, 2004; Edisonyusman, 2011). Consequently, they are not skillful in
teaching English (Samudra, Kuswardono, & Idayanie, 1999). They are not
supplied the concept of young learner psychology and theory of teaching and
learning foreign language for young learner (Suyanto, 2004). They are
professionally regarded not ready to teach English (Alwasilah, 2000: 80-81, as
cited in Yaury, 2007). Edisonyusman (2011: 1) claims that “limited knowledge
about the content of the teaching, in this case English, will mislead the students.” In other words, teachers should master English and language learning to be able to
evaluate the accuracy of method, material and approach to help their students be
successful (Suyanto, 2004) as well as create a classroom communicative context
within which the students are motivated to share their ideas, feelings, perceptions
Substantially, according to Curtain and Pesola (1994), as cited in Suyanto
(2004), children will learn foreign language well if the learning process is in the
communicative context and conducive to them. In their opinion for children this
context covers social and cultural situation, game, song, story, art experiences,
handicraft and sport.
Teaching English to young learners or students of Elementary school,
according to Shin (2006), is different from teaching adults as they especially have
fun with movement and physical participation. He adds that the more fun the
students have, the better they will remember the language learned. As Scott and
Ytreberg (1990: 2) emphasize, “Children’s understanding comes through hands and eyes and ears, and the physical world is dominant at all times.”
So far, however, English teachers have been experiencing difficulty in
teaching children since the method used is less appropriate (Widodo, 2005;
Samudra, Kuswardono, & Idayanie, 1999). Related to this issue, the researcher
has met an English teacher in one Islamic elementary school in Cibiru Bandung.
The teacher admits that it is difficult to teach English especially for the first
graders because of many reasons. One of the reasons is the students still learn
reading and writing Bahasa Indonesia (Indonesian). Meanwhile, the way to read
and write English is different from the way to read and write Bahasa Indonesia
(Indonesian). Besides, the students love making disturbance and it is not easy to
keep them quiet and concentrating for long. Hence, the researcher endeavored to
find out the effective method to teach them English and she tried Total Physical
using TPR method was effective in teaching English, especially English
vocabulary to children. She assumed it would improve their English vocabulary
mastery and this method was enjoyable and engaging as there are many positive
research findings related to using this method in teaching English to children.
Some of them are: TPR method was found to be effective to improve English
preposition mastery of the fifth grader in one elementary school in Semarang
(Nugrahaningsih, 2007); TPR method enhanced students’ motivation and interests
of elementary school in Taiwan in learning English (Hsu and Lin, 2012); TPR
seemed to have been helpful to find a more economical way of helping students in
one Japanese junior high school to learn English script, and to find more time
when they were engaged in language activities touching on their personal
experiences (Sano, 1986); TPR was a successful classroom management tool that
teachers could easily implement at any stage of their lessons, or once they faced a
management problem and it could be used in other grade levels as children in an
elementary school in Sharjah in the United Arab Emirates, in general were active
and they had fun in the English classroom (Sakhaweti, 2004). In addition, many
researches show TPR method is also suitable for teaching other languages and
many teachers use it alongside other tools. Cook (2001) suggests that teachers use
TPR method as she reveals that teaching English through action (also in Spanish,
French, German, Japanese, or Russian) has been highly successful with Beginning
and Early Intermediate students/learners. She adds that 102 TPR lesson plans are
widely used by both elementary and secondary teachers across the United States,
even if the beginner is enrolled in a traditional course. Moreover, Adam (2011)
conducts his study about TPR in Latin class that seems to propose that TPR is one
possible way of creating enthusiasm for languages. Furthermore, Glisan (1996,
n.p.) reports his study dealing with TPR in Spanish class that “use of Asher's Total
Physical Response strategy, through which students internalize meaning initially
by physically responding to oral commands, results in better listening
comprehension, speaking, and reading performance.” Besides, Mastromarco (n.
d.: 5) reveals that “today, although TPR is still under-adopted in Europe, there is much literature on the topic and many university students choose to write their
final paper on it.” He states that most importantly, more and more teachers decided to use TPR alongside other tools.
On one hand, using TPR method in teaching English to children is a lot of
fun and enjoyable, does not demand many preparation or materials, is very
effective for teenagers and young learners, is appropriate for kinesthetic learners
to be active in the class, is memorable for students to remember phrases and
words well, and works properly with mixed-ability classes (Sophaktra, 2009).
Moreover, according to Maroto, Garrido & Fuentes (n.d.), it makes students
obtain good pronunciation and memorize learnt things for long. On the other
hand, Sophaktra (2009) mentions that there are cons of using this method such as:
it makes students less creative to express their own thoughts, overuses the
imperative form, can be ineffective to be used for long period of time, will be
trouble to teach abstract vocabulary or expression, and causes boredom when
happen in a desirable way and students are not aware they are in learning process
(Maroto, Garrido & Fuentes, n.d.).
Meanwhile, vocabulary taught with the use of other methods, such as the
grammar-translation method and FAIES (first aid in learning English) method
studied by Renatha (2009), showed that: In FAIES (first aid in learning English)
method, when the students asked about a vocabulary, the teacher was not able to
give the meaning directly. They could not ask whole difficult words but only few
words; In Grammar translation method, on the other hand, the teacher was able to
give the meaning of the vocabulary directly and the students could also ask entire
word which they did not understand. However, Yulianto (2009: 3) argues that in
Elementary School 1 Ngadirojo, the researcher discovered that the teacher still
employs GTM as teaching method and this causes the students feel bored because
the teaching procedure is very monotonous. In addition, some other different
methods (direct approach, and suggestopedia method) used for teaching
vocabulary as Pribilova (2006) states, in direct approach, there are no translations.
He states the mother tongue is never used, only target language is used in the
classrooms and only complete sentences are used and culture is regarded as an
important aspect. Meanwhile, he mentions that suggestopedia method is a very
significant method in assisting learners to memorize words and stimulates the
learner´s brain by music while learning but nowadays this method seems to be
left.
In this case, this does not mean that other approaches, methods, or tools
method is the most suitable one to be applied to teach vocabulary to young
learners as this method offers them enjoyable and active roles in the learning
experience as one of the principles and best practices for teaching English to
elementary learners (McCloskey, 2003). Therefore, the researcher was curious to
prove it by doing this research.
Those all above are also the reasons that this study concerned with teaching
English vocabulary to the first graders of elementary school using TPR method to
know the effectiveness of TPR method in improving English vocabulary mastery
of elementary school children.
1.2.The Purposes of the Study The study is intended:
1. to investigate whether the use of TPR method is effective in improving
English vocabulary mastery of elementary school children.
2. to investigate how the students respond to teaching English vocabulary
using TPR method.
1.3.Research Questions
In compliance with the aforementioned purposes, this research will strive
to address the following questions below:
1. Is TPR method effective in improving English vocabulary mastery of
elementary school children?
2. How do the students respond to teaching English vocabulary using TPR
1.4.Scope of the Problem
This research only focused on investigating the effectiveness of TPR
method in improving English vocabulary mastery of elementary school children in
the first grade and their response to teaching English vocabulary using TPR
method.
1.5.The Significance of the Study
This research will give some contributions as follows:
- It attempts to reduce the stress students feel at studying foreign
language. This method also can motivate and make students ease to
learn English.
- The teachers can use TPR method to enrich their teaching method so
that they have a variety of methods to be applied in teaching English.
1.6.Research Method
This study used embedded mixed method, combining quantitative and
qualitative methods (priority to the major form of quantitative data collection, and
secondary status to the supportive form of qualitative data collection as additional
to the primary form).
To find out the answer for the first research question, a quasi-experimental
design was used, involving two groups (control and experiment) and employing
pretest and posttest. Besides, to answer the second research question, qualitative
1.7.Clarification of Terms
In order to make the terms stated in this research be clearly interpreted, the
researcher would like to clarify and specify each terms as follows:
- Effectiveness means the effect or result of TPR method in improving
English vocabulary mastery of elementary school children which will
be measured by independent t-test formula.
- Total Physical Response is as a language teaching method used as
treatment to teach English vocabulary in experiment class.
- Vocabulary in this research refers to single word vocabulary items
about numbers (1 up to 10), colors (red, yellow, green, blue, brown,
black, purple, orange, pink and white), things in the classroom (chair,
table, window, door, whiteboard, clock, broom, lamp and dustbin),
animals (bird, cat, dog, monkey, rabbit, cow, fish, snake and horse). and
fruits (apple, orange, grape, strawberry, tomato, avocado, banana,
melon and watermelon).
- Elementary school children refers to the first graders of one Islamic
elementary school in Cibiru Bandung
- Students’ response refers to verbal and physical response of the students.
1.8.Research Paper Organization
The organization of the research paper consists of five chapters below is to
Chapter I is introduction. It presents the background of the study that
shows the enhancement of English education at elementary schools, and how this
English education requires good teachers to teach with appropriate method. This
chapter also consists of the purposes of the study, research questions, the
significance of the study, research method, scope of the research, clarification of
terms and research paper organization.
Chapter II is literature review. It deals with teaching method, total physical
response (TPR), teaching English vocabulary, teaching English to children,
teaching English to the first grade of elementary school, and related research
findings.
Chapter III is research method. In this chapter, research method is briefly
outlined for this study including research design, variable and hypothesis. This
chapter also consists of population and sample, data collection, evaluating test
instrument (instrument validity and instrument reliability with discrimination and
difficulty index), data analysis (analyzing data on test score, pre-test, post-test,
and from observation), treatment implementation and research procedure.
Chapter IV is findings and discussion. This chapter presents the findings
of the research and further discussion about that. These findings were obtained
from statistical computation using SPSS 15 for windows to know whether TPR
method is effective in English vocabulary mastery of elementary school children.
In addition, the findings were also obtained from observation using field notes to
know how the students respond to teaching English vocabulary using TPR
Chapter V presents conclusion and suggestion. The researcher draws the
conclusion taken from the result of the research about the effectiveness of Total
Physical Response (TPR) method in improving vocabulary mastery of elementary
school children, and proposes the suggestions for English teachers and for further
CHAPTER III RESEARCH METHOD
In this chapter, research method is briefly outlined for this study including
research design, variable and hypothesis. This chapter also consists of population
and sample, data collection, evaluating test instrument (instrument validity and
instrument reliability with discrimination and difficulty index), treatment
implementation, data analysis (analyzing data on test score, pretest, posttest, and
from observation) and research procedure.
3.1. Brief Explanation to Research Method
Research method is clearly stated by Dawson (2009) as the way or means
to gather the data. Meanwhile research, as Creswell (2008) gives meaning, is as a
series of actions or steps used to collect and analyze information to enhance our
understanding of a topic or issue. Fraenkel and Wallen (1996) express that, the
essence of all research originates in curiosity, a desire to know how and why
things happen, including why people do the things they do, as well as whether or
not certain ways of doing things work better than other ways. In short, research is
simply defined as a systematic approach to finding answers to questions (Hatch
and Farhady, 1982). Therefore, it can be concluded that research method is the
way or means we use to collect the data in our research in order to find the answer
of the research problems.
There are three recognized methods for conducting research: quantitative,
Qualitative research is a term with various meanings in educational Research
(Savenye and Robinson, 2003). According to Hancock (1998), qualitative
research is concerned with the opinions, experiences and feelings of individuals
producing subjective data and it is concerned with developing explanations of
social phenomena as they occur naturally and no attempt is made to manipulate
the situation under study. Fraenkel & Wallen (1996) refer qualitative research as
the research studies that explore the quality of relationships, activities, situations
or materials. Moreover this method is given shape by the theory from Dawson
(2009: 14) who states that ―qualitative research explores attitudes, behavior and
experiences.‖
Meanwhile, quantitative research is described as empirical, using numeric
and quantifiable data (Belli, 2008). Marczyk, DeMatteo, & Festinger (2005: 17),
state, ―Quantitative research involves studies that make use of statistical analysis
to obtain their finding.‖ Experiment is frequently regarded as prime examples of
quantitative research and is evaluated against the strengths and weaknesses of
statistical, quantitative research methods and analysis (De Vaus, 2001).
The last one is mixed method. This method involves both collecting and
analyzing quantitative and qualitative data (Creswell, & Plano Clark, 2006).
Johnson, Onwuegbuzie, and Turner (2007: 112) express,
―mixed method research is as becoming increasingly articulated, attached to research practice, and recognized as the third major research approach or
Bazeley (2002), argues that when thinking mixed method, in terms of some
combination of qualitative and quantitative approaches to research are considered
by most social scientists. And according to Bryman (2006: 97) ―There can be little
doubt that research involves the integration of quantitative and qualitative
research has become increasingly common in recent years.‖
There are three types of mixed method according to Creswell (2008): 1.
triangulation mixed method (equal priority to both quantitative and qualitative
data), 2. embedded mixed method (priority to the major form of data collection, e.
g., often quantitative data, and secondary status to the supportive form, e. g. often
qualitative data collection as additional to the primary form), 3. explanatory
mixed method (a priority on quantitative data collection and analysis followed by
small qualitative data collection and analysis in the second phase of the research
or conversely)
This study used embedded mixed method (combining quantitative and
qualitative methods, priority to the major form of quantitative data collection, and
secondary status to the supportive form qualitative data collection as additional to
the primary form).
3.1.1. Research Design
There are eight research designs often used in educational research as
mentioned by Creswell (2008). He states the first three are quantitative, the next
three are qualitative, and the final two combine quantitative and qualitative
design, survey research design, grounded theory design, ethnography design,
narrative research design, mixed method design, action research design.
To find out the answer for the first research question, this study used
experimental research design. According to Marczyk, DeMatteo, & Festinger
(2005: 3), ―Experiment research involves comparing two groups on one outcome
measure to test some hypothesis regarding causation.‖ In other words, it is a study
in which an intervention is intentionally introduced to observe its effects (Shadish,
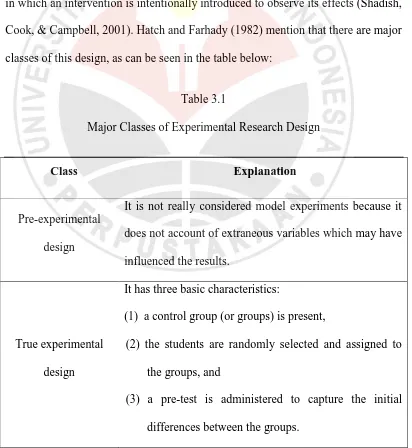
Cook, & Campbell, 2001). Hatch and Farhady (1982) mention that there are major
classes of this design, as can be seen in the table below:
Table 3.1
Major Classes of Experimental Research Design
Class Explanation
Pre-experimental
design
It is not really considered model experiments because it
does not account of extraneous variables which may have
influenced the results.
True experimental
design
It has three basic characteristics:
(1) a control group (or groups) is present,
(2) the students are randomly selected and assigned to
the groups, and
(3) a pre-test is administered to capture the initial
Quasi-experimental
design
It is practical compromises between true experimentation
and the nature of human language behavior to be
investigated.
Ex post facto design
It is used when the researcher does not have control over
the selection and manipulation of the independent
variable. The researcher looks at the type and/or degree
of relationship between the two variables rather than at a
cause and effect relationship.
Factorial design
It is simply the addition of more variables to the other
designs. There will be more than one independent
variable (i. e., moderator variables) considered and the
variables may have one or many levels.
In this case, the type of experimental research design employed was
quasi-experimental design. This design as Fraenkel, & Wallen (1996); Creswell, (2008)
state, is an experiment in which units are not assigned randomly. It is two or more
intact groups (members of which were not randomly assigned) are compared after
one (or more) has been given a specified treatment (Fraenkel, & Wallen, 1996).
Therefore, to know whether TPR method is effective in English
vocabulary mastery of elementary school children this study employed a
quantitative method research and it used a quasi-experimental design because it
did not include the use of random selection involving two groups (control and
Table 3.2
Description of Research Design
Experiment
Class
Pretest X (treatment with TPR method) Posttest
Control Class Pretest X (treatment with conventional
method)
Posttest
Besides using quantitative method involving a quasi-experimental design,
this research employed qualitative method conducting observation using field
notes to investigate students‘ responses toward teaching English vocabulary using
TPR method. Observation was employed to know students‘ behavior and
responses during the treatment given to the experiment group. The field note was
to describe their behavior and responses toward the method during the class. To
transcribe, classify and interpret the data from observation, therefore, qualitative
approach was used because in this research as according to Nunan (1992: 4),
qualitative research emphasizes ―understanding human behavior from the actor‘s
own frame of reference, naturalistic and uncontrolled observation, subjective close
to the data the ‗insider‘ perspective.‖
3.1.2. Variable
There are two variables involved in this research, independent and
dependent variables. Variable according to Hatch and Farhady (1982: 12), ―is as
from object to object.‖ They state that independent variable is major variable to be
investigated, which is selected, manipulated, and measured by the research. On
the other hands, in their opinion, dependent variable is variable to be observed and
measured to determine the effect of the independent variable. In line with their
opinion, Lane (2003: 1) mentions variables are as ―properties or characteristics of
some event, object, or person that can take on different values or amounts.‖ He
states when conducting research, experimenters often manipulate variables. He
further explains that the variable manipulated by an experimenter is named
independent variable and dependent variable is the variable when the
experimenter seeks to determine the effect of the independent variable.
This research is about the effectiveness of Total Physical Response
method in English vocabulary mastery of elementary school children. Therefore
the independent variable of this research is Total Physical Response method, and
the dependent variable is English vocabulary mastery.
3.1.3. Hypothesis
Hypothesis, according to Marczyk, DeMatteo, & Festinger (2005: 8), is
―simply an educated—and testable—guess to your research question.‖ Based on
their opinion, it can be concluded that hypothesis is prediction about expected
relationship between two variables tested in our research.
Null hypothesis (H0)was used in this research as foundation. It means that
there will be no differences between groups being studied (Marczyk, DeMatteo, &
experiment and control group in English vocabulary mastery at the time the
pretest had given to both groups.
Alternative hypothesis (Ha), on the other hand, means that there will be
difference between groups being studied (Marczyk, DeMatteo, & Festinger,
2005), was used to indicate that there was significant difference between the
experiment and control group in English vocabulary mastery at the time the
posttest had given to both groups.
3.2. Population and Sample
A ―population‖ consists of all the subjects to be studied and ―sample‖ is a
(smaller) group of subjects which represents a (larger) population (Yount, 2006).
The population of this research was elementary school children in one
Islamic elementary school in Cibiru Bandung. The sample was students of the
first class, class A (21 students) as control group and class B (21 students) as
experiment group. The participant, as students involved in this research learnt
English only at school and received the subject of very basic English once in a
week. Hence the researcher hoped that materials given would be in line with their
English capacity.
3.3. Data Collection
The data or kinds of information obtained in this research were collected
3.3.1. Pretest
Pretest in the form of multiple choices with 17 items of vocabularies to be
taught was given to both control and experiment group after it had tested to other
group as pilot test (pretesting of research instrument), to know the students‘ initial
ability in English vocabulary and to make sure that the initial ability of the two
groups was not significant difference.
3.3.2. Observation
To get additional data to support the data gained from pretest and posttest,
the researcher conducted observation herself during the treatment given to the
experiment group. It was employed to know students‘ behavior and responses
toward teaching English vocabulary using TPR method.
The observation was conducted in this research as it gathers first hand
information about social processes in a naturally occurring context as stated by
Silverman (1993). Besides, it is emphasized by Merriam (1998) who states that
one of the reasons why an investigator gathers data through observation is to
observe things which may lead to understanding the context. Moreover, in line
with Merriam, Alwasilah (2006) states that observation is performed to make a
conclusion about meaning respondents‘ perspective and event or processes
observed.
In conducting the observation, the researcher used field notes. This
instrument was used because the respondents were still the first graders and in
order to make them act naturally, so that they would not know that their activities
gained would answer the second question of this research, to know the students‘
response to teaching English vocabulary using TPR (Total Physical Response)
method.
Field notes here, as Fraenkel & Wallen (1996: 459) state, are as the
detailed notes observers take in the educational setting (classroom or school)
about what is going on, what they hear, see, experience, and think in the course of
collecting and reflecting on their data.
3.3.3. Posttest
Finally, posttest in the form of multiple choices with 17 items of
vocabularies the students had learnt was given to both control and experiment
group to know the progress of the students‘ vocabulary mastery. By comparing
the result of pretest and posttest, it would be known whether the use of TPR
method was effective or not.
3.4. Evaluating Test Instrument
To gain accurate data, the test instrument used in this research requires the
two most important and fundamental characteristics of any measurement
procedure, validity and reliability (Miller, 2009). Therefore, to investigate the
validity and reliability of the test instrument, pilot test was conducted before
implementing it to the research. The pilot test consisted of 20 multiple choice
questions (about the subject to be taught to experiment and control groups) and
was given to another group, the first grade of one state elementary school in
3.4.1. Instrument Validity
Miller (2009: 1) defines instrument validity as ―the extent to which the
instrument measures what it purports to measure over time or across raters.‖
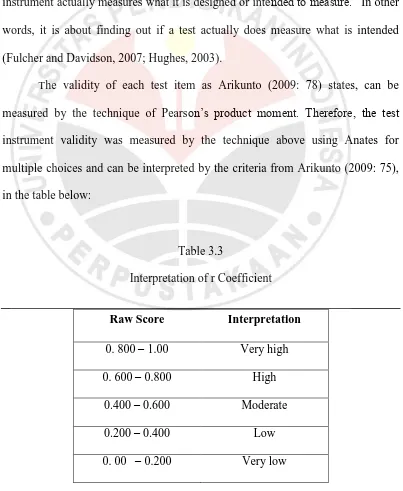
According to Burton & Mazerolle, (2011: 28), ―It refers to the degree that an
instrument actually measures what it is designed or intended to measure.‖ In other
words, it is about finding out if a test actually does measure what is intended
(Fulcher and Davidson, 2007; Hughes, 2003).
The validity of each test item as Arikunto (2009: 78) states, can be
measured by the technique of Pearson‘s product moment. Therefore, the test
instrument validity was measured by the technique above using Anates for
multiple choices and can be interpreted by the criteria from Arikunto (2009: 75),
in the table below:
Table 3.3
Interpretation of r Coefficient
Raw Score Interpretation
0. 800 – 1.00 Very high
0. 600 – 0.800 High
0.400 – 0.600 Moderate
0.200 – 0.400 Low
The measurement result of the test instrument validity is presented in the
subchapter below.
3.4.1.1. The Measurement Result of Test Instrument Validity
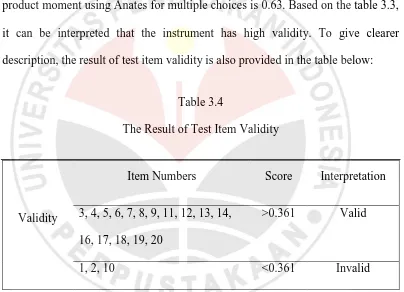
The validity of test instrument measured by the technique of Pearson‘s
product moment using Anates for multiple choices is 0.63. Based on the table 3.3,
it can be interpreted that the instrument has high validity. To give clearer
description, the result of test item validity is also provided in the table below:
Table 3.4
The Result of Test Item Validity
Validity
Item Numbers Score Interpretation
3, 4, 5, 6, 7, 8, 9, 11, 12, 13, 14,
16, 17, 18, 19, 20
>0.361 Valid
1, 2, 10 <0.361 Invalid
Note: The raw score of validity obtained from rcritical (2 - tailed) in the table of Pearson Moment Correlation with N = 30 and the significance level of 0.05, is 0.361.
Based on the table above, considering the validity of each test item, the
items used in the pre-test were 17, number 3, 4, 5, 6, 7, 8, 9, 11, 12, 13, 14, 15, 16,
17, 18, 19, and 20. Whereas, the rest of the items, number 1, 2, 10 are not
appropriate to be used as the research test instrument.
Instrument reliability is defined by Miller (2009: 1), ―as the extent to
which a questionnaire, test, observation or any measurement procedure produces
the same results on repeated trials.‖ According to Burton & Mazerolle, (2011: 27),
―It refers to consistency or repeatability of a test or measurement.‖ In short it is
consistent and dependable (Brown, 2004; Woodley, 2004).
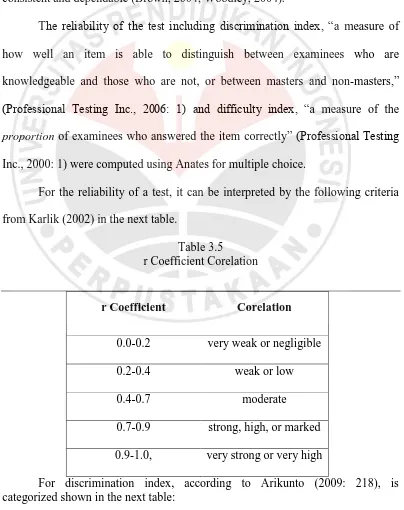
The reliability of the test including discrimination index, ―a measure of
how well an item is able to distinguish between examinees who are
knowledgeable and those who are not, or between masters and non-masters,‖
(Professional Testing Inc., 2006: 1) and difficulty index, ―a measure of the
proportion of examinees who answered the item correctly‖ (Professional Testing
Inc., 2000: 1) were computed using Anates for multiple choice.
For the reliability of a test, it can be interpreted by the following criteria
from Karlik (2002) in the next table.
Table 3.5
r Coefficient Corelation
r Coefficient Corelation
0.0-0.2 very weak or negligible
0.2-0.4 weak or low
0.4-0.7 moderate
0.7-0.9 strong, high, or marked
0.9-1.0, very strong or very high
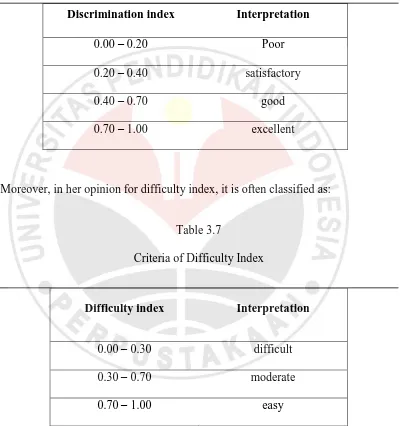
For discrimination index, according to Arikunto (2009: 218), is
Table 3.6
Criteria of Discrimination Index
Discrimination index Interpretation
0.00 – 0.20 Poor
0.20 – 0.40 satisfactory
0.40 – 0.70 good
0.70 – 1.00 excellent
Moreover, in her opinion for difficulty index, it is often classified as:
Table 3.7
Criteria of Difficulty Index
Difficulty index Interpretation
0.00 – 0.30 difficult
0.30 – 0.70 moderate
0.70 – 1.00 easy
The measurement result of test instrument reliability and the results of
discrimination and difficulty index are presented in the subchapter below.
3.4.2.1. The Measurement Result of Test Instrument Reliability
The reliability test instrument measured by the technique of Pearson‘s
it can be interpreted that the instrument has high reliability. In addition, the results
of discrimination and difficulty index measured by the same technique are also
presented in the next table.
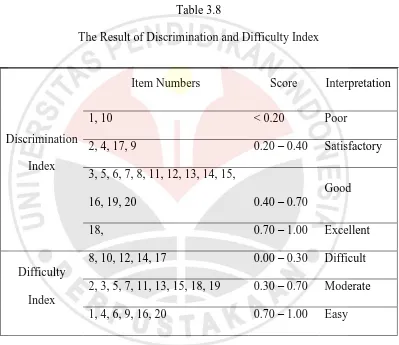
Table 3.8
The Result of Discrimination and Difficulty Index
Discrimination
Index
Item Numbers Score Interpretation
1, 10 < 0.20 Poor
2, 4, 17, 9 0.20 – 0.40 Satisfactory
3, 5, 6, 7, 8, 11, 12, 13, 14, 15,
16, 19, 20 0.40 – 0.70
Good
18, 0.70 – 1.00 Excellent
Difficulty
Index
8, 10, 12, 14, 17 0.00 – 0.30 Difficult
2, 3, 5, 7, 11, 13, 15, 18, 19 0.30 – 0.70 Moderate
1, 4, 6, 9, 16, 20 0.70 – 1.00 Easy
Based on the table above, considering the discrimination index of each test
item, the item numbers 1 and 10 are not appropriate to be used as the research test
instrument as they are poor to be able to distinguish between examinees who are
knowledgeable and those who are not, or between masters and non-masters.
For the difficulty index, from 20 test items, 6 items (number 1, 4, 6, 9, 16,
are categorized moderate, and 5 items (number 8, 10, 12, 14, and 17) are
categorized difficult.
3.5. Data Analyses
3.5.1. Analyzing Data on Test Score
There are two types of formula to analyze score of multiple choice tests,
with punishment and without punishment (Arikunto, 2009). In this research, the
score was analyzed without punishment with the formula:
S = R
S = raw score,
R = right answer (Arikunto, 2009: 120).
3.5.2. Analyzing Data on Pretest
The pretest was given to both experiment and control group before the
treatment (experiment group with TPR method, control group with conventional
method) to know the students‘ initial ability and students‘ initial equality between
the groups and to make sure that the initial ability of the two groups was not
significant difference.
The data on pretest were measured by independent t-test, also called a
between-subjects t-test to determine if the mean value on a given target variable
for one group differs from the mean value on the target variable for a different
group (DeCoster, 2004).
According to Hatch & Farhady (1982), in using t-test to compare two
―(1) the subject is assigned to one (and only one) group in the experiment; (2) the scores are continuous and that there are only to levels to the variable (i. e., only
two means; (3) the variances of the scores in the population are equal, and the scores are normally distributed.‖
In this case, they state that we need to state null hypothesis (H0, the
difference between the two sample means is zero or not significant) and
alternative hypothesis (Ha, the difference between the two sample means is
significant) and set our significance level at .05.
Next, they (ibid., p. 112) mention that we can find the t value with the
following formula:
xe - xc tobs = __________
s(xe – xc)
xe = score mean of experiment group
xc = score mean of control group
s(xe – xc) = standard error of differences between the means
At this point, in their opinion, we need the critical value for t to be
compared with the t value and if the t value is below t critical, the two groups are
not significant difference.
Besides, the data on pretest can be measured by independent t-test using
SPSS statistical analysis package with the steps as follows:
Step 1: A statement of statistical hypothesis
Ho : μ1 = μ2 or means for two groups are equal
Step 2: Setting the α level of risk associated with the null hypothesis (or
Type I error). The level of Type I error is .05.
Step 3: Test statistic using SPSS
Step 4: Interpreting results.
(Hayes, 2000)
3.5.3. Analyzing Data on Post-test
The posttest was given to experiment and control groups after the
treatment (experiment group with TPR method, control group with conventional
method) to know the progress of the students‘ ability and students‘ equality
between the groups and to make sure that the ability of the two groups was
significant difference.
Like the data on pretest, the data on posttest was also measured by
independent t-test, also called a between-subjects t-test to determine if the mean
value on a given target variable for one group differs from the mean value on the
target variable for a different group (DeCoster, 2004). Besides, the data gained
from the posttest given to both experiment and control groups were measured by
matched t-test to determine whether the difference between the two mean (pretest
and posttest) scores of each group was significant.
The procedure for matched t-test according to Hatch & Farhady (1982) is
similar to the t-test for independent samples. They (1982: 115) state that ―the
difference is more conceptual rather than computational.‖ To make it clear they
obtained from two independent groups of students, while for matched t-test we
compare two means from the same students.
To measure the data using matched t-test, they also imply that we need to
state null hypothesis (H0, the difference between the pre-test and post-test means
is not significant) and alternative hypothesis (Ha, the difference between the
pre-test and post-pre-test means is significant) and set our significance level at .05.
Next, they (ibid., p. 117) mention that we can find the t value with the
following formula:
x1 – x2 t = __________
sD
x1 = score mean of pre-test
x2 = score mean of post-test
sD = standard error of differences between the means.
At this point, in their opinion, we need the critical value for t to be
compared with the t value and if the t value is above t critical, the two groups are
significant difference, there is significant difference between the pretest and
posttest means. Besides, the data gained from pretest and posttest can be measured
by matched t-test using SPSS statistical analysis package with the steps as
follows:
Step 1 : A statement of statistical hypothesis
Ho : μ1 = μ2 or means for pretest and posttest are equal
Ha : μ1 ≠ μ 2 (μ1 >μ 2 or μ1 < μ 2)
Type I error). The level of Type I error is .05.
Step 3 : Test statistic using SPSS
Step 4 : interpreting results.
(Hayes, 2000)
3.5.4. Determination of the Effect Size
Determining the effect size is important to know if the statistical test was
significant (Creswell, 2008). “Whereas statistical tests of significance tell us the
likelihood that experimental results differ from chance expectations, effect-size
measurements tell us the relative magnitude of the experimental treatment.‖
(Thalheimer, & Cook, 2002: 2)
In other words, the effect size is a measure of the magnitude of the strength of a
relationship between an independent (intervention) and dependent (outcome)
variable (Dunst, Hamby, & Trivette, 2004; Marczyk, DeMatteo, & Festinger,
2005; Fraenkel & Wallen, 1996), or as ―a means for identifying the practical
strength of the conclusion about the relationship among variables in a quantitative
study‖ (Creswell 2008: 195). Therefore, according to Thalheimer & Cook (2002),
effect sizes are especially important because they allow us to compare the
magnitude of experimental treatments from one experiment to another.
The formula to determine the effect size, as quoted from Rosenthal (1991:
19), is as follows:
r = __________ t2 _______
√ t2 + df
r = correlation coefficient of the effect size
t = t value
df = degrees of freedom
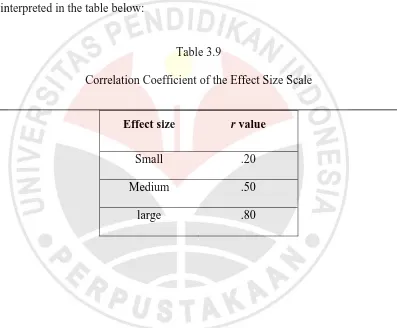
with the scale from Cohen‘s (1992, as cited in Thalheimer, & Cook, 2002) is
interpreted in the table below:
Table 3.9
Correlation Coefficient of the Effect Size Scale
Effect size r value
Small .20
Medium .50
large .80
3.5.5. Analyzing Data from Observation
The data obtained by the instrument of observation are qualitative data.
Therefore, they are analyzed by using basic concepts of analyzing qualitative data.
The data are transcribed, classified and interpreted.
After the pretest had been administered to experiment and control groups
and there was no difference of mean statistically between two groups based on
t-test calculation, treatment was given to both groups.
In conducting the treatment, the researcher did not do it by herself. There
were two teachers who gave the treatment. They taught the same English
vocabulary materials (single word vocabulary items) about numbers (1 up to 10),
colors (red, yellow, green, blue, brown, black, purple, orange, pink and white),
things in the classroom (chair, table, window, door, whiteboard, eraser, clock,
broom, lamp and dustbin), animals (bird, cat, dog, monkey, rabbit, cow, fish,
snake and horse), and fruits (apple, orange, grape, strawberry, tomato, avocado,
banana, melon and watermelon) for eight meetings but the first teacher
implemented Total Physical Response method as treatment to experiment group
by introducing some language instructions (stand up, follow me, jump, sit down,
draw, touch, point to, take, walk to, act like, imitate the sound of, and show us)
(the syllabus and lesson plan for this group are enclosed in the appendices).
Meanwhile, the other teacher treated conventional method to control group.
3.7.Research Procedures
In conducting this research, the procedure was divided into two phases as follows:
1. Planning the research
- Identifying a research problem
- Planning an experimental research (conducting observation to school and
asking permission, making lesson plan, preparing material to be taught and
test instrument)
- Conducting pilot test
2. Conducting the research
- Conducting the experiment
. pretest to both groups (April 4, 2012)
. treatment with TPR method to experiment group (April 16 – May 28, 2012)
. treatment with conventional method to control group (April 12 – May 31,
2012)
. observation to experiment group (April 16 – May 28, 2012)
. posttest to both groups (June 2, 2012)
- Analyzing the data and making conclusion
CHAPTER V
CONCLUSION AND SUGGESTIONS
This chapter presents conclusion and suggestion. The researcher drew the
conclusion taken from the result of the research about the effectiveness of Total
Physical Response (TPR) method in improving English vocabulary mastery of
elementary school children, and proposed the suggestion for English teachers and
for further research.
5.1.Conclusion
Based on the result of the analysis in the previous chapter, it can be drawn
on conclusion that:
- Total Physical Response (TPR) method is effective in improving English
vocabulary mastery of elementary school children, especially for the first
grade. It is supported by the posttest result of experiment class is significantly
improved after being given TPR method treatment, different from that of
control class after being given conventional method treatment.
- TPR method is very suitable for children’s characteristics, as they love moving
around and get bored easily if just sitting on the chair. Moreover, it is
supported by their good response toward TPR method.
- TPR method can motivate the children to be interested in learning English
vocabulary, as it is entertaining them. It is proven by their being happy,
- TPR method, however, can cause some students reacting over as they are too
excited participating in the learning activity.
5.2.Suggestions
Based on the conclusion above, the writer would like to offer some
suggestions, they are:
The teachers can use TPR to enrich their teaching method so that they
have a variety of methods to be applied in teaching English, especially for
teaching English vocabulary for children. Besides, it attempts to reduce the stress
students feel when studying foreign language. Therefore, it can motivate and
make students ease to learn English.
Meanwhile, the findings revealed some limitations as the research was
carried out only to two groups of participants and conducted over a short period of
time starting from April 4 – June 2, 2012. Thus, to achieve the representative data,
the next researcher can do the similar research in a big scale to more than two
groups of participants over much longer schedule, even though, there is an issue
of eliminating English in the new curriculum (2013-2014). However, the Minister
of Education and Culture, Musliar Kasim, has clarified that English for
elementary school in the new curriculum is not eliminated but it is not categorized
REFERENCES
Adam (2011). The effectiveness of the total physical response technique in motivating students to learn vocabulary. A case study of a year 3 Latin
class. Retrieved 27 May, 2012, from
http://www.classicsteaching.com/research_pdfs/RP37_Adams_2011_F.pdf
Afifah, R. (2012). Sekali lagi ditegaskan, Bahasa Inggris SD tidak dihapus. (2012, November 13. Kompas. Retrieved Februari 1, 2013, from
http://edukasi.kompas.com/read/2012/11/13/11331821/Sekali.Lagi.Ditegas
kan.Bahasa.Inggris.SD.Tak.Dihapus.
Alwasilah, A. C. (2006). Pokoknya kualitatif. Jakarta Pustaka Jaya.
Aminudin (2009). Teaching vocabulary through TPR method to children.
Retrieved March 1, 2012, from
Asher, J. (1968, p. 38). The total physical response method for Second Language Learning. Retrieved May 28, 2012 from http://www.dtic.mil/cgi-bin/GetTRDoc?AD=AD0674868.
Asher, J. (1984, p. 35, 36). Language by command: The Total Physical Response approach to learning language. Context Institute. Retrieved February 9, 2012, from http://www.context.org/ICLIB/IC06/Asher.htm.
Asher, J. (2000). Year 2000 update for Total Physical Response. Retrieved, June
12, 2012, from
http://www.languageimpact.com/articles/other/ashertpr.htm.
Belli, G. (2008). No experimental quantitative research. Analysis and interpretation in nonexperimental studies. Retrieved June 20, 2012 from
http://media.wiley.com/product_data/excerpt/95/04701810/0470181095-1.pdf.
Biemiller, A. (2000). Teaching vocabulary early, direct, and sequential. Retrieved
May 28, 2012, from language pedagogy. New York: Addison Wesley Longman, Inc.
Brown, H. D. (2004). Language assessment principles and classroom practices. New York: Longman.
Bryman, A. (2006, p. 97). Integrating quantitative and qualitative research: how is it done? SAGE Publications (London, Thousand Oaks, CA and New Delhi) vol. 6(1) 97–113.
Burton, L. J., & Mazerolle, S., M. (2011). Survey instrument validity part I: principles of survey instrument development and validation in athletic training education research. Athl Train Educ Journal, 6(1):27-35.
Cameron, L. (2001). Teaching languages to young learners. UK: Cambridge University Press.
Chung, T. M., & Nation, I. S. P. (2003). Technical vocabulary in specialised texts. Reading in a Foreign Language. Volume 15, No. 2,
Creswell, J. W., & Plano Clark, V. L. (2006). Designing and conducting mixed methods research. Thousand Oaks, CA: Sage
Cresswell, J. W. (2008, p. 1). Educational research: Planing, conducting, and evaluating quantitative and qualitative research. Third edition, Upper Saddle Creek, NJ:Pearson Education, Inc.
Dawson, C. (2009, p. 14). Introduction to research methods. London: How to Book Ltd.
DeCoster, J. (2004). Data analysis in SPSS. Retrieved August 10, 2012 from http://www.stat-help.com/notes.html
De Vaus, D. A. (2001). Research design in social research. London: SAGE.
Dörnyei, Z. (2007). Creating a motivating classroom environment. In Jim Cummins and Chris Davison (Editors) International Handbook of English Language Teaching (p. 719-731). New York, USA: Springer Science+Business Media.
Dunst, C. J., Hamby, D. W., & Trivette, C. M. (2004). Guidelines for Calculating Effect Sizes for Practice-Based Research Syntheses. Centerscope. 3(1), p. 1 – 10.
Edisonyusman (2011, p. 1). Teaching English for young learner. Retrieved April
9, 2012, from
http://edisonyusman.wordpress.com/2011/03/29/teaching-english-for-young-learner/.
Elizabeth (2010). Methods of teaching English. Discovery Publishing House.
Ellis, R. (1996). The study of second language acquisition. Oxford University Press.
Evan. (2011, n. p.). Total Physical Response. Retrieved February 9, 2012 from http:// blog.hhereareyourkeys.org/2011/01/10/4-total-physical-response=tpr-top-20-techniques-of-wayk/
Fatmawati. (2011). Teaching Mathematics using two-languages. Retrieved Mei 3, 2012 from http://lovewatergirl.wordpress.com/2011/01/21/teaching-mathematics-using-two-languages/
Fillmore, L. W. and Snow, C. (2000). What teachers need to know about language. Washington D.C.: ERIC Clearinghouse on Languages and Linguistics.
Folse, K. S. (2004). Myths about teaching and learning second language vocabulary: What recent research says. TESL Reporter 37(2), p 1-13.
Folse. K. S. (2008). Six Vocabulary Activities for the English Language Classroom. English Teaching Forum no 3. Retrieved June 11, 2012 from http://exchanges.state.gov/englishteaching/forum/archives/docs/08-46-3-c.pdf
Fraenkel J. R., & Wallen N. E. (1996, p. 7, 459). How to design and evaluate research in education. New York: McGraww-Hill, Inc.
Fulcher, G., & Davidson, F. (2007). Language testing and assessment: An advanced resource book. London and New York: Routledge.
Glisan, E. (2008). TPR: a technique for teaching all skills in Spanish. American Council on the teaching of Foreign Language.
Halliwell, S. (1992, p. 3). Teaching English in the primary school. London: Longman.
Hancock, B. (1998). Trent Focus for Research and Development in Primary Health Care: An Introduction to Qualitative Research. Trent Focus, University of Nottingham
Harmer, J. (2001, p. 38). The practice of English language teaching. Longman.
Harmer, J. (2007). How to teach English. Essex: Pearson Longman.
Hatch, E., & Farhady, H. (1982). Research design and statistics for applied linguistics. Rowley, Mass. : Newbury House Publishers, Inc.
Abstract retrieved February 9, 2012 from
http://conference.nie.edu.sg/paper/new converted/0600466.pdf.
Hughes, A. (2003). Testing for language teachers. Second edition. Cambridge: Cambridge University Press.
Istiqomah (2011). Globalisasi dan Bahasa Inggris. Retrieved April 9, 2012, from
http://www.psb-psma.org/taxonomy/term/230/0.
Johnson, J. S., & Newport, E. L. (1989). Critical period effects in second language learning: The influence of maturational state on the acquisition of English as a second language. Cognitive Psychology, 21, 60-99. Retrieved May 31, 2012 from http://www.psy.cmu.edu/~siegler/JohnsnNewprt89.pdf.
Johnson, R. B., Onwuegbuzie, A. J., & Turner, L. A. (2007). Toward a definition of mixed methods research. Journal of Mixed Methods Research 1; 112. Sage Publication.
Jurickova, O. (2006). Teaching English vocabulary to children with specific learning difficulties (Thesis, Pardubice University, 2006). Retrieved Mei 3, 2012 from http://dspace.upce.cz/bitstream/10195/23901/1/D16163.pdf
Karlik, S. J. (2002). Exploring and summarizing radiologic data. Retrieved Jully 10, 2012 from http://www.ajronline.org/content/180/1/47.full.
Lane, D. (2003). Independent and dependent variables. Retrieved June 30, 2012, from http://cnx.org/content/m10802/latest/.
Larsen, D., and Freeman. (1986). Techniques and principles in language teaching. Oxford: Oxford University Press.
Lefever, S. (2007). English for very young learners. Retrieved May 28, 2012 from
Levine, L. N. (2005). Unique characteristics of young learners. Retrieved May 28, parents, teachers and microcomputer can help. Cambridge, Massachusetts. Bolt Beranek and Newman, Inc. misconceptions about age and L2 learning. TESOL Quarterly, 34( 1), pp. 9-34.
Marczyk, G., DeMatteo, D., & Festinger D. (2005, p. 17). Essentials of research design and methodology. Hoboken, New Jersey. John Willey & Sons, Inc.
Maroto, L. M. P., Garrido, C. S., & Fuentes, E. M. (n.d., n. p.). TPR and activities in the language class room. Retrieved February 9, 2012 from http://www4.ujaen.es/-gluque/TPR_presentation.pdf.
Mastromarco, A. (n. d.). Learning Italian at school with TPR by playing, creating, and doing: An Italian version of Total Physical Response. Retrieved June 12, 2012 from http://www.tpr-world.com/Learning_Italian.pdf
Matondang, M. E. (2005). Menumbuhkan minat belajar bahasa Inggris anak. Jurnal Pendidikan Penabur - No.05/ Th.IV/ Desember, 129.
McCharten, J. (2007, p. 26). Teaching vocabulary. Cambridge University Press.