26
Journal of Public Administration Studies
U R L : h t t p : / / w w w . j p a s . ub . a c . i d / i nd e x . p hp / j p a sAfter Balanced Scoredcards Implementation: What Changes Does It Bring? (a Case
of Ministry of Foreign Affairs Indonesia)
Bernard Teguh R. Sirait
a aKementrian Luar Negeri, Indonesia
———
Corresponding author. e-mail: [email protected]
1. Introduction
Balanced Scorecard (BSC) is intended to translate an organization's mission and strategy into a comprehensive set of performance measures that provides the framework for a strategic measurement and management system. It should be used as the cornerstone of a management system that communicates strategy, aligns individuals and teams to the strategy, establishes long-term strategic targets, aligns initiatives, allocates long- and short-term resources, and provides feedback and learning about the strategy (Kaplan and Norton, 1996:18).
The Balanced Scorecard provides a representation of the organization's shared vision. The objectives and measures on the Balanced Scorecard should clarify and communicate a vision that mobilizes and focuses the organization. The Balanced Scorecard communicates a holistic model that links individual efforts and
accomplishments to business unit objectives. Thus, a shared vision and shared performance model, structured around the Balanced Scorecard, provides an essential element for a strategic learning process (Kaplan and Norton, 1996:20).
Even though the BSC concept at the beginning is designed for private companies which emphasis its business on profit earning, BSC is also valuable for public sector. There are seven possible reasons why governments should implement BSC. They are: demonstrating accountability, attracting scarce resources, creating a focus on strategy, producing information, self-preservation, driving changes, and inspiring trust (Niven, 2003:39-42).
Performance improvement of public-institution is desirable. Fryer et al (2009:491) suggested that regarding performance management in public sector, there are still major problems and the expected IN F O R M A S I A R T IK E L A B S T R A C T
Article history:
Data submission : 10 January 2018 1st revision: 11 February 2018
Accepted: 13 February 2018 Available online: 12 May 2018
This paper aims to study the result of BSC implementation in Public Sector
especially MoFA of the Republic of Indonesia and the impacts of BSC to MoFA’s
performance indicators. The study used content analysis combined with the descriptive method in processing the data. Secondary data used were MoFA’s
performance documents “Laporan Kinerja Tahunan” (LKJ) within 2014-2016. The
result implied that BSC implementation has improved the number of MoFA’s Key
Performance Indicator (KPI) significantly. It also affect human resources management situation. Moreover, the implementation of BSC has improved
performance achievement of the MoFA’s KPI. However, the limitation of this paper is that the data used in this study is only secondary data about MoFA’s
performance. The LKJ was submitted in order to fulfil the accountability obligation, and the achievement were mostly claimed by MoFA itself. This study give evidence of BSC implementation in public sector in Indonesia, a developing country. It suggests that public institution need to consider BSC implementation seriously, due to public performance improvement.
2018 FIA UB. All rights reserved. Keywords: public sector, balanced
scorecard, performance improvement, Indonesia
27 improvements in performance, accountability, transparency, quality of service and value for money have not yet materialized.
BSC might be the answer in improving organizational performance. Some studies reported the improvement of public organization’s performances due to the implementation of BSC. Dimitropoulos et al (2017:375) reported the achievement of citizen’s satisfaction from athletic services reported in Greece local government sport organization after the BSC implementation. An application of BSC in the form of Public Sector Scorecard (PSS) had also testified that PSS is an effective framework in helping public and third sector organizations monitor and improve their services and focus on delivering desired outcomes including value for money (Moullin, 2017:454).
To implement BSC in public sector, some adjustment from the original concept is needed. Niven (2003:33) presented those adjustments, for example, by moving the organization mission to the top of diagram. This adjustment is necessary because of the difference between private and public sector orientation. Mission achievement is the main concern of public sector organization.
Ministry of Foreign Affairs of the Republic of Indonesia (MoFA) is one of government institutions that has already implemented BSC. Other institutions using the Balanced Scorecard (BSC) approach to improve their performance measurement system are the Indonesian Ministry of Finance, the Corruption Eradication Commission (KPK), the Indonesian Ministry of Marine and Fisheries (KKP), and the Audit Board of the Republic of Indonesia (BPK RI) (Budiarso, 2014:5).
BSC in MoFA is a part of effort to reach good governance. It is under the strategic goal of “Good organization and governance under the Key Performance Indicator (KPI) of “Grade of MoFA’s Bureaucracy Reformation Progress”.
Although BSC concept has existed for about a decade, there are still few studies about how the BSC implementation process, challenges or result in public sector, especially in developing countries such as Indonesia (Budiarso, 2014:7). Thus, this paper tries to figure out what had happened after BSC implementation in MoFA as one of public institution in Indonesia.
The purpose of this research is to study the result of BSC implementation in Public Sector especially MoFA of the Republic of Indonesia and how the BSC bring impacts to MoFA’s performance indicators. The research question which will be guidance for this study are:
a) What changes has BSC brought implementation in MoFA’s performance management?; and
b) Does BSC implementation improve MoFA’s working performances?.
2. Theory
2.1. The Balanced Scorecard (BSC)
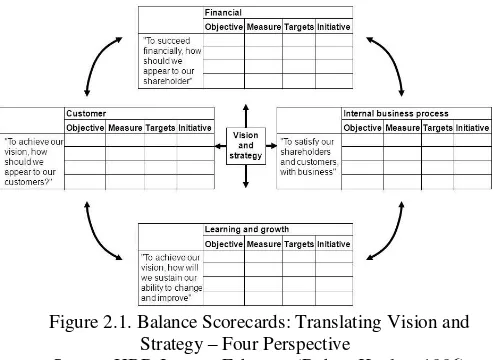
As previously mentioned, BSC translates an organization's mission and strategy into a comprehensive set of performance measures that provides the framework for a strategic measurement and management system. It measures organizational performance across four linked perspectives: financial, customer, internal business process, and learning and growth (Kaplan and Norton, 1996:18).
Figure 2.1. Balance Scorecards: Translating Vision and Strategy – Four Perspective
Source: HBR January February (Robert Kaplan, 1996)
Figure 2.1 describes how the vision and strategy is translated to the four perspectives. To be more detail about the four perspectives of the scorecard, they are explained as follow:
a) Financial perspective: because the final objective of an enterprise operation is to make profit for shareholders, the BSC retains an emphasis on achieving financial objectives.
b) Customer perspective: the loyalty of the customer to their suppliers is so critical that “customer satisfaction” becomes one of the core outcome measures and long-term strategy.
c) Internal business process perspective: in this perspective, executives will identify the key processes in which an organization must excel to meet the above objectives.
d) Learning and growth perspective: to face the serious change of competition environment and meet the long-term goals, the companies should continually improve their capabilities to achieve the internal process improvements, customer satisfaction, and ultimately financial success.
Common benefits of implementing BSC, mentioned by its user, are summarized by Niven (2003:39-42) as follows:
28 You need to demonstrate advancement on the high-level, mission-based objectives that your constituents are requiring you to provide. The Balanced Scorecard with its focus on mission and strategy and broad view of performance allows you to do just that”.
b) Attract Scarce Resources (Funding and Employees) “By developing a Balanced Scorecard, reporting progress on achieving your strategic objectives, and proving your efficiency and effectiveness, you can ensure the migration of scarce resources to your organization, department, or agency”.
c) Create a Focus on Strategy
“..The Balanced Scorecard allows you to focus on what really matters, the few critical drivers of success that power your strategy and lead to the achievement of your mission… To achieve demonstrated results, attract resources, and prove your accountability, you absolutely must keep your eyes on your strategy at all times.”
d) Produce Information, Not Data
“The Balanced Scorecard resides exclusively in the information domain. It does so by measuring only the critical few drivers of organizational success. A Balanced Scorecard that contains 50 or 60 measures probably has abundant data, but I’ll take a Scorecard that has 10 or 12 measures for real information value.”
e) Self-Preservation
“The Balanced Scorecard allows you to demonstrate quality results at efficient prices—that is, if you’re need to meet your desired outcomes.
g) Inspire Trust
“..The Balanced Scorecard can help you demonstrate accountability and attract scarce resources to your organization. The driver of both those outcomes is enhanced trust: trust from the community, trust from your funders, and trust from your employees. The benefits of increased levels of trust are by no means limited to the intangible.”
For public sector, there are some factors which is related to BSC implementation in a public organization. The decision on not adopting or abandoning the BSC implementation process was essentially due to the
existence of other systems which already provide some of the data that could be provided by the BSC (Quesado, Guzmán, & Rodrigues, 2014:217). Bobe et. al. (2017: 1251) found that the implementation of a trans-organizational use of the BSC as a sector-level planning and performance evaluation system for organizations interlinked through sector-wide strategic goals. The politico-ideological context facilitated the emergence of a relatively novel role for the BSC as a trans-organizational system.
There are several studies about the experiences of public sector organizations implementing BSC concept. A study by Wilson, Hagarty, & Gauthier (2003, p. 62) mentioned that to be successful, performance measurement must become an integral part of strategic planning procedures and management processes. The Scorecard should be viewed as a key management tool in telling a performance story on strategy implementation. Chan (2004:219) suggested that among the 14 municipal governments that have implemented the balanced scorecard, their administrators reported positively about their experience and felt that the balanced scorecard could be a useful management tool for their organizations. Greatbanks and Tapp (2007:870) found that scorecards have had a positive effect on Customer Service Agency section of Dunedin City Council (CSA) performance, although it is difficult to identify their contribution precisely. Team managers felt many of the excellence targets would not have been achieved without the focus and transparency inherent in the scorecards. In other study, the advantage of BSC is providing a reason to clarify organizational strategy; to improve how this organization works and to develop a new role for the controller. The BSC project provided an opportunity to innovate (Dreveton, 2013:135).
For public sector, some challenges might emerge in the implementation. Umashev & Willett (2008:394) pointed out that the effectiveness to scorecard significantly related to some factors, deficiencies in effective communication through failures of leadership, training, feedback and adaptation systems, low employee empowerment and inadequate incentive structures. Northcott & Ma’amora Taulapapa (2012:180) in their study mentioned those challenges are lack of a perceived strategic orientation within public sector organizations, the necessary modification of the BSC to suit an organization’s context, BSC causality may be particularly poorly understood and under-developed in the public sector.
3. Research Methods
Using a combination of content analysis and descriptive study approach, this paper provides new evidence of BSC implementation in public sector institution, specifically in Indonesia. It explore how the concept influence performance management in the institution and how the performance indicator are affected both in the measurement and achievement.
29 concept of BSC is compared to MoFA’s strategic planning concept.
Descriptive study is suitable to explain a situation which is not yet understood. It can describe the simple statistical situation of data which is being studied. This method is employed especially regarding the understanding of performance achievement trend in MoFA.
Secondary data is collected from MoFA’s performance reports in 2014 of which BSC had not been implemented, and from 2015 when BSC was firstly implemented in MoFA, and 2016 when there was a revision in the strategic planning of MoFA. Other documents related to strategic planning determination and other related achievements of MoFA in 2014-2016 also studied to comprehend the more detailed factors influencing MoFA’s performance.
4. Results and Discussion
The study aims to comprehend the result of BSC implementation in MoFA of the Republic of Indonesia. It is also intended to learn how the BSC affects MoFA’s working performance.
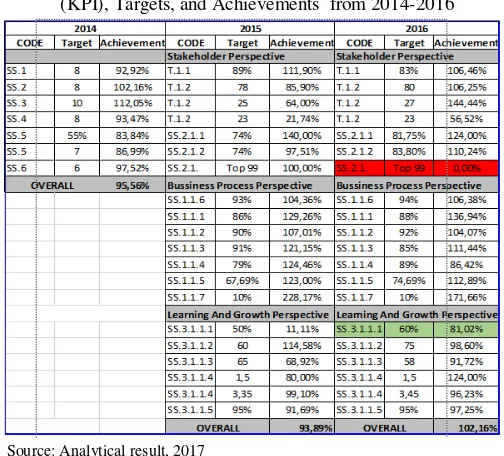
From the Performance Documents of MoFA (2014-2016), I made a summary of the Key Performance Indicators (KPI), targets, and achievements. This was done in order to compare the KPI and the performace achievements side by side. However, since the KPI of 2014 was different from 2015 and 2016, so the comparation only be done by the overall performace achievement. To simplify the performances presentation, the tabel below only shows the KPI code.
Table 4.1. Summary of The Key Performance Indicators (KPI), Targets, and Achievements from 2014-2016
Source: Analytical result, 2017
After the BSC implementation, the most obvious changes existing in the performance documents were the number of KPI. In 2014, before BSC implementation in MoFA, there were only seven major KPI for MoFA performances. In 2015 (after BSC implementation), the
KPI transform to be 20 KPI wtih three major BSC perspectives: Stakeholder, Bussiness Process, and Learning and Growth. Figure 2 present the detail summary of the shift of KPI and performance achievements in MoFA.
From the figure, we can comprehend that each perspective consists of six to seven KPI. In the Stakeholder Perspectives there were seven KPI of which the KPI targets were vary between persentages or number. Bussiness process perspective also consists of seven KPI with the percentage-form for all performance targets. From the learning and grow perspective, there were six KPI. Their performance targets were determined by persentage, number, or index.
For more detail, seven KPIs of 2014 are as follow:
a) SS.1 Index of Indonesia’s role and leadership in the ASEAN society (KPI 1);
b) SS.2 Index of Indonesia’s diplomacy role in handling the multilateral issues (KPI 2);
c) SS. 3 Index of Indonesia’s cooperation in various fields with countries and organizations in the Asia-Pacific, Africa, America and Europe (KPI 3);
d) SS. 4 Index of diplomacy in the area of law and international treaties (KPI 4);
e) SS. 5 Percentage of problems/ cases completed of Indonesian citizen and Indonesian legal entity abroad (KPI 5);
f) SS. 5 Index of protocol and consular services (KPI 6); and
g) SS. 6 Index of positive image of political and international relation accomplishment from domestic and international society (KPI 7).
KPIs of 2015 are as follow:
a) T.1.1 Level of Indonesian influence in the international world;
b) T.1.2 Number of accredited countries which achieve the target of escalation of trade value with Indonesia (KPI-1);
c) T.1.2 Number of accredited countries which achieve the target of escalation of foreign infestations value to Indonesia (KPI-2);
d) T.1.2 Optimum beneficial value of economic, finance, and development through international relations (KPI-3);
e) SS.2.1.1 The percentage of follow-up/ implementation of international agreements by domestic stakeholders;
f) SS.2.12 Index of public service and public aspiration; g) SS.2.1 Rank of Public Service Innovation by Ministry of Apparatus Empowerment and Bureaucracy Reformation;
h) SS.1.1.6 Percentage of implemented foreign policy recommendation;
i) SS.1.1.1 Index of maritime and border diplomacy; j) SS.1.1.2 Percentage of Indonesian recommendation
and initiatives which are accepted in every ASEAN meetings;
k) SS.1.1.3 Index of Indonesia’s role in the international society;
30 m)SS.1.1.5 Index of services and protection for
Indonesian citizen and Indonesian as well as diaspora empowerment;
n) SS.1.1.7 Percentage of deviation for the effectiveness of the formulation and implementation of foreign policy;
o) SS.3.1.1 Percentage of officials who have met standard of competence;
p) SS.3.1.2 Grade of MoFA’s bureaucracy reformation progress;
q) SS.3.1.3 Index of employee satisfaction; r) SS.3.1.4 Index of information security;
s) SS.3.1.4 Index of Indonesian e-government rank; and t) SS.3.1.5 Percentage of budget and performance
realization.
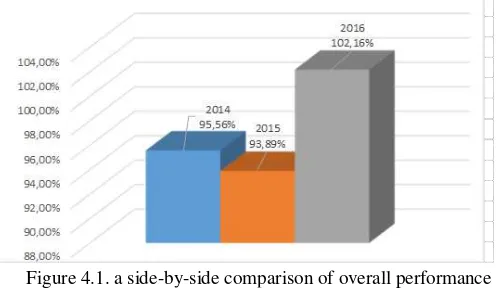
The KPI of 2016 were a little similar to the 2015. Almost all of KPI existing in 2015 also consistently appear in 2016. Only one KPI that was changed in 2106 using the code of T.1.2 KPI-3, from “Optimum beneficial value of economic, finance, and development through international relations” to become “Number of accredited countries which achieve the target of escalation of foreign tourist number visiting Indonesia. The target set for the T.1.2 KPI-3 was exaclty the same in 2015 and 2016. The display below present a side-by-side comparison of overall performance of MoFA from 2014-2016:
Figure 4.1. a side-by-side comparison of overall performance of MoFA from 2014-2016
Source: Analytical result, 2017
From figure 4.1, it is implied that the overall performance achievements of MoFA in 2014-2016 were fluctuated. In 2014, MoFA achieved 95.56% overall performance, while in 2015 the overall performance achievement was slightly declined to 93.89%. However, in 2016 the performance increased dramatically to 102.16%. It can be concluded that over the periods of 2014-2016 MoFA had achieved high performances achievements regardless the implementation of BSC.
Table 4.2. The Mean and Variances of all KPI’s Achievements from 2014 - 2016
2014 2015 2016
Mean 95,56% 101,19% 103,33%
Variance 0,007735 0,189075 0,112364
Source: Analytical result, 2017
Table 4.2 presents the mean and variances of all KPI’s achievements throughout 2014-2016. Mean for 2014 performance was 95.56% which also equals to the
overall performance stated in the performance report. Performance data in 2014 had the variance of 0.0077. This means that the performance achievements of each KPI in 2014 had small variation from the average number which was 95.56%. Mean of 2015 and 2016’s performance achievements were in succession 101.19% and 103.33%. Further, the variance for both years were 0.189 and 0.112 respectively. This small variance shows that overall KPI achievements of both years close or relatively similar to the average performance achievement. It emphasises that MoFA had high performance achievements throughout 2014-2016 and the performances were increased after the implementation of BSC. This finding in line with Greatbanks & Tapp (2007) finding.
One interesting finding to be presented from MoFA’s performance documents is that financial perspective from BSC concept does not explicitly mentioned. Indeed, the financial persepective is inclusively appear in the Learning and Growth persepective as the last KPI from the list. It means that MoFA has adapted the perspective into the public-sector character of MoFA which do not emphasise Finance aspect as the major concern of the organization but more concern about customer perspective. In this case, it is named as stakeholder perspective.
Other improvement due to BSC implementation is the competency-based placement for MoFA’s employee. In 2015 this KPI was targeted for 50%, means that MoFA targeted that 50% of its employee are competent for they position, however only 11% ot the target was achieved in that year. Surprisingly, in 2016, the achievement reach 81% of 60% target, means that there were about 48% of MoFA’s employees were placed in line with their competency. This finding shows that BSC implementation has improved human resources management situation in MoFA. This is expected to improving employee’s satisfaction within the organization. The finding is similar to what Greatbanks & Tapp (2007) found in their research in New Zealand.
31 SS.2.1.1 and SS.2.1.2 were targeted 74%, and were achieved more that 100% for SS.2.1.1 and almost 100% for SS.2.1.2. However, in 2016, both KPIs were only targeted for around 80% and achieved the performance of more than 100% in 2016. Other example are for the KPIs with the code of SS.1.1.5 which were targeted 67,69% in 2015 and achieved the performance of 123%. In 2016 SS.1.1.5 was targeted with slightly increase to 74,69%. The performance achieved in 2016 was about 112% for the KPI. For the KPI code SS.1.17, since the KPI is formulated with deviation, so MoFA wants to keep the deviation maximum of 10% in 2015 and 2016. Performance achievement for this KPI in 2015 and 2016 above 100%. It means that MoFA successfully maintain the deviation below 10%.
The findings implies that BSC implementation is a strategic step to improve working performace. In this case, there were more comprehensive KPI existed in MoFA’s performance documents and they trigger to the improvement in many aspects of MoFA, one of which was the human resources management. This finding suggest that public sector institution need to seriously consider to implement BSC in their performance system.
5. Conclusion
Scholars suggest the BSC implementation in public sector in order to improve public sector performance. This concept has helped private sector in building sustainable performance management system. With certain adjustment, public sector institution implementing this concept is predicted to have the similar benefit such as sustainable performance improvement. However, there are only few evidences showing the the result of BSC implementation in public sector.
This study shows and concludes the improvement of MoFA’s performance after the implementation of BSC. The increase of KPI numbers after BSC implementation shows that BSC has made MoFA’s KPI become more comprehensive applying the four BSC perspective: customer/ stakeholder, business process, learning and growth, and also finance. Better human resources management situation was also one of indirect impact of BSC implementation in MoFA.
Nevertheless, the secondary data, processed in this study, only shows limited information of the process and result of BSC implementation. It also presented performance achievements which were mostly claimed by MoFA. Further research involving the key actors of BSC implementation in public sector organization could give more comprehensive understanding regarding the process, the impact in daily activities, and the challenges of BSC implementation in public sector.
References
Bobe, Belete Jember., Mihret, Dessalegn Getie., & Obo, Degefe Duressa. (2017). Public-Sector Reforms And Balanced Scorecard Adoption: An Ethiopian Case Study. Accounting, Auditing &
Accountability Journal, Vol. 30, No. 6, pp. 1230-1256.
Budiarso, A. (2014). Improving Government Performance in Indonesia: The Experience of The Balanced Scorecard in The Ministry of Finance.
Available at
http://www.canberra.edu.au/researchrepository/fil e/1a2c8cf2-bdca-47bd-86d5
674f3a216b70/1/full_text.pdf [Accessed on 10 January 2018].
Chan, Yee-Ching Lilian. (2004). Performance Measurement and Adoption of Balanced Scorecards a Survey of Municipal Governments in the USA and Canada. The International Journal of Public Sector Management. Vol. 17 No. 3, pp. 204-221.
Dimitropoulos, P., Kosmas, I., & Douvis, I. (2017). Implementing the balanced scorecard in a local government sport organization Evidence from Greece. International Journal of Productivity and Performance Management, 66(3), pp.362–379. Dreveton, B. (2013). The Advantages of The Balanced
Scorecard in The Public Sector: Beyond Performance Measurement. Public Money & Management, 33(2), pp.131–136.
Fryer, K., Antony, J., & Ogden, S. (2009). Performance Management in The Public Sector. International Journal of Public Sector Management, 22(6), pp.478–498.
Greatbanks, R., & Tapp, D. (2007). The Impact Of Balanced Scorecards in a Public Sector Environment. International Journal of Operations & Production Management, 27(8), pp.846–873. Kaplan, Robert, S., & Norton, David, P. (1996). The
Balanced Scorecard: Translating Strategy Into Action. Massachusetts, Harvard Business School Press.
Moullin, M. (2017). Improving And Evaluating Performance With The Public Sector Scorecard. International Journal of Productivity and Performance Management, 66(4), pp.442–458. Niven, P. R. (2003). Balanced Scorecard: Step-by-Step
for Government and Nonprofit Agencies. New Jersey: John Wiley & Sons, Inc.
Niven, P. R. (2006). Balanced Scorecard Step-By-Step: Maximizing Performance And Maintaining Results (2nd Ed.). New Jersey: John Wiley & Sons, Inc.
Northcott, D., & Ma’amora Taulapapa, T. (2012). Using The Balanced Scorecard to Manage Performance in Public Sector Organizations. International Journal of Public Sector Management, 25(3), pp.166–191.
Quesado, Patricia., Guzman, Beatriz Aibar., & Rodrigues, Lucia Lima. (2014). Advantages and Contributions in the Balanced Score Card Implementation. Omnia Science, 14(1), pp.186-201.
32 Wilson, C., Hagarty, D., & Gauthier, J. (2003). Results