Volume 103 | Issue 1
Article 5
Winter 2013
An Empirical Assessment of Corporate
Environmental Crime-Control Strategies
Sally S. Simpson
Carole Gibbs
Melissa Rorie
Lee Ann Slocum
Mark A. Cohen
See next page for additional authors
Follow this and additional works at:
http://scholarlycommons.law.northwestern.edu/jclc
Part of the
Criminology Commons
This Criminology is brought to you for free and open access by Northwestern University School of Law Scholarly Commons. It has been accepted for inclusion in Journal of Criminal Law and Criminology by an authorized administrator of Northwestern University School of Law Scholarly Commons.
Recommended Citation
Sally S. Simpson, Carole Gibbs, Melissa Rorie, Lee Ann Slocum, Mark A. Cohen, and Michael Vandenbergh,An Empirical Assessment of Corporate Environmental Crime-Control Strategies, 103 J. Crim. L. & Criminology 231 (2013).
Sally S. Simpson, Carole Gibbs, Melissa Rorie, Lee Ann Slocum, Mark A. Cohen, and Michael Vandenbergh
231
CRIMINOLOGY
AN EMPIRICAL ASSESSMENT OF
CORPORATE ENVIRONMENTAL
CRIME-CONTROL STRATEGIES
SALLY S. SIMPSON,* CAROLE GIBBS,**
MELISSA RORIE,*** LEE ANN SLOCUM,****
MARK A. COHEN,***** MICHAEL VANDENBERGH******
*
Sally S. Simpson is Professor of Criminology and Criminal Justice at the University of Maryland. In addition to research on corporate crime control, her research focuses on white-collar crime data and measurement, gender and crime, and criminological theory. She is the coauthor (with Michael L. Benson) of White-Collar Crime: An Opportunity Perspective.
**
Carole Gibbs is an Assistant Professor at Michigan State University with a joint appointment in the School of Criminal Justice and the Department of Fisheries and Wildlife. Her research interests include environmental justice and corporate and white-collar crimes that harm the environment. Recent publications appear in the British Journal of Criminology and Criminology and Public Policy.
***
Melissa Rorie is a doctoral candidate in the Department of Criminology and Criminal Justice at the University of Maryland, College Park. She is also a Research Assistant at the National Institute of Justice. Her research interests include corporate crime, regulatory policy, white-collar crime, and theory testing.
****
Lee Ann Slocum is an Assistant Professor in the Department of Criminology and Criminal Justice at the University of Missouri—St. Louis. Her research interests include ecological differences in the use of formal social control, stability and change in offending over time, and research methods. Recent work has appeared in Criminology, the Journal of Quantitative Criminology, and the Journal of Research in Crime and Delinquency.
*****
Mark A. Cohen is Professor of Management and Law at Vanderbilt University and University Fellow at Resources for the Future. He previously served as Chairman of the American Statistical Association’s Committee on Law and Justice. His research interests include enforcement of environmental regulations, corporate crime and punishment, information disclosure and voluntary overcompliance, and the cost of street crime.
******
Corporate illegality is often attributed to greed by corporate managers and insufficient legal safeguards. Underlying this argument is an explicit critique of corporate crime regulatory systems. Yet there is little systematic investigation of the relative merits of different types or components of crime-control strategies; research comparing more punitive command-and-control strategies with self-regulatory approaches is particularly lacking. In this Article, we assess these crime prevention-and-control mechanisms in the context of individual and situational risk factors that may increase the likelihood of illegal behavior in the environmental arena. We use data drawn from two groups of business managers who participated in a factorial survey (using vignettes) measuring their intentions to participate in two types of environmental offenses. Generally, results show that the most effective regulatory levers are (1) credible legal sanctions and (2) the certainty and severity of informal discovery by significant others in the firm. We conclude by discussing the implications of our findings for regulatory policy and strategy, and for efforts to account for the role of social norms in corporate environmental compliance.
I. INTRODUCTION
As a subtype of white-collar crime, corporate crime is typically understood to involve illegal behavior by firms and their agents (executives and managers) in the pursuit of corporate benefit.1 Criminologists recognize that even though corporations as juridical persons can be charged with illegal activity, corporations per se do not “act.” Rather, managers make decisions and act on behalf of the company. As corporate “actors,” managers also are potentially subject to sanctions for their participation in or knowledge of corporate illegality.2 Enforcement provisions for environmental crime allow criminal prosecution, in addition to administrative and civil sanctions, against both corporations and responsible corporate officers.3
Most corporate crime research focuses on firm, industry, and manager
1
See JOHN BRAITHWAITE, CORPORATE CRIME IN THE PHARMACEUTICAL INDUSTRY 6 (1984). This definition does not preclude the notion that self-interest may be an indirect cause and consequence of corporate crime in that managers who “problem solve” successfully, albeit illegally, may reap rewards as an aftereffect.
2
See Jennifer Arlen, The Potentially Perverse Effects of Corporate Criminal Liability, 23 J.LEGAL STUD.833, 834 (1994); Urska Velikonja, Leverage, Sanctions, and Deterrence
of Accounting Fraud, 44 U.C.DAVIS L.REV. 1281, 1284 (2011).
3
attributes to differentiate offenders from nonoffenders.4 While this approach is a reasonable one, it often leaves out an important characteristic associated with company (and employee) compliance: the regulatory environment. Specifically, the regulatory environment influences and shapes criminal opportunities through punishment (or the threat of it) and socialization.5
Putatively, command-and-control policies—compliance rules imposed and “policed” by the government with an emphasis on punitive sanctions for violators—influence corporate crime because corporate managers are instrumental actors.6 Decisions and actions flow from a cost–benefit assessment of both the pecuniary and nonpecuniary pros and cons associated with illegal activity. If the benefits of crime are high and the risk of discovery and punishment is low, then criminal opportunities increase as actors perceive less risk associated with illegal activities.7
Another regulatory strategy shifts the primary mechanism of compliance away from the government to the organization itself and to individual actors within it. This approach is less reliant on formal regulation (although the government often plays a secondary role through “enforced” self-regulation) and builds on what Braithwaite has called a
4
See MARSHALL B.CLINARD &PETER C. YEAGER,CORPORATE CRIME 43–53 (1980); EDWIN H.SUTHERLAND, WHITE COLLAR CRIME 17–28 (1949); DAVID WEISBURD ET AL., WHITE-COLLAR CRIME AND CRIMINAL CAREERS 143–49 (2001); Cindy R. Alexander & Mark A. Cohen, Why Do Corporations Become Criminals? Ownership, Hidden Actions, and Crime as an Agency Cost, 5 J.CORP.FIN. 1, 2–5 (1999); Kristy Holtfreter, Is Occupational
Fraud “Typical” White-Collar Crime? A Comparison of Individual and Organizational Characteristics, 33 J.CRIM.JUST. 353, 354–56 (2005).
5 See M
ICHAEL L. BENSON & SALLY S. SIMPSON, WHITE-COLLAR CRIME: AN OPPORTUNITY PERSPECTIVE 193–94 (2009); Henry C. Finney & Henry R. Lesieur, A Contingency Theory of Organizational Crime, in 1 RESEARCH IN THE SOCIOLOGY OF ORGANIZATIONS 255, 255 (Samuel B. Bacharach ed., 1982).
6
See generally NEAL SHOVER &ANDY HOCHSTETLER,CHOOSING WHITE-COLLAR CRIME 168 (2006) (developing the authors’ theory, which assumes a rational actor model, and opining that sanctions do not work because the command-and-control model is not successfully implemented); Gilbert Geis, Is Incarceration an Appropriate Sanction for the Nonviolent White-Collar Offender?, in CONTROVERSIAL ISSUES IN CORRECTIONS 152 (Charles B. Fields ed., 1999) (arguing yes).
7
“family model” of crime control.8
Good corporate citizens are firms whose managers, when confronted with corporate criminal opportunities, will be guided by a sense of right and wrong, by their understanding of how others are likely to view their behavior, and by the extent to which they think the discovery of these acts would bring shame on their companies.9
Effective self-regulation by firms (ethics programs, internal compliance mechanisms, and sensitivity to informal sanctions) should narrow criminal opportunities.
In the corporate crime literature, there has been extensive discussion and debate about different regulatory strategies but far too little systematic investigation of the relative merits of each, and few have taken into account the range of solutions that can be included in regulatory policy.10 Consequently, scholars and policymakers know very little about “what works, what doesn’t, and what’s promising” regarding corporate crime -control strategies.11 In the current study, we offer some empirical insight into this question.
In this Article, we examine the prevention and control of corporate environmental crime in the context of individual and firm-level characteristics that have been linked conceptually and empirically to corporate crime. Specifically, we focus on the extent to which decisions by managers to violate environmental laws are affected by command-and-control or self-regulation prevention-and-command-and-control strategies, command-and-controlling for known risk factors for crime. This research improves on the prior literature in several ways. Much of the corporate crime literature relies heavily on official data sources. As criminologists are well aware, official observations are limited to illegal acts recorded by enforcement agents and neglect those acts that do not come to the attention of authorities. Of equal importance, these data sources do not allow researchers to learn what managers are actually thinking, leaving the intra-organizational decisionmaking process virtually uninvestigated. The current study addresses both of these issues by using data from a factorial survey to examine managerial decisionmaking within a corporate context. Our goal is to determine the extent to which regulatory strategies are effective in the
8 See JOHN BRAITHWAITE,CRIME,SHAME AND REINTEGRATION 54–68 (1989). 9
Sally S. Simpson et al., The Social Control of Corporate Criminals: Shame and Informal Sanction Threats, in OF CRIME &CRIMINALITY:THE USE OF THEORY IN EVERYDAY LIFE 141, 142 (Sally S. Simpson ed., 2000).
10
See NEIL GUNNINGHAM ET AL., SMART REGULATION: DESIGNING ENVIRONMENTAL POLICY 37–88 (1998).
11
context of situational and individual pushes/pulls toward illegal behavior. In Part II of this Article, we describe the regulatory context and review previous research on environmental noncompliance. We focus particularly on organizational and individual factors that increase the risk of crime. In Part III, we describe the current research design and research participants. Part IV contains our analysis and results. We conclude, in Part V, with a discussion of the findings, particularly their implications for successful regulatory regimes.
II.PRIOR LITERATURE
A.REGULATORY STRATEGIES AND CORPORATE OFFENDING
Regulatory strategies often overlap. Regulatory instruments and institutions are interconnected,12 and some strategies, such as responsive regulation, are built around the argument that “regulatory policy should take neither a solely deterrent nor a solely cooperative approach.”13
Although it is somewhat simplistic to classify regulation into distinct types,14 Gunningham, Grabosky, and Sinclair argue that it is useful to examine both the prevention and control capacities of different regulatory strategies given that “a particular instrument which may appear attractive, when looked at on its own, may work quite differently when introduced alongside others.”15
Below, we identify the key components of two regulatory strategies (command-and-control and self-regulation) and highlight how each is expected to or has been shown to affect corporate crime prevention and control.16 In addition, we discuss the important role
12
See GUNNINGHAM ET AL., supra note 10, at 37–38.
13 Vibeke Lehmann Nielsen & Christine Parker, Testing Responsive Regulation in Regulatory Enforcement, 3REG.&GOVERNANCE 376, 376 (2009).
14 See I
AN AYRES &JOHN BRAITHWAITE,RESPONSIVE REGULATION:TRANSCENDING THE DEREGULATION DEBATE 17–18 (1992).
15
GUNNINGHAM ET AL., supra note 10, at 132.
16
of informal sanctions either as a control mechanism that can be triggered by command-and-control interventions or as complementary with self-regulatory strategies.
1.Command and Control
In command-and-control strategies, legal authorities dictate the terms of compliance, relying on the threat of formal legal sanctions to achieve compliance with those terms.17 High detection risk coupled with certain and severe punishments should deter most offenders. Empirically, however, the story is more complicated than this. Some research supports the contention that punitive sanctions affect firm and plant behavior, but findings overall are mixed. Cohen, for instance, finds that Coast Guard inspections and monitoring reduce spills at the firm level (a general deterrence effect) and that the frequency of inspection is more important than sanction severity.18 Simpson, Garner, and Gibbs find little evidence that sanctions of any type (e.g., inspections, informal or formal interventions) associated with Clean Water Act enforcement inhibit reoffending (i.e., specific deterrence).19 Plant-level studies more consistently show a specific deterrence effect associated with Environmental Protection Agency (EPA) monitoring and enforcement, and a recent review of the empirical literature on enforcement, conducted by Gray and Shimshack, finds both specific and general deterrence associated with environmental monitoring and enforcement.20
specific mechanisms associated with two regulatory strategies affect the way managers think and may behave. In this regard, our work helps to fill an empirical deficit noted by Hutter and Jones:
We know that the sources of regulation and risk management are diversifying, as are the tools and techniques employed to manage and regulate risks. What we do not have is much empirically informed research about the range of sources influencing the business world and in particular the weighting of influence exercised by them.
Hutter & Jones, supra, at 1.
17 See Clifford Rechtschaffen, Deterrence vs. Cooperation and the Evolving Theory of Environmental Enforcement, 71 S.CAL.L.REV. 1181, 1187–90 (1998).
18 Mark A. Cohen, Empirical Research on the Deterrent Effect of Environmental Enforcement and Monitoring, 30 ENVTL.L.REP. 10245, 10246 (2000).
19
See SALLY S.SIMPSON ET AL.,WHY DO CORPORATIONS OBEY ENVIRONMENTAL LAW? ASSESSING PUNITIVE AND COOPERATIVE STRATEGIES OF CORPORATE CRIME CONTROL 2 (2007), available at https://www.ncjrs.gov/pdffiles1/nij/grants/220693.pdf.
20 See generally Cohen, supra note 18, at 10246 (providing evidence that environmental
Scenario-based survey research, which largely focuses on environmental and other forms of corporate offending (e.g., bribery, sales fraud, price-fixing), shows that current and prospective managers report reasonably high expectations that corporate crimes will be discovered by legal authorities and that ensuing sanctions will be costly, particularly when individuals (as opposed to the company) are targeted.21 Thus, command-and-control strategies based on discovery and punishment should lower corporate offending. But once again, the relationship is far from straightforward. In one study, threats of formal sanctions are mediated through individual characteristics such as morality22 and outcome expectations.23 Formal punishments are less relevant once informal consequences are included in the analysis.24
2.Self-Regulation
Self-regulatory approaches (typically offered as a complementary strategy in conjunction with government-enforced regulation) presume that prosocial norms and values coupled with effective internal compliance systems (e.g., clear accountability, communication of expectations, effective monitoring, and appropriate reprimands when violations occur) will secure compliance.25 Braithwaite’s “family model” of self-regulation
The Effectiveness of Environmental Monitoring and Enforcement: A Review of the Empirical Evidence, 5 REV.ENVTL.ECON.&POL’Y 3 (2011) (providing a summary of the empirical literature on the impact of environmental monitoring and enforcement on plant/facility-level compliance); Benoît Laplante & Paul Rilstone, Environmental Inspections and Emissions of the Pulp and Paper Industry in Quebec, 31 J.ENVTL.ECON.&MGMT.19 (1996) (discussing how both the inspection and threat of inspection have a strong negative impact on plant-level pollution emissions); Wesley A. Magat & W. Kip Viscusi, Effectiveness of the EPA’s Regulatory Enforcement: The Case of Industrial Effluent Standards, 33 J.L.&ECON. 331 (1990) (discussing how water pollution inspection and enforcement have a strong effect on pollution and rates of compliance); Louis W. Nadeau, EPA Effectiveness at Reducing the Duration of Plant-Level Noncompliance, 34 J. ENVTL. ECON. & MGMT. 54 (1997) (explaining that the EPA is effective at reducing the length of time plants are out of compliance).
21
See SALLY S.SIMPSON,CORPORATE CRIME,LAW, AND SOCIAL CONTROL 35–44 (2002).
22
See Raymond Paternoster & Sally Simpson, Sanction Threats and Appeals to Morality: Testing a Rational Choice Model of Corporate Crime, 30 LAW &SOC’Y REV. 549, 554 (1996).
23
See N. Craig Smith, Sally S. Simpson & Chun-Yao Huang, Why Managers Fail to Do the Right Thing: An Empirical Study of Unethical and Illegal Conduct, 17 BUS.ETHICS Q. 633, 638–39 (2007).
24
See Lori A. Elis & Sally S. Simpson, Informal Sanction Threats and Corporate Crime: Additive Versus Multiplicative Models, 32 J.RES.CRIME &DELINQ.399, 414–17 (1995).
25
rejects the economically rational conception of the firm and its managers found in command-and-control approaches to crime control.26 Instead, company self-regulation also accounts for the notion of organizational social responsibility and the prosocial norms and ethical values of company managers. Thus, managers’ perceptions of the ethical climate of a firm should affect their own offending intentions.
Evidence suggests that managers who believe that the corporate culture is tolerant of illegality are more likely to violate regulations.27 Similarly, a recent meta-analysis found that ethics codes supported and enforced by top management have a positive, significant effect on ethical decisionmaking and conduct within companies.28 Research also indicates that a positive compliance culture at the firm level may be transmitted from a parent company to the plant level.29
3.Informal Sanctions
Informal sanctions (e.g., extralegal costs) are regulatory levers associated with both firm self-regulation and command-and-control strategies, depending on the mechanism that inhibits crime. Negative publicity is a case in point. Multiple sources of negative publicity can affect corporate (and manager) actions or outcomes, including: environmental activism,30 mandatory firm disclosure,31 or formal charges.32 Generally, studies support the notion that bad environmental news affects a firm’s reputation and market performance. However, the literature is mixed as to when in the legal process reputational damage is most salient (notice of pending charges, case announcement, processing, or case resolution);33
26
See BRAITHWAITE, supra note 8, at 133–40.
27
See Paternoster & Simpson, supra note 22, at 556. In addition, managers with lower ethical standards and managers ordered to do so are more likely to violate regulations. See
SIMPSON, supra note 21, at 41–42.
28 Natalie Marie Schell-Busey, The Deterrent Effects of Ethics Codes for Corporate
Crime: A Meta-Analysis 85 (2009) (unpublished Ph.D. dissertation, University of Maryland, College Park) (on file with Digital Repository at the University of Maryland, College Park).
29
See Gray & Deily, supra note 20, at 100.
30
See Neil Gunningham et al., Social License and Environmental Protection: Why Businesses Go Beyond Compliance, 29 LAW &SOC.INQUIRY 307, 318, 322 (2004); Robert A. Kagan et al., Explaining Corporate Environmental Performance: How Does Regulation Matter?, 37 LAW &SOC’Y REV. 51, 71–72 (2003).
31
See Shameek Konar & Mark A. Cohen, Information As Regulation: The Effect of Community Right to Know Laws on Toxic Emissions, 32 J.ENVTL.ECON.&MGMT. 109, 110 (1997).
32
See Wallace N. Davidson III et al., Stock Market Reactions to Announced Corporate Illegalities, 13 J.BUS.ETHICS 979, 985 (1994).
whether stock prices are differentially responsive to civil, criminal, or regulatory moving agents;34 or even if negative stock reactions are best understood as “reputational” costs delivered by the market or costs primarily imposed by the legal community.35
When reputational damages stem mainly from formal legal proceedings, this can be seen as part of a deterrence strategy. However, informal sanctions also impose stigmatic, commitment, and attachment costs for managers who violate the law.36 These effects may be a direct consequence of formal sanctions37 or completely unrelated to formal proceedings. In a study of corporate offending intentions, Elis and Simpson found inhibitory effects associated with the certainty of internally imposed informal sanctions (shame) and externally imposed informal sanctions (loss of respect from family, friends, and business associates).38 Importantly, the threat of both individual and firm reputational damage had an inhibitory effect. But these effects were independent of and tended to trump formal sanction risks (which were relatively unimportant sources of deterrence).
Although the literature is slim and contradictory, there is evidence that firm-level stigmatic consequences trickle down to responsible managers.39 In a study of all SEC and DOJ enforcement actions brought between January 1978 and September 2006 against 788 firms in which financial misrepresentation occurred, Karpoff, Lee, and Martin report that 93% of all executives and 96% of other employees identified as legally responsible for the behavior were fired “for reasons that are directly related to their misconduct.”40 Job loss was more likely when misconduct was particularly costly to shareholders and when offenders faced strong governance
34
See Bruce Mizrach & Susan Zhang Weerts, Does the Stock Market Punish Corporate Malfeasance? A Case Study of Citigroup, 3 CORP. OWNERSHIP &CONTROL 151, 153–54 (2006) (serving as an example of how reputational consequences can flow from different moving agents).
35 See Jonathan M. Karpoff et al., The Reputational Penalties for Environmental Violations: Empirical Evidence, 48 J.L.&ECON.653, 665–68 (2005).
36
See Raymond Paternoster, The Deterrent Effect of the Perceived Certainty and Severity of Punishment: A Review of the Evidence and Issues, 4 JUST.Q. 173, 210 (1987) (citing Kirk R. Williams & Richard Hawkins, Perceptual Research on General Detterence: A Critical Review, 20 LAW &SOC’Y REV. 545, 568 (1986)).
37
See Kirk R. Williams & Richard Hawkins, The Meaning of Arrest for Wife Assault, 27 CRIMINOLOGY 163, 166 (1989).
38
See Elis & Simpson, supra note 24, at 410–11.
39
See Cindy R. Alexander, On the Nature of the Reputational Penalty for Corporate Crime: Evidence, 42 J.L.&ECON.489, 523 (1999); Jonathan M. Karpoff et al., The Cost to
Firms of Cooking the Books, 43 J.FIN.&QUANTITATIVE ANALYSIS 581, 605–07 (2008).
40
structures.41 From this literature, we expect that command-and-control as well as self-regulatory strategies will benefit from accounting for the informal stigmatic costs to the individual.
B.RISK FACTORS FOR CORPORATE OFFENDING
There are many different empirically identified “risk factors” for corporate crime. These factors are important in our study because effective regulation should minimize the likelihood of criminal behavior in the face of pressures and predilections. Below, we summarize some of the known risk factors for corporate environmental crime with the caveat that many of these same risk factors also are associated with offending by companies more generally.
Looking first at firm characteristics, some research has found financial strain (measured in different ways) to significantly increase the likelihood that firms, plants, and managers will violate environmental laws and/or increase pollution levels.42 In vignette studies specifically, after controlling for individual-level predictors, managers are significantly more likely to engage in price-fixing, bribery, fraud, or EPA violations if the act will give the organization an edge over foreign competition or the act will result in substantial savings for the firm.43 When firm profits are slowing or declining, managers and employees may resort to criminal practices to attain performance goals.44
In other studies, however, firm profit either is unrelated to environmental (and occupational health and safety) violations45 or has a positive effect on offending.46 Simpson, for example, finds that managers’ intentions to offend were higher when the firm was depicted as growing its sales.47 Thus, offending may be related to both financial decline and
41
Id. at 194.
42 See C
LINARD &YEAGER, supra note 4, at 128–29; Cindy R. Alexander & Mark A. Cohen, New Evidence on the Origins of Corporate Crime, 17 MANAGERIAL &DECISION ECON. 421, 421 (1996); Kagan et al., supra note 30, at 51–90; Marie McKendall et al.,
Corporate Governance and Corporate Illegality: The Effects of Board Structure on Environmental Violations, 7 INT’L J.ORG.ANALYSIS 201, 203 (1999).
43
See Paternoster & Simpson, supra note 22, at 557–59.
44
See generally Neal Shover & Kevin M. Bryant, Theoretical Explanations of Corporate Crime, in UNDERSTANDING CORPORATE CRIMINALITY 141, 154 (Michael B. Blankenship ed., 1993).
45
See Charles W. L. Hill et al., An Empirical Examination of the Causes of Corporate Wrongdoing in the United States, 45 HUM.REL.1055, 1070–71 (1992).
46
See Marie A. McKendall & John A. Wagner, III, Motive, Opportunity, Choice, and Corporate Illegality, 8 ORG.SCI.624, 625–26, 638 (1997).
47
growth. Corporate observers suggest that a lack of predictability may underlie both of these situations, especially if the change is unexpected or rapid in nature.48
The literature also predicts a link between intra-organizational structures and offending. Within companies, decisions follow particular lines of communication and responsibility. Managers have shown a tendency to obey authority, even when ordered to behave unethically or violate the law.49 This is true especially for middle-level managers who are responsible for carrying out orders but who have relatively little decisionmaking authority vis-à-vis top management.50
Although organizational characteristics are often associated with corporate crime because they provide opportunity, context, or motivations for offending, as mentioned previously, managers—not companies—make decisions. Managerial decisions might be affected by individual norms51 and differences in traits such as impulsivity, hubris, desire for control, Machiavellianism, and self-serving bias.52 Although evidence on the link between corporate crime and low self-control53 is weak at best,54 empirical findings support an association between some of these other individual traits and illegality and/or other negative business outcomes.55
48
MICHAEL E. PORTER, COMPETITIVE STRATEGY: TECHNIQUES FOR ANALYZING INDUSTRIES AND COMPETITORS 324 (1980).
49
HERBERT C.KELMAN &V.LEE HAMILTON, CRIMES OF OBEDIENCE:TOWARD A SOCIAL PSYCHOLOGY OF AUTHORITY AND RESPONSIBILITY(1989).
50
See MARSHALL B. CLINARD, CORPORATE ETHICS AND CRIME:THE ROLE OF MIDDLE MANAGEMENT21–23(1983).
51
See Michael P. Vandenbergh, Beyond Elegance: A Testable Typology of Social Norms in Corporate Environmental Compliance, 22 STAN.ENVTL.L.J. 55, 63–67 (2003).
52 See Paul Babiak et al., Corporate Psychopathy: Talking the Walk, 28 BEHAV.SCI.&L.
174, 190 (2010).
53 SeeM
ICHAEL R. GOTTFREDSON &TRAVIS HIRSCHI, A GENERAL THEORY OF CRIME 180–201 (1990) (discussing white-collar crime); Travis Hirschi & Michael Gottfredson, The Significance of White-Collar Crime for a General Theory of Crime,27 CRIMINOLOGY359, 360–62 (1989).
54
See WEISBURD ET AL., supra note 4, at 187–88; Michael L. Benson & Elizabeth Moore, Are White-Collar and Common Offenders the Same?: An Empirical and Theoretical Critique of a Recently Proposed General Theory of Crime, 29 J.RES.CRIME &DELINQ. 251, 260–63 (1992); Sally S. Simpson & Nicole Leeper Piquero, Low Self-Control, Organizational Theory, and Corporate Crime, 36 LAW &SOC’Y REV. 509, 531–33 (2002).
In sum, the body of evidence regarding the specific levers of corporate crime control is limited and inconclusive. Importantly, little is known about how effective different regulatory strategies or components are in the context of known or suspected risk factors—both organizational and individual. To address this issue, we rely on data drawn from a factorial survey administered to two samples of corporate employees. The first sample includes corporate managers recruited as part of a National Institute of Justice (NIJ)-funded study on corporate environmental noncompliance. The second sample includes employees of public and private companies, drawn from a broader sample of the population. Both sets of participants responded to web-based surveys that depicted two hypothetical scenarios designed to assess individuals’ propensity to engage in significant pollution violations (e.g., discharging toxins into waterways) and less serious environmental offenses (e.g., ignoring an EPA compliance order).
III.METHODS
Factorial surveys combine experimentally manipulated hypothetical scenarios (vignettes) with survey questions to measure respondents’ intentions, decisions, attitudes, or judgments.56 These designs, unlike more traditional survey techniques, allow researchers to manipulate a full range of circumstances that may affect a decision—essentially taking into account “the complexity and richness in the way people approach decisions and evaluations.”57
The design also avoids some of the temporal ordering and perceptual instability problems associated with other research designs.58 Vignette surveys can be less threatening methods of data collection than self-report surveys when the subject matter is sensitive, such as when respondents are queried about unethical, criminal, or deviant behavior. Although vignettes have been used extensively in the social sciences59 and
56
See PETER HENRY ROSSI &STEVEN L. NOCK, MEASURING SOCIAL JUDGMENTS 9–13 (1982).
57
Edward D. Weber et al., The PC Vignette Generating Program (1988) (on file with the University of Massachusetts Social and Demographic Research Institute, Amherst, MA).
58
See Linda Saltzman et al., Deterrent and Experiential Effects: The Problem of Causal Order in Perceptual Deterrence Research,19 J.RES.CRIME &DELINQ.172, 174 (1982).
59
In criminology, vignette studies were used to evaluate the appropriateness of corporate crime punishments, see Joan L. Miller et al., Felony Punishments: A Factorial Survey of Perceived Justice in Criminal Sentencing, 82 J.CRIM. L.&CRIMINOLOGY 396, 396–415 (1991); public perceptions of white-collar crime seriousness, see James Frank et al.,
business to collect useful information about topics such as survey participation60 and consumer preferences,61 they also have some drawbacks. Critics have raised concerns about: the link between reported intentions and actual behavior and whether the relationship is sensitive to the respondent’s sex and the situation analyzed;62 the extent of social desirability bias in responses, especially in the constant-variable value vignettes where all respondents read identical scenarios;63 whether there are “order” effects;64 and whether scenario-based research is valid and reliable;65 among other issues. Poorly considered dimensions and components of the scenarios contribute to validity problems.
In this study, to increase data validity, we draw extensively from the empirical and theoretical literatures to identify relevant attributes and levels for the vignettes. We also asked environmental professionals and people in business to review drafts of the vignettes and the instrument was revised accordingly.66 We experimentally rotated vignette items within the scenario dimensions to lessen social desirability bias. To minimize the biasing effect of vignette order, we randomly allocated items to respondents and asked them to imagine themselves in the position of the vignette actor.67 Order effects are more likely when respondents have little
445 (1997); Paternoster & Simpson, supra note 22, at 558; N. Craig Smith et al., supra note 23, at 645.
60 See Robert M. Groves et al., A Laboratory Approach to Measuring the Effects on Survey Participation of Interview Length, Incentives, Differential Incentives, and Refusal Conversion, 15 J.OFFICIAL STAT. 251 (1999).
61 See Alice Grønhøj & Tino Bech-Larsen, Using Vignettes to Study Family Consumption Processes, 27 PSYCHOL.&MARKETING 445 (2010).
62 See Stefanie Eifler, Evaluating the Validity of Self-Reported Deviant Behavior Using Vignette Analyses,41 QUALITY &QUANTITY 303, 306–10 (2007); M. Lyn Exum et al, Self-Reported Intentions to Offend: All Talk and No Action?, 37AM.J.CRIM.JUST.523, 534 (2011).
63
See generally Gerald. F. Cavanaugh & David J. Fritzsche, Using Vignettes in Business Ethics Research, in 7 RESEARCH IN CORPORATE SOCIAL PERFORMANCE AND POLICY 279–93 (Lee E. Preston ed., 1985); Maria F. Fernandes & Donna M. Randall, The Nature of Social Desirability Response Effects in Ethics Research, 2 BUS.ETHICS Q. 183 (1992).
64
See Katrin Auspurg & Annette Jäckle, First Equals Most Important?: Order Effects in Vignette-Based Measurement 19–20 (Inst. for Soc. and Econ. Research, Working Paper No. 2012-01).
65 See Stefanie Eifler, Validity of a Factorial Survey Approach to the Analysis of Criminal Behavior, 6 METHODOLOGY 139, 140 (2010); James Weber, Scenarios in Business Ethics Research: Review, Critical Assessment, and Recommendations, 2 BUS. ETHICS Q. 137, 145–46 (1992).
66
See Kelly D. Wason et al., Designing Vignette Studies in Marketing, 10 AUSTRALASIAN MARKETING J. 41, 53 (2002).
67
knowledge or care little about the topic.68 Our study explicitly sampled environmental experts (discussed below), and we asked respondents to report on their experiences with and attitudes about depicted behaviors as part of the survey. Although the jury is still out, research also has shown a reasonable correlation between reported intentions and behavior.69 Given the sensitive subject matter (corporate offending) as well as our attention to methodological concerns in the design of the instrument, we believe the factorial survey method is a reasonable and valid approach to our research question.
A.SCENARIO CONSTRUCTION
One of the first steps in factorial survey construction is to determine the “domain” of the judgment or decision. The vignette domain consists of dimensions believed to affect the manager’s decision to engage in corporate offending. Guided by a modified rational choice theory70 and the corporate crime empirical literature, a number of pushes and pulls toward crime at the individual and corporate level are incorporated into the vignette design. Scenarios are created from rotated elements or levels within dimensions. To illustrate, the firm’s environmental constraints (one dimension) provide contextual information to the respondent about the economic environment in which the company is conducting its business. The type of constraint (e.g., the industry is losing ground to foreign competitors, the industry is economically healthy, the industry is economically deteriorating) is randomly assigned to each scenario. Further, management level is an intra-organizational dimension empirically linked to offending decisions. Pressures on middle managers to achieve corporate goals—often with the implicit message “by any means necessary”71—
and unrealistic performance metrics72 create a greater likelihood of corporate crime by midlevel managers compared with top management (who generally set company goals and strategies for others to achieve). Research has also found that managers adhere to authority structures within firms.73 The probability of
68
Auspurg & Jäckle, supra note 64, at 1.
69
See Greg Pogarsky, Projected Offending and Contemporaneous Rule-Violation: Implications for Heterotypic Continuity, 42 CRIMINOLOGY 111, 115 (2004); Harry Telser & Peter Zweifel, Validity of Discrete-Choice Experiments Evidence for Health Risk Reduction, 39 APPLIED ECON.69, 72–75 (2007).
70
See Paternoster & Simpson, supra note 22, at 553–57. 71
CLINARD, supra note 50, at 22–23.
72 John Braithwaite, White-Collar Crime, Competition, and Capitalism: Comment on Coleman, 94 AM.J.SOC. 627, 629 (1988).
73
corporate crime is higher for those managers affirmatively instructed to break a given rule. Thus, we varied the “locus of control” in the scenarios based on whether or not the employee was ordered by a superior to commit the offense. Finally, the ethical tone and culture of a company can affect how managers perceive corporate crime (as acceptable or not) which, in turn, may increase or decrease the anticipated rewards/costs of offending. Dimensions that rotate levels of managerial ethics, firm volunteerism, and internal compliance systems also are randomized within the scenarios. The specific dimensions of interest (and randomized levels within each) for this Article are listed in Appendix I.
The survey instrument contains two “offending” vignettes. One noncompliance scenario describes a technical violation (e.g., failure to act/comply with an environmental agency’s order) with no indication of whether it will affect pollution levels. The other depicts a more substantial pollution event (the intentional release of a toxic substance into a local waterway) that exceeds permitted levels by 200%. Sample scenarios can be found in Appendix II. The vignettes are followed by a series of questions that relate to a specific scenario, general questions that measure respondents’ opinions and beliefs, and requests for demographic/work information about the respondent and his/her current employer.
B.SURVEY ADMINISTRATION
As noted previously, the factorial survey was first pretested, redesigned, and then vetted with environmental scholars, regulators, and executives. The instrument was modified to address any remaining concerns and adopted to be administered using a web-based Internet site. Data collection occurred in two waves. The survey first was administered in companies that were part of a larger NIJ-funded grant.74 The original research assessed patterns of environmental offending and company responses to governmental interventions (regulatory, civil, or criminal). An additional goal was to look inside the black box of the corporation by studying managers’ perceptions of corporate environmental crime and learn about their decisionmaking processes. All firms (whether participants in the vignette survey or not) were drawn from a sample of U.S.-owned companies in three basic manufacturing industries (steel, pulp and paper, and oil refining). These firms owned manufacturing sites that were designated by the EPA as “major” facilities.75 Of the forty-eight firms
853 (1997).
74
See SIMPSON ET AL., supra note 19.
75 Whether a facility is deemed “major” or not is determined by the facility’s volume and
contacted to participate in this study, only three companies agreed to send the survey out to their employees. Due to technical difficulties associated with survey administration, one firm asked to withdraw from the project after data had been collected. Thus, respondents for the study are concentrated in two participating companies—one in the steel industry and the other in pulp and paper.
The low rate of participation raises concerns of bias in the data. For example, if ethical firms were more likely to participate, our results may underestimate the likelihood of offending and the relationship between it and key independent variables. To assess potential bias, we compared each participating company’s average size (number of facilities owned, number of employees), market value (total stockholders’ equity), compliance (total violations, violation rate per number of facilities), and enforcement record (total sanctions, total inspections, inspection rate per number of facilities) to the seventy-one nonparticipants.76 The values for each company were taken by averaging six years of data (1995–2000). We do not provide significance tests due to the small sample size for participants (N = 2). One participating company is much larger and has a higher market value than the average company in the sample. It also has a better record of compliance, including a lower violation rate (.43 standard deviations below the mean for nonparticipating companies). The second participant is also somewhat larger than the average company, but has a record of compliance very similar to that of nonparticipating companies (.01 standard deviations below the mean for nonparticipating companies). Such firm-level variability gives us confidence that responding managers come from corporate environments with different environmental records—one better than and one comparable to the “typical” nonparticipating firm in the NIJ sample.
Fifty-four respondents from one company and sixteen participants from another reported on their willingness to engage in the noncompliant behaviors described in both scenario types, producing 140 scenarios. An additional fourteen participants reported their behavioral intentions for one
scenario. This produced 154 cases for potential analysis. After listwise deletion of independent variables, 126 cases from seventy respondents were included in the final analysis.77
Yeager, Industrial Water Pollution, 18 CRIME &JUST. 97, 122 n.37 (1993).
76
Seeinfra Appendix III, Table 1.
77
Recognizing that respondents in the NIJ study were drawn from a limited sample of large manufacturers, our goal in the second study was to target a broader set of business managers and gain a larger pool of respondents than in the first study.78 We also preferred potential respondents to have some knowledge about environmental statutes and compliance requirements. Accordingly we obtained a list of 7,292 environmental decisionmakers within a wide variety of organizations in the United States from TMone, a company that provides targeted databases for direct mail campaigns. The sampling frame list contained the individual’s name as well as information about the entity for which he worked, including the organization’s name, address, telephone number, and webpage (if applicable).
From December 2008 to March 2009, Vanderbilt University sent letters to potential respondents on the list indicating their selection for survey participation. The letters also provided a link to the web-based factorial survey. Of the 7,292 sent, 1,373 letters were returned as undeliverable, leaving us with a potential sample pool of 5,919. To increase response rates, Vanderbilt researchers sent out follow-up postcards about three weeks after the initial letter was sent (from January 2009 to April 2009). Seven hundred seventeen individuals logged into the survey site, for a response rate of about 12%.79 This response rate is not atypical of that seen in previous studies on web-based surveys.80 Low response rates
differences.
78
There were a few minor changes between the two survey instruments. When applicable, differences between items are noted in the text.
79 We received about thirty contacts from individuals about the surveys, including
reasons for participating or not participating in the survey. Most of the contacts who indicated they would not be responding to the survey mentioned a lack of technical proficiency or not owning a computer. Many who reported not owning a computer were also retired. Some mentioned that they simply were not interested or that they did not feel like they were appropriate respondents because of their current jobs or work experiences (e.g., did not see themselves as environmental experts). We provided technical assistance to individuals who wanted to respond to the survey but had trouble accessing the website, and encouraged those who felt they were inappropriately contacted to respond with the understanding that we would consider their job description and experience when interpreting results.
80
do not necessarily equate to nonresponse bias. If respondent characteristics are similar to nonrespondent characteristics, then the survey responses can reasonably be attributed to the larger target sample.81 To assess nonresponse bias, we took a random sample of 500 individuals from the 5,919 who received the invitation to participate. For each of these 500 people, we gathered additional information regarding the type of organization (publicly or privately owned corporation, government agency, NGO or civic association, law firm, private consulting firm, or other) and the type of profession (environmentally related or not), the size of the entity, and the gender of the individual. As shown in Appendix III (Table 2), we compared respondents to nonrespondents on these four dimensions, and found that the only significant difference between the two groups was organization size. Respondents came from slightly larger organizations (mean = 14.04 employees) than nonparticipants (mean = 9.59 employees).82 However, the similarities on the other dimensions suggest nonresponse may not be a major problem. Even so, we are cautious with our interpretation and extrapolation of findings.
C.RESPONDENT INFORMATION
Merging the two sets of respondents yields a total of 237 scenarios from 161 individuals.83
feel that data integrity is not secure, and technical issues may affect responsivity. See id. at 254–56; Linda J. Sax et al., Assessing Response Rates and Nonresponse Bias in Web and Paper Surveys, 44 RES.HIGHER EDUC. 409 (2003).
81
Sax et al., supra note 80, at 409–32.
82 The range on this variable is 1 to 370 employees. Although statistically significant,
we question whether this is a meaningful difference. Both means are on the small side and if we round 9.59 up to 10, both responders and nonparticipants fall within the same business size classification according to the U.S. Census. Statistics About Business Size, U.S.CENSUS BUREAU (Aug. 22, 2012),http://www.census.gov/econ/smallbus.html.
83
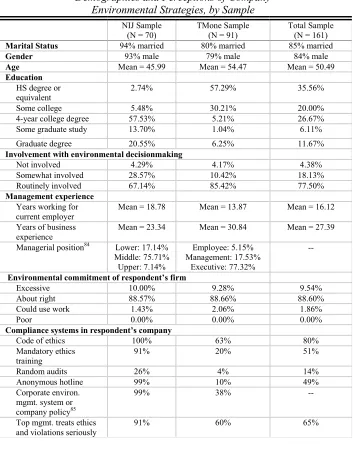
Table 1
Demographics and Perceptions of Company Environmental Strategies, by Sample
Marital Status 94% married 80% married 85% married
Gender 93% male 79% male 84% male
As reported in Table 1, the average respondent is about fifty years of age. Most are married (85%) and male (84%), and a substantial majority attended college or graduate school (64%). They are experienced and loyal workers, with an average career length of twenty-seven years, sixteen of which have been with their current employer. About 78% report being routinely involved with environmental decisionmaking in their respective companies. Most respondents have a positive assessment of their firms’ ethical commitments. Sixty-five percent of the respondents report that top management treats ethics and violations seriously, and 89% report that the environmental commitment of their firm is just right. There is more variation in the kinds of ethics training and compliance systems utilized by their firms. About 80% of respondents report the presence of a code of ethics in their workplace, 51% report mandatory ethics training, 14% report random audits, and 49% report an anonymous hotline.86
D.MEASURES
1.Dependent Variable
After reading each scenario, respondents were asked to rate how likely they were to act like the manager in the scenario (0 = no chance at all to 10 = 100% chance), who in both scenarios always engages in noncompliant behavior. Therefore the dependent variable measures the respondent’s willingness or intention to act illegally. Intentions are not distributed equally across vignette types; individuals were much less likely to offend when given the “significant noncompliance” scenario than when they were given the “technical noncompliance” scenario. Specifically, in the 113 EPA-order-defiance scenarios, 57.5% (N = 65) of the respondents reported no chance of offending. In comparison, 102 out of the 124 (82.3%) of the respondents to the toxic-release scenario reported no chance of offending.
86
This seems fairly typical for major corporations. A recent LRN ethics study, for instance, found eight out of ten employees reporting that their organization has a written code of conduct or ethics. Moreover, a large percent (83%) also say that their management “genuinely” wants to promote integrity and ethics in the organization. LRNCORP., THE IMPACT OF CODES OF CONDUCT ON CORPORATE CULTURE 3 (2006), available at
http://www.ethics.org/files/u5/LRNImpactofCodesofConduct.pdf. The code of ethics or code of conduct is the most common part of the compliance infrastructure and hotlines are also fairly common. Highly regulated industries tend to have more detailed compliance structures. DONNA BOEHME, FROM ENRON TO MADOFF: WHY MOST CORPORATE COMPLIANCE AND ETHICS PROGRAMS ARE POSITIONED FOR FAILURE 28 (2009), available at
Combined, 167 out of the 237 (70.5%) scenarios in the total survey had a “no chance of offending” outcome reported. 87
Given the obvious positive skew on offending overall as well as by scenario type, we recoded the dependent variable to a binary outcome (0 = unwilling to act like the manager in the scenario; 1 = 10% or more chance of acting like the manager in the scenario and engaging in illegal behavior).88
2.Independent Variables
The independent variables can be sorted into three main categories: relevant control variables, individual/corporate risk factors for offending, and variables that capture some aspect of regulation (command-and-control, firm self-regulation). Variables are drawn from the vignettes themselves,89 questions that follow each survey, and demographic information reported by respondents. Each class of variables is described briefly below.
i. Controls
Although there are a number of potential control variables to include in this analysis, we focused primarily on variables that had a significant bivariate relationship with the dependent variable90 or affected offending intentions in preliminary analyses, once other variables were included in the models. Questions ask respondents to assess scenario realism (0 = not realistic, 1 = realistic) and to rate the desirability of the behavior (0 = not at all desirable to 10 = very desirable) and how likely the manager’s actions were to endanger human life and wildlife (0 = no chance at all to 10 = 100% chance). We also included measures that controlled for: (1) the respondent’s years of business experience; (2) whether the respondent had personally experienced or knew about any of the offense types presented;91
87
Onlypeople with no missing data are included in our analysis. Consequently, we do not lose any cases across models.
88 Alternative coding strategies for the dependent variable (0–10) and analyses (OLS and
Tobit) were conducted to assess whether the binary coding scheme is defensible. Results are substantively the same as those reported with only minor observed differences (results available on request). Because our primary interest in this study is to determine whether certain interventions minimize the likelihood of offending, it made sense for us to truncate all positive responses into a binary 0/1 coding scheme.
89
Vignette characteristics entered into the models are dummy variables scored as 1 if the characteristic was present in the scenario and 0 if it was not included. The choice of the reference category is determined by theory and ease of interpretation.
90
Seeinfra Table 2.
91
(3) scenario type (technical noncompliance versus release of toxins); and (4) whether the respondent was part of the NIJ sample (coded as 1) or the TMone sample (coded as 0).
ii. Risk Factors
Individual-level factors
The corporate crime literature has identified several individual-level characteristics that might confound the relationship between prevention-and-control strategies and offending intentions. Our respondents were asked several questions that tap into some of these attributes. Personal self-interest was measured by two questions about perceived career benefits from the crime (crude measures of Machiavellianism) and the level of excitement associated with illegal behavior (respondents rated both on 11-point scales where higher scores indicated greater perceived benefits).92 We expect that respondents who perceive more career benefits and greater thrills will report higher offending intentions. The risk of crime also should be greater when managers do not believe in the common value system represented by the law. Social control theory, for instance, asserts “there is
variation in the extent to which people believe they should obey the rules of society . . . . [T]he less a person believes he should obey the rules, the more likely he is to violate them.”93
To examine this, we asked respondents their degree of agreement with the following statement: “Individuals should comply with the law so long as it does not go against what s/he thinks is right.” Agreement with such a statement suggests that the respondent does
not share conventional attitudes about the moral authority of law and is therefore at greater risk for offending.
Company-level factors
Risks associated with the company are captured in two types of measures: economic constraints on the firm and managerial position and authority. In the vignettes, respondents assessed scenario conditions
vignettes the NIJ sample had personal experience with or knew about. Thus, for both samples, this variable reflects personal experience or knowledge about any of the environmental situations presented, including overcompliance scenarios (not discussed in this paper). Although the NIJ sample is more likely to report having personal experience/hearing about these behaviors (mean = 0.896) than the TMone sample (mean = 0.577), this result may be due to the more inclusive nature of the NIJ question than a true difference in personal experience.
92 The distribution of the “perceived thrills” variable is skewed to the right, with 197 out
of 237 responses at 0 (out of a possible 10). The mean of this variable is 0.43. We examined all six models using a dichotomous version of the variable, but results were substantively the same. We therefore report the results using the full 10-point scale.
93
wherein the firm was depicted as economically deteriorating, economically healthy, or losing ground to foreign competition. In addition, research has shown that a manager’s location within the company affects offending risk as pressures are often placed on middle managers to meet performance goals regardless of whether these goals can be achieved within the constraints of the law. Similarly, offending risks are also tied to whether managers are in a position to compel others to act illegally. So manager level (middle and upper) and decisionmaking authority (asked by supervisor to act versus made an independent decision) are included as company risk factors; both variables are drawn from the hypothetical scenarios.
iii. Regulation
Firm Self-Regulation
Several vignette dimensions are important indicators of company self-regulation. For example, scenarios contained information about whether the depicted company participated (or not) in voluntary EPA pollution-reduction programs; the kind of internal compliance system at the firm (a range from mandatory training through mandatory self-reporting of releases); whether ethics typically guide decisionmaking in the firm; and the consequences for managers who were discovered by the company to be behaving in similar activities (graduated consequences from no consequence at all to the employee was fired).
Informal Sanction Risk
We also created a standardized scale that takes into account the perceived certainty and severity of three business-related informal sanctions directed at the individual. Variables include the perceived likelihood and cost of losing the respect of business associates, loss of job, and future harm to job prospects if the behavior was discovered informally. This scale also incorporates a measure of respondents’ perceptions regarding the likelihood that their actions would be discovered by the firm but not by legal authorities.94
Command and Control
After each scenario, respondents were asked to evaluate the adequacy
94
(0 = too strict to 10 = too lenient) of the laws governing the behavior described in the scenario.95 In addition, five questions focused on the respondents’ perceptions of the formal costs of offending for the individual actor. The responses to these five questions were combined to form a formal sanction scale.96 The scale takes into account both respondents’ perceptions of the likelihood that a given negative outcome (e.g., being arrested, sued, or investigated by a regulatory agency) will result from the manager’s actions (i.e., certainty) and how much of a problem the negative outcome would cause for the respondent (i.e., severity). Certainty (0 = no chance at all to 10 = 100% chance) and severity (0 = no problem at all to 10 = a very big problem) were measured on an 11-point scale.97
IV.ANALYSIS AND RESULTS
Table 2 reports on bivariate relationships between reported offending intentions and the key independent regulatory variables of interest.
95
Contradictory findings may emerge from this variable. Consistent with deterrence, the risk of offending should be low if law is perceived to be punitive. However, procedural justice and defiance theory would predict greater offending risk if law is perceived to be “overly strict,” since this may tap into perceptions that law is unfair and illegitimate. See
TOM R. TYLER, WHY PEOPLE OBEY THE LAW (1993); Lawrence W. Sherman, Defiance, Deterrence, and Irrelevance: A Theory of the Criminal Sanction, 30 J. RES. CRIME & DELINQ. 445 (1993).
96
The construction of these scales is discussed in more detail (as are other variables) in Appendix IV.
97
C
4. Realistic scenario 0.079 -0.080 0.133 * 1
5. Desirability of behavior 0.310 *** -0.216 *** -0.072 0.123† 1
6. Yrs. of business experience -0.053 -0.009 -0.054 -0.026 0.084 1
7. Personal experience -0.027 -0.051 -0.005 -0.132 * -0.011 -0.088 1
8. Asked 0.142 * 0.011 -0.010 -0.033 -0.032 -0.009 0.042 1
9. Foreign competition -0.021 -0.149 * -0.045 0.046 0.050 0.012 -0.030 0.016 1
10. Economically deteriorating -0.022 0.083 0.039 -0.051 -0.022 0.114† -0.017 -0.024 -0.474 *** 1
11. Advance Career 0.352 *** -0.131 * 0.069 0.326 *** 0.219 *** 0.072 -0.075 0.149 * -0.016 0.058 1
12. Thrill 0.290 *** 0.010 0.061 0.149 * 0.124 0.036 -0.009 0.127† -0.010 0.047 0.285 *** 1
13. Conditional Compliance 0.163 * -0.041 0.004 0.075 0.110 0.165 * -0.044 0.034 -0.041 0.098 0.256 *** 0.168 ** 1
14. Mid-level manager -0.030 -0.066 -0.023 0.114† 0.041 0.014 -0.070 -0.006 0.080 -0.011 -0.022 -0.059 0.067
15. Voluntary reduction -0.043 -0.006 -0.209 ** -0.086 0.017 -0.011 0.061 0.087 -0.072 -0.061 -0.158 * -0.069 -0.055
16. Ethics guide management -0.001 -0.105 -0.026 -0.075 0.031 -0.039 0.015 -0.063 0.019 0.052 0.012 0.037 -0.042
17. Ethics are distinct -0.010 0.028 -0.009 0.033 0.040 0.119† 0.021 -0.055 -0.014 0.004 0.006 -0.091 0.047
18. Random audits -0.043 0.116† 0.025 -0.034 -0.037 -0.014 0.016 0.080 -0.029 0.011 0.048 0.104 -0.019
19. Self-reporting -0.024 -0.044 -0.001 -0.005 -0.051 -0.116† -0.121 -0.083 0.050 -0.063 -0.015 -0.024 -0.038
20. Ethics training 0.134 * -0.108† -0.025 0.027 0.044 0.104 0.052 0.044 0.061 -0.064 0.150 * 0.034 0.130 *
21. Hotline -0.044 -0.030 -0.057 -0.016 -0.039 0.077 0.010 0.025 0.124† -0.038 -0.078 -0.063 -0.016
22. Fired 0.019 -0.106 -0.018 0.010 0.002 0.010 -0.135 * -0.029 -0.010 0.092 0.041 0.092 0.071
23. Reprimanded -0.137 * 0.060 0.022 0.048 -0.132 * 0.001 -0.027 -0.062 -0.010 -0.025 -0.145 * -0.074 0.011
24. Informal sanctions -0.386 *** 0.114† 0.315 *** -0.175 ** -0.214 *** -0.115† 0.093 -0.047 -0.002 0.002 -0.330 *** -0.087 -0.203 **
25. Formal sanctions -0.280 *** 0.227 *** 0.493 *** 0.002 -0.103 0.006 -0.017 0.031 0.016 0.082 -0.065 0.050 -0.124†
26. Adequacy of law -0.124† 0.072 -0.284 *** -0.263 *** -0.105 -0.065 0.052 -0.079 -0.072 0.028 -0.248 *** -0.164 * -0.218 ***
27. Original sample -0.115† 0.018 -0.170 ** -0.367 *** -0.115† -0.361 *** 0.368 *** 0.010 0.014 -0.059 -0.301 *** -0.179 ** -0.312 ***
Note: †<0.10, *p<.05, **p<.01, ***p<.001
†
256
SAL
LY
S
. SI
M
PSO
N
, ET
A
L.
[V
o
l.
10
3
†
†
†
†
† †
† †
†
† †
† †
† †
Note: †<0.10, *p<.05, **p<.01, ***p<.001
14 15 16 17 18 19 20 21 22 23 24 25 26
14. Mid-level manager 1
15. Voluntary reduction 0.011 1
16. Ethics guide management -0.069 -0.009 1
17. Ethics are distinct 0.063 -0.019 -0.514 *** 1
18. Random audits -0.066 -0.021 0.048 -0.146 * 1
19. Self-reporting -0.087 -0.083 0.058 -0.055 -0.259 *** 1
20. Ethics training -0.023 -0.103 -0.063 0.048 -0.274 *** -0.241 *** 1
21. Hotline 0.099 0.025 -0.070 0.077 -0.203 ** -0.178 ** -0.188 ** 1
22. Fired 0.104 -0.029 0.019 -0.052 0.103 -0.142 * -0.061 0.060 1
23. Reprimanded -0.013 -0.080 -0.065 0.021 -0.019 0.123 -0.090 -0.029 -0.518 *** 1
24. Informal sanctions -0.042 0.035 0.075 -0.076 0.103 0.017 -0.098 0.024 0.003 0.042 1
25. Formal sanctions -0.020 -0.078 0.085 -0.062 0.099 -0.087 -0.018 -0.047 0.031 -0.044 0.498 *** 1
26. Adequacy of law 0.018 0.180 ** -0.037 0.118† 0.042 -0.022 -0.059 0.089 -0.111 0.112 0.103 0.020 1
27. Original sample -0.066 0.163 * 0.082 -0.055 0.046 -0.009 -0.011 0.041 -0.119 -0.043 0.314 *** -0.031 0.348 ***