Modeling the Social Resilience of Mountain
Communities under Volcanic Risks
A case study of Mt. Merapi
Saut Sagala
Graduate School of Engineering Kyoto University
Kyoto, Japan [email protected]
Norio Okada
Disaster Prevention Research Institute Kyoto University
Kyoto, Japan [email protected]
Douglas Paton
School of Psychology University of Tasmania
Launceston, Australia [email protected]
Abstract—Herein is modeled the social resilience of communities under volcanic risks. The model is based on causal-relationship factors that contribute to the development of social resilience in communities. Resilience in the model is measured by the variable ‘intention to prepare’ and is predicted by factors at personal, community and institutional level. The hypothetical model was then proposed and tested using data from communities living in the southern flanks of Mt. Merapi, Yogyakarta, Indonesia. Two significant results were obtained confirming that the social resilience of communities in the study area is mainly predicted by the community-level variables and institutional variables.
Keywords— community, social resilience, Mt. Merapi, volcanic risk.
I. INTRODUCTION
The authors analyze the causal-relationship factors that contribute to developing social resilience in a mountain community. Social resilience has become an important issue since it leads to a better understanding of how a system or a community can cope with and recover after the occurrence of an external shock as argued by Klein et al [1]. Identifying how the social resilience of a community works at an earlier stage will help the community and local government to make an emergency plan on what to do to increase resilience.
In this paper, the definition of social resilience refers to what proposed by Adger [2] as “the ability of groups or communities to cope with external stresses and disturbances as a result of social, political and environmental change”. This implies that social resilience includes how society adapts itself to the obstacles people face and increase their capacity to cope with future disasters. Different literature uses different terms which have similar meaning or share characteristics to social resilience, such as: ‘disaster preparedness’ proposed by Paton
et al [3,4] or ‘household adjustment’ suggested by Lindell and Whitney [5]. We maintain the use of the term social resilience as it gives broader meaning in dealing with such an issue.
To date, only limited studies have been conducted to understand social resilience issues in developing countries, for example a study by Adger et al [6]. In the case of a disaster or a conflict, many examples implicate delayed responses by local governments in developing countries as a source of risk. One reason for this is a lack of community capacity and infrastructure before a disaster occurs. One way to deal with this problem involves developing community resilience to deal with future disturbances. This study attempts to address this issue by identifying the main factors that affect and encourage people to be resilient. The study focuses on the concept of social resilience in contrast to other studies in the context of economic issues that have been examined by researchers in vulnerability issues [7]. Taking the communities living around Mt. Merapi as a case study, the authors apply the socio-psychological factors that might govern the social resilience of the community. The communities living around Mt. Merapi have developed capacities and adopted some ways for dealing with eruption consequences since they experience periodic volcanic eruptions [8,9,10].
Fig. 1 Schematic Hypothetical Structural Equation Model
II. RESEARCH FRAMEWORK
The authors analyzes how socio-psychological factors affect the social resilience of mountainous communities. It assumes that the quality of relationships between individuals, community and institutional mainly determine levels of resilience. This is being proposed as causal-relationship factors, presented in a structural equation model (SEM) and tested using a data set from Mt. Merapi case. As in any structural equation model, our aim is to develop a model that illustrates causal-relationship factors which include path diagram that illustrates how much a factor influence others in a structured model. Therefore, the model includes the definition of latent variables, observable variables, errors, residuals and path diagrams (Fig. 1). Our study deals with the socio-psychological factors and thus the variables are latent variables. The latent variables are then connected with the observable variable.
The main analysis for this study is conducted by use of an SEM. In our model, the SEM is composed of three large components of variables at individual (ξ6, ξ7), community (ξ4,
ξ5) and institutional levels (ξ2, ξ3). The meaning of the symbols
used for the hypothetical model used in Fig. 1 is presented in Table I.
The model proposes that several independent variables (ξ1
-ξ7 and their observable variables interact with each other to
predict the dependent variable (η1). The complete interactions
of the dependent variable, independent variables, and
observable variables are depicted in Fig. 1. Latent variables are not observable directly. As such, the unobserved variable is linked to one that is observable, thereby making its measurement possible [15]. For example, in Fig. 1 it is shown that ξ7 is linked with three observable variables x8-x10. Each
interaction is similar to an equation in a linear or multiple regression. Therefore in each interaction, there will be a dependent variable, independent variable(s) an error or residual. For example, the observable variable x8 can be defined as
follows:
x8 = γ8ξ7 + σ8 (1)
The dependent variable η1 can be described as follows:
η1 = β10ξ1 +β40ξ4 +β50ξ5 +β60ξ6 +β70ξ7 +ζ (2)
or (2) can be re-written as
IP = β10ISI + β40CE + β60POE + β70NOE + residual (3)
where IP, ISI, POE, NOE have each meaning respectively as listed in Fig 2 and Table II.
significance of all relationships. SEM can test the model as a whole and show how well the data fit the hypothesized model and the measurement goodness of fit index (GFI).
TABLE I. SYMBOLS AND MEANING IN THE HYPOTHETICAL MODEL
Symbol Meaning
η Endogenous latent variables
ξ Independent endogenous variables ζ Residual
θ Measurement errors
x Observed endogenous variables
y Observed exogenous variables
λ Path from endogenous latent variables to observed variables
γ Path from exogenous latent variables to observed variables
σ error
Social resilience in this model is measured using the ‘intention to prepare’ variable. This measure assumes ‘intention to prepare’ represents a proxy measure of the resilience of a society as proposed by Paton et al [3]. If one has motivation to prepare then he/she will be more likely to increase his/her resilience. The overall model works as causal relation factors that follow the sequences in Fig. 1. Symbols used in Fig. 1 and the relation with the model are defined in Table II. Therefore, the model can be drawn simply as Fig. 2.
The arrows illustrate the direction (originating from outcome expectancy) of the causal relationships between variables identified by the analysis. In this model, only the significant paths are shown and presented (p < 0.05). The goal of the SEM is to find non-significant differences between the estimated model and the actual data [11,12]. This difference is measured by the Chi-Square (χ2) value. The smaller the χ2 the better the model fits with the data.
The model starts by examining peoples’ beliefs about the efficacy of protective actions. This belief was assessed by using the measure of outcome expectancy (Fig. 2). Outcome expectancy can be in the form of ‘negative outcome
expectancy’ (NOE) or ‘positive outcome expectancy’ (POE). NOE illustrate beliefs that hazard consequences are too catastrophic for personal action to make any difference to peoples’ protection. Those who hold this belief will be unlikely to take action. On the contrary, POE can motivate people to prepare. However, a distinction can be drawn between the belief that preparing can be effective and knowing how to prepare. Accordingly, for people who hold positive outcome beliefs and possess the necessary knowledge and resources to prepare, they will act.
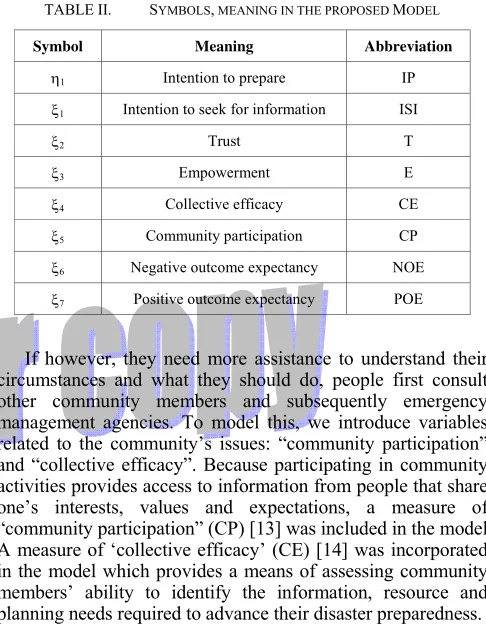
TABLE II. SYMBOLS, MEANING IN THE PROPOSED MODEL
Symbol Meaning Abbreviation
η1 Intention to prepare IP
ξ1 Intention to seek for information ISI
ξ2 Trust T
ξ3 Empowerment E
ξ4 Collective efficacy CE
ξ5 Community participation CP
ξ6 Negative outcome expectancy NOE
ξ7 Positive outcome expectancy POE
If however, they need more assistance to understand their circumstances and what they should do, people first consult other community members and subsequently emergency management agencies. To model this, we introduce variables related to the community’s issues: “community participation” and “collective efficacy”. Because participating in community activities provides access to information from people that share one’s interests, values and expectations, a measure of “community participation” (CP) [13] was included in the model. A measure of ‘collective efficacy’ (CE) [14] was incorporated in the model which provides a means of assessing community members’ ability to identify the information, resource and planning needs required to advance their disaster preparedness.
The other important variables are related with institutional levels: “empowerment” (E) and “trust”. Empowerment means citizens’ capacity to gain mastery over their affairs while being supported in this regard by external sources . It was measured using an empowerment indicator developed by Speer and Peterson [15]. ‘Trust’ (T) is assessed with a measure used in an earlier study of hazard preparedness [13]. As Lindell and Perry suggest [16], people who seek for information will be more likely to be motivated to prepare. Based on this assumption, this paper develops the relation between ‘intention to seek for information’ and ‘intention to prepare’. The dependent variable in the model was the intention to prepare.
All the independent and dependent variables above are set into a SEM (Fig. 2). The model suggests that people’s decision to prepare reflect the outcome of a sequence of activities. It is hypothesized that negative outcome expectancy beliefs will reduce the likelihood that people will form intentions to prepare. In contrast, it is hypothesized that positive outcome beliefs will motivate people to form intentions to prepare or
stimulate their engagement in collective activities (first with others in their community and then with formal sources) that culminate in their forming intentions to prepare. That is, it is felt that the community (community participation, collective efficacy) and formal (e.g., civic emergency planners and also NGOs in disaster management) institutional (empowerment, trust) factors will mediate the relationship between positive outcome expectancy and intention to prepare.
The overall model is expected to work as a sequential decision process from personal, community and institutional factors that interplay to affect people decision in preparing at personal level. In summary, the assumed model is shown in Fig. 2. Each path shows the hypothesized relationship between factors. The estimated ‘final’ model will illustrate only significant paths.
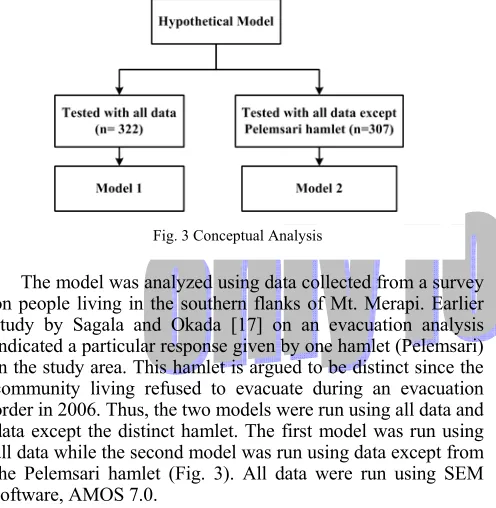
The model was analyzed using data collected from a survey on people living in the southern flanks of Mt. Merapi. Earlier study by Sagala and Okada [17] on an evacuation analysis indicated a particular response given by one hamlet (Pelemsari) in the study area. This hamlet is argued to be distinct since the community living refused to evacuate during an evacuation order in 2006. Thus, the two models were run using all data and data except the distinct hamlet. The first model was run using all data while the second model was run using data except from the Pelemsari hamlet (Fig. 3). All data were run using SEM software, AMOS 7.0.
III. CASE STUDY A. Sleman District
Merapi volcano is located at the northern part of Yogyakarta City, between Yogyakarta and Central Java Provinces. Several cities and regions, such as Yogyakarta City, Sleman, Magelang, Muntilan, Klaten and Boyolali, are located nearby this active volcano. Many hamlets and villages are located within the range of 4-10 km away from the top of the volcano. The study area is located at the southern flanks of the Merapi Volcano, the areas which were affected by the recent 2006 volcanic eruptions. The area belongs to the Sleman district and Pakem and Cangkringan Sub-districts.
B. Recent Disasters
Merapi has been very active within the last two decades. The records noted that the volcano previously erupted in 1994, 1997, 2001 and 2006 [10]. In term of numbers of people killed and eruption size, the eruptions in 1994 and 2006 were among the most dangerous. In 1994 Turgo hamlet was severely
affected by the eruption and at least 63 people died after the pyroclastic flow inundated the hamlet. Apart from the eruptions, secondary hazards includes landslides and lahars after rainfalls.
C. Surveys
The authors conducted a field survey from early January to mid February 2008. The survey included both structured and semi-structured interviews. The survey was conducted in fourteen hamlets, resulting in a total of 322 respondents. The structured interview collected data on observable variables used for the analysis. Semi-structured interviews were used to gather information on additional social issues. The questionnaire used in this paper refers to a study by Paton et al in New Zealand [3]. Details of the field survey refer to a parallel study on the evacuation decision in Mt. Merapi [17]. Most of the question is measured by a Likert Scale question.
IV. RESULTS
The results of the two models are summarized in Table III. The detailed of relationships in model 1 and model 2 are depicted in Fig. 4 and Fig. 5 respectively. The results of the model 1 is shown in left-hand side of the table while the results of the model 2 is shown in right-hand side. The model one indicates all paths from NOE are non-significant while one path from POE is non-significant. Non-significant paths are also found for some relationships originating from CE. The model 2 illustrates that all paths originating from individual level variables (outcome expectancy) are non-significant. In addition to that, the paths from CE to IP and CP to E are found non-significant. All the non-significant paths in both model are completely omitted in the ‘assumed’ model as indicated in Fig, 4 and Fig.5.
TABLE III. RESULTS OF MODEL 1 AND MODEL 2
Model 1 Model 2
Path S P value Estimate P value Estimate
POE Æ CP β75 ns - ns -
POE Æ IP β70 0.06 0.18 ns -
POE Æ CE β74 * 0.22 ns -
NOE Æ CP β65 ns - ns -
NOE Æ IP β60 ns - ns -
CE Æ CP β45 * 0.29 ns 0.23
CE Æ E β43 ns - ** 0.39
CE Æ ISI β41 ns - * 0.23
CE Æ IP β40 * 0.17 ns -
CP Æ E β41 ** 0.29 ns -
CP Æ IP β50 ns - * 0.14
E Æ T β32 * 0.5 ** 0.45
T Æ ISI β21 ** 0.28 0.06 0.17
ISI Æ IP β10 ** 0.75 ** 0.57
A. Model one (result from n= 322)
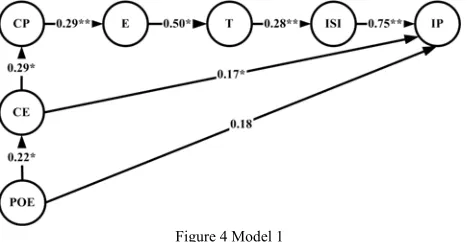
The estimated of the model 1 (Fig. 4) indicated three paths of direct relation to variable intention to prepare. The paths are from intention to seek for information (ISI), collective efficacy (CE) and positive outcome expectancy (POE) variables. The estimated results confirm the validity of the model as a predictor on volcanic hazard preparedness.
The Goodness-of-Fit statistics for the model one are: (χ2 = 193.88, df = 222, p = 0.91), RMSEA = 0.00, NFI = 0.88, GFI = 0.96. The p value of 0.91 indicates that the difference between the actual and estimated model is non-significant. Thus, the estimated model is a close fit to the data. Furthermore, other measures (RMSEA, NFI and GFI) also verify the validity of the model. In general, the model explains 64% of the variance in ‘intention to prepare’ for volcanic hazards. The NFI illustrate an indication of the improvement (1-NFI). Thus, an NFI of 0.88 indicates a measure of improvement of merely 0.12. The overall goodness of fit of the model supports the value of the model as a means for understanding how community members make decisions about preparing for volcanic hazard risks.
B. Model 2 (result from n = 307)
The estimates of model 2 (Fig. 5) indicate two significant paths of direct relation to IP. The paths are from ISI, CP variables. The model indicates contributions from community and institutional variables but no direct relationship exists from any personal variable in this model. Thus, personal level variables are omitted in the model. The model 2 suggests that the ‘intention to prepare’ (IP) is mainly predicted by community participation (CP) and intention to seek for information (ISI). ISI, however, is predicted by both the ‘collective efficacy’ and ‘trust’ variables. The figure clearly suggests the central role of CE as the start of the model.
The Goodness-of-Fit statistics of the model 2 are: (χ2 = 331.9, df = 340, p = 0.61), RMSEA = 0.00, NFI = 0.83, GFI = 0.94. The p value of 0.61 indicates that the difference between the actual and estimated model is non-significant. Thus, the estimated model is a close fit to the data. Other measures (RMSEA, NFI and GFI) also confirms the strength of the model. In general, the model accounts for 35% of the variance in ‘intention to prepare’ for volcanic hazards. The Normed Fit Index (NFI) illustrates an indication of the improvement (1-NFI). Thus, an NFI of 0.83 indicates a measure of improvement of merely 0.17. This is a good value since it is close to 0.90. The overall goodness of fit of the model supports
the value of the model as a means for understanding how community members make decisions about preparing for volcanic hazard risks.
V. DISCUSSION
Our analyses clearly indicated that community variables (CE and CP) and institutional factors make a strong contribution to the formation of social resilience in both models. Consistent with other studies by Paton et al [3,4], this study suggests that the social resilience is based on the characteristics of the society. In contrast to the findings in more individualistic cultures like New Zealand, where personal level factors tend to play more dominant roles [3], the findings from the collectivistic communities surrounding Mt. Merapi demonstrate how the community-level factors play more significant roles.
The estimated model 1 shows that intention to prepare is directly predicted by three factors: intention to seek for information, collective efficacy and positive outcome expectancy. Evidence for the mediating role of community-level factors (i.e. CP and CE) supports the view that relationships between people in the community play a highly significant role in facilitating disaster preparedness.. Thus, the finding suggests promoting the disaster preparedness activities at community level will be crucial to the development of effective risk management strategies for this population.
The model reveals that individual-level factors were considerably less important than collective processes (e.g., CP) and competencies (e.g., CE) in predicting intention to prepare. These findings reflect the fact that in a more collective society, preparedness is a collective activity that emerges when community members share their views with their neighbors or with those who share values with them.
Model 1 indicated that amongst members of communities in collectivistic cultures, like those living in the vicinity of Merapi Volcano, individual-level predictors play a less significant role in preparedness decision making than is the case in members of more individualistic cultures [3]. There is a direct relationship between POE to IP in the model 1. As such, it offers tentative support for the existence of this direct path in the hypothesized model. The model 2, however, the authors argue that neither NOE nor POE makes a significant contribution to intentions, either directly or indirectly through community and institutional variables (Fig. 5). Thus, both NOE and POE variables were omitted in the model 2.
Figure 5 Model 2
(χ2 = 331.9, df = 340, p = 0.61), RMSEA = 0.00, NFI = 0.83, GFI = 0.94
* significant at 0.05, ** significant at 0.01
Figure 4 Model 1
(χ2 = 193.88, df = 222, p = 0.91), RMSEA = 0.00, NFI = 0.88, GFI = 0.96.
As predicted, the community factors (CE and CP) in both models confirm the vital role of social interactions with other people who face similar threats (share the living location), beliefs and values plays in influencing community members risk management decisions. The strong roles of collective efficacy in the model signify the fact that some people look to learn from their community capabilities before they take action to prepare. People look at their relatives before they make major decisions such as those involved in preparing for a disaster that will have community wide implications. No direct relationship between community participation and intention to prepare was found in model 1. This was unexpected since the spirit of “working together” is apparent in this community. However, the result is different in model 2, which supports a direct relationship between community participation and intention to prepare.
As predicted, paths from institutional factors (empowerment and trust) show significant relationships in the model 1. This finding means the communities need institutional supports to facilitate their knowledge of disaster risk. Surprisingly, variable trust has a low level of significance with intention to seek for information in model 2. For example: during the periods of evacuation, community members tend to be dependent on the assistance of the government that guides them to the shelter and provides a sufficient evacuation shelter. Positive experiences with agencies under these circumstances will engender trust.
The relationships evident between community and institutional factors supports the view that the more people feel they are empowered by institutions, the more they trust these institutions are sources of information, and the more likely they are to seek information from these sources and to use it to formulate their disaster preparedness plans (intentions). It is noteworthy to mention the role of hamlet leader (kepala dusun) as a vocal point that the residents refer to prior to taking action. Taken together, the above discussion suggests that, with the exception of the NOE variable, similarity between the Merapi model and the original model supports the existence of cross-cultural equivalence for this model.
VI. CONCLUSION
This study demonstrates the systematic analysis of socio-psychological factors contributing to the development of social resilience. Findings in this study are important for developing a suitable risk communication for Mt. Merapi and other communities facing similar conditions. The findings suggest messages should be communicated through risk communication method which is adjusted to the level of understanding of the communities and that communication in the community will work through the members.
Our study suggests that if one aims to increase a social resilience of a society, it is important to understand socio-psychological variable that governs the individuals’ decisions in the society. Our data, which are originating from the context of a more collective society, suggest that community variables are the major contributors to the development of social resilience. In this matter, we propose that an approach to increasing social resilience should be carried out and integrated
with particular attention being directed to community variables. Only by doing so, will a sustainable level of community resilience ensue.
ACKNOWLEDGMENT
S. Sagala thanks the Institute for Forest and Environment Yogyakarta for their assistance during the data collection in January-February 2008 and their research grant funded by Provention Consortium. The authors are grateful to the comments made by anonymous reviewers. The authors alone are responsible for the analysis presented in this paper.
REFERENCES
[1] R. Klein, R. Nicholls and F. Thomalla, “Resilience to natural hazards: How useful is this concept?”, Environmental Hazards, 2003, Vol. 5, pp. 35-45.
[2] W. Adger, “Social and ecological resilience: are they related?”, Progress in Human Geography, 2000, Vol. 24(3), pp. 347-364.
[3] D. Paton, L. Smith, M. Daly and D. Johnston, “Risk perception and volcanic hazard mitigation: Individual and social perspectives”, Journal of Volcanological and Geothermal Research, 2008, Vol 172, pp. 179-188.
[4] D. Paton, L. Smith and D. Johnston, “When good intentions turn bad: promoting natural hazard preparedness”, Australian Journal of Emergency Management, Vol. 20, p. 25-30.
[5] M. Lindell and D. Whitney, “Correlates of household seismic hazard adjustment option”, Risk Analysis, 2000, Vol. 20(1), pp. 13-25. [6] W. Adger, T. Hughes, C. Folke, S. Carpenter and J. Rockstrom,
“Social-ecological resilience to coastal disasters”, Science, 2005, Vol 309, pp. 1036-1039.
[7] B. Wisner, P. Blaikie, T. Cannon and I. Davis, “At Risk”, 2004, Routledge, London.
[8] F. Lavigne, B. De Coster, N. Juvin, F. Flohic, J. Gaillard, P. Texier, J. Morin and J. Sartohadi, “People's behaviour in the face of volcanic hazards: Perspectives from Javanese communities, Indonesia'. Journal of Volcanology and Geothermal Research, 2008, Vol 172, pp 273-287. [9] M. Dove, “Perception of volcanic eruption as agent of change on Merapi
Volcano, Journal of Volcanology and Geothermal Research, 2008, Vol 172, pp 329-337.
[10] A. Ratdomopurbo, Subandriyo, Y. Sulistiyo, and Suharna, “Precursor of Mt. Merapi Eruption”, 2006, Volcanological Survey of Indonesia, Yogyakarta.
[11] E. Cheng, “SEM being more effective than multiple regression in parsimonious model testing for management development research”, Journal of Management Development, 2001, Vol 20(7), pp. 650-667. [12] R. Kline, “Principles and practice of structural equation modeling”, 2005,
The Guilford Press.
[13] E. Eng and E. Parker, “Measuring community competence in the Mississippi Delta, Health Education Quarterly, 1994, Vol. 21, pp. 199-220.
[14] S. Zaccaro, V. Blair, C. Peterson and M. Zazanis, “Collective efficacy” in. J. Maddux (Ed.), Self-Efficacy, adaptation and instrument, 1995, pp.305-328. New York, Plenum Press.
[15] .P. Speer and N. Peterson, “Psychometric properties of an empowerment scale: testing cognitive, emotional and behavioral domains”, Social Work Research, 2000, pp. 109-118.
[16] M. Lindell and R. Perry, Communicating Environmental Risk in Multiethnic Communities, 2004, Sage Publication.
[17] S. Sagala and N. Okada, “How do hazard-related factors and cultural beliefs affect evacuation? A case study: Communities in Mt. Merapi, Indonesia, unpublished.